CPUC Decision on San Diego Community Power directs SDG&E to use updated forecasts, stabilizing electricity rates for CCA customers and supporting clean energy in San Diego with accurate rate forecasting and reduced volatility.
Key Points
A CPUC ruling directing SDG&E to use updated forecasts to ensure accurate, stable CCA rates and limit volatility.
✅ Uses 2021 sales forecasts for rate setting
✅ Aims to prevent undercollection and bill spikes
✅ Levels changes across customer classes
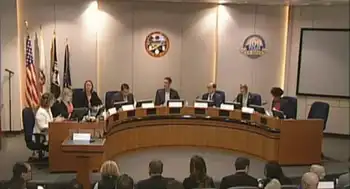
The California Public Utilities Commission on Thursday sided with the soon-to-launch San Diego community energy program in a dispute it had with San Diego Gas & Electric.
San Diego Community Power — which will begin to purchase power for customers in San Diego, Chula Vista, La Mesa, Encinitas and Imperial Beach later this year — had complained to the commission that data SDG&E intended to use to calculate rates, including community choice exit fees that could make the new energy program less attractive to prospective customers.
SDG&E argued it was using numbers it was authorized to employ as part of a general rate case amid a potential rate structure revamp that is still being considered by the commission.
But in a 4-0 vote, the commission, or CPUC, sided with San Diego Community Power and directed SDG&E to use an updated forecast for energy sales.
"This was not an easy decision," said CPUC president Marybel Batjer at the meeting, held remotely due to COVID-19 restrictions. "In my mind, this outcome best accounts for the shifting realities ... in the San Diego area while minimizing the impact on ratepayers during these difficult financial times."
In filings to the commission, SDG&E predicted a rate decrease of 12.35 percent in the coming year. While that appears to be good news for customers, Californians still face soaring electricity prices statewide, Commissioner Martha Guzman Aceves said the data set SDG&E wanted to use would lead to an undercollection of $150 million to $260 million.
That would result in rates that would be "artificially low," Guzman Aceves said, and rates "would inevitably go up quite a bit after the undercollection was addressed."
San Diego Community Power, or SDCP, said the temporary reduction would make its rates less attractive than SDG&E's, especially amid SDG&E's minimum charge proposal affecting low-usage customers, just as it is about to begin serving customers. SDCP's board members wrote an open letter last month to the commission, accusing the utility of "willful manipulation of data."
Working with an administrative law judge at the CPUC, Guzman Aceves authored a proposal requiring SDG&E to use numbers based on 2021 forecasts, as regulators simultaneously weigh whether the state needs more power plants to ensure reliability. The utility argued that could result in an increase of "roughly 40 percent" for medium and large commercial and industrial customers this year.
To help reduce potential volatility, Guzman Aceves, SDCP and other community energy supporters called for using a formula that would average out changes in rates across customer classes amid debates over income-based utility charges statewide. That's what the commissioners OK'd Thursday.
"It is essential that customer commodity rates be as accurate as we can possibly get them to avoid undercollections," said Commissioner Genevieve Shiroma.
San Diego Community Power is one of 23 community choice aggregation, or CCA, energy programs that have launched in California in the past decade.
CCAs compete with traditional power companies amid California's evolving power competition landscape, in one important role — purchasing power for a given community. They were created to boost the use of cleaner energy sources, such as wind and solar, at rates equal to or lower than investor-owned utilities.
However, CCAs do not replace utilities because the incumbent power companies still perform all of the tasks outside of power purchasing, such as transmission and distribution of energy and customer billing.
When a CCA is formed, California rules stipulate the utility customers in that area are automatically enrolled in the CCA. If customers prefer to stay with their previous power company, they can opt out of joining the CCA.
The shift of customers from SDG&E to San Diego Community Power is expected to be large. The total number of accounts for SDCP is expected to be 770,000, which would make it the second-largest CCA in the state. That's why SDCP considered Thursday's CPUC decision to be so important.
"At a time when customers are choosing between sticking with San Diego Gas & Electric and migrating to a CCA, we want them to have accurate bill information," said Commissioner Clifford Rechtschaffen.
"SDCP is very happy with today's CPUC decision, and that the commissioners shared our goal of limiting rate volatility for businesses and families in the region," said SDCP interim CEO Bill Carnahan. "This is definitely a win for accurate rate forecasting, and our mutual customers, and we look forward to working with SDG&E on next steps."
In an email, SDG&E spokeswoman Helen Gao said, "We are committed to continuing to work collaboratively with local Community Choice Aggregation programs to support their successful launch in 2021 and ensure that our mutual customers receive excellent customer service."
San Diego Community Power's case before the CPUC was joined by the California Community Choice Association, a trade group advocating for CCAs, and the Clean Energy Alliance — the North County-based CCA representing Del Mar, Solana Beach and Carlsbad that is scheduled to launch this summer.
SDCP will begin its rollout this year, folding in about 71,000 municipal, commercial and industrial accounts. The bulk of its roughly 700,000 residential accounts is expected to come in January 2022.
Related News