Yukon Electricity Demand Record underscores peak load growth as winter cold snaps drive heating, lighting, and EV charging, blending hydro, LNG, and diesel with renewable energy and planned grid-scale battery storage in Whitehorse.
Key Points
It is the territory's new peak electricity load, reflecting winter demand, electric heating, EVs, and mixed generation.
✅ New peak: 104.42 MW, surpassing 2020 record of 103.84 MW
✅ Winter peaks met with hydro, LNG, diesel, and renewables mix
✅ Customers urged to shift use off peak hours and use timers
A new record for electricity demand has been set in Yukon. The territory recorded a peak of 104.42 megawatts, according to a news release from Yukon Energy.
The new record is about a half a megawatt higher than the previous record of 103.84 megawatts recorded on Jan. 14, 2020.
While in general, over 90 per cent of the electricity generated in Yukon comes from renewable resources each year, with initiatives such as new wind turbines expanding capacity, during periods of high electricity use each winter, Yukon Energy has to use its hydro, liquefied natural gas and diesel resources to generate the electricity, the release says.
But when it comes to setting records, Andrew Hall, CEO of Yukon Energy, says it's not that unusual.
"Typically, during the winter, when the weather is cold, demand for electricity in the Yukon reaches its maximum. And that's because folks use more electricity for heating their homes, for cooking meals, there's more lighting demand, because the days are shorter," he said.
"It usually happens either in December or sometimes in January, when we get a cold snap."
He said generally over the years, electricity demand has grown.
"We get new home construction, construction of new apartment buildings. And typically, those new homes are all heated by electricity, maybe not all of them but the majority," Hall said.
Vuntut Gwitchin First Nation's solar farm now generating electricity
In taking action on climate, this Arctic community wants to be a beacon to the world
Efforts to curb climate change add to electricity demand
There are also other reasons, ones that are "in the name of climate change," Hall added.
That includes people trying to limit fossil fuel heating by swapping to electric heating. And, he said some Yukoners are switching to electric vehicles as incentives expand across the North.
"Over time, those two new demands, in the name of climate change, will also contribute to growing demand for electricity," he said.
While Yukon did reach this new all time high, Hall said the territory still hadn't hit the maximum capacity for the week, which was 118 megawatts, and discussions about a potential connection to the B.C. grid are part of long-term planning.
Yukon Energy's hydroelectric dam in Whitehorse. Yukon Energy's CEO, Andrew Hall, said demand of 104 megawatts wasn't unexpected, nor was it an emergency. The corporation has the ability to generate 118 megawatts. (Paul Tukker/CBC)
Tips to curve demand
"When we plan our system, we actually plan for a scenario, guided by the view that sustainability is key to the grid's future, where we actually lose our largest hydro generating facility," Hall said.
"We had plenty of generation available so it wasn't an emergency situation, and, even as other provinces face electricity shortages, it was more just an observation that hey, our peaks are growing."
He also said it was an opportunity to reach out to customers on ways to curve their demand for electricity around peak times, drawing on energy efficiency insights from other provinces, which is typically between 7 a.m. and 9 a.m., and between 5 p.m. and 7 p.m., Monday to Friday.
For example, he said, people should consider running major appliances, like dishwashers, during non-peak hours, such as in the afternoon rather than in the morning or evening.
During winter peaks, people can also use a block heater timer on vehicles and turn down the thermostat by one or two degrees.
'We plan for each winter'
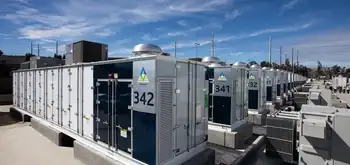
Hall said Yukon Energy is working to increase its peak output, including working on a large grid scale battery to be installed in Whitehorse, similar to Ontario's energy storage push now underway.
When it comes to any added load from people working from home due to COVID-19, Hall said they haven't noticed any identifiable increase there.
"Presumably, if someone's working from home, you know, their computer is at home, and they're not using the computer at the office," he said.
Yukon Energy one step closer to having largest battery storage site in the North
He said there shouldn't be any concern for maxing out the capacity of electricity demand as Yukon moves into the colder winter months, since those days are forecast for.
"This number of 104 megawatts wasn't unexpected," he said, adding how much electricity is needed depends on the weather too.
"We plan for each winter."
Related News