CSA Z462 Arc Flash Training – Electrical Safety Compliance Course
Our customized live online or in‑person group training can be delivered to your staff at your location.

- Live Online
- 6 hours Instructor-led
- Group Training Available
Regular Price:
$249
Coupon Price:
$199
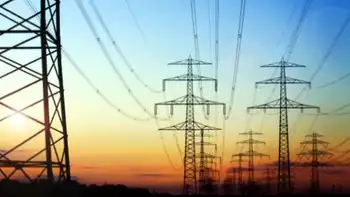
China Guangdong Nuclear Power and its partners, including Shanghai-listed Shenergy, agreed to build a nuclear power plant in the central province of Anhui to cater to rising energy demand.
Guangdong Nuclear, Shenergy, Shanghai Electric Power and Anhui Province Energy Group signed an agreement to jointly invest in the first phase of the nuclear plant, Guangdong Nuclear said in a statement on its Web site.
China wants to increase the use of alternatives like nuclear energy to reduce pollution and dependence on oil and coal. The country needs to add two reactors a year to meet a target of generating 4 percent of its electricity from nuclear plants by 2020 compared with about 2.3 percent now.
The Anhui nuclear plant may cost 46 billion yuan, or $5.84 billion, the state-run Xinhua agency reported in November, citing the local government in the city of Wuhu.
Related News
Hydro once made up around half of Alberta's power capacity. Why does Alberta have so little now?
Alberta Hydropower Potential highlights renewable energy, dams, reservoirs, grid flexibility, contrasting wind and solar growth…
View more
France hopes to keep Brussels sweet with new electricity pricing scheme
France Electricity Pricing Mechanism aligns with EU rules, leveraging nuclear energy and EDF profits, avoiding…
View more
Biden calls for 100 percent clean electricity by 2035. Here’s how far we have to go.
Biden Clean Energy Plan 2035 accelerates carbon-free electricity with renewables, nuclear, hydropower, and biomass, invests…
View more
OEB issues decision on Hydro One's first combined T&D rates application
OEB Hydro One Rate Decision 2023-2027 sets approved transmission and distribution rates in Ontario, with…
View more
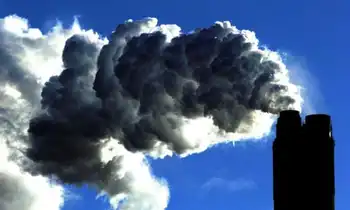
Carbon emissions fall as electricity producers move away from coal
Global Electricity Emissions Decline highlights a 2% drop as coal power falls, while wind and…
View more
Blood Nickel and Canada's Role in Global Mining Sustainability
Blood Nickel spotlights ethical sourcing in the EV supply chain, linking nickel mining to human…
View more
Sign Up for Electricity Forum’s Newsletter
Stay informed with our FREE Newsletter — get the latest news, breakthrough technologies, and expert insights, delivered straight to your inbox.
Electricity Today T&D Magazine Subscribe for FREE

Stay informed with the latest T&D policies and technologies.
- Timely insights from industry experts
- Practical solutions T&D engineers
- Free access to every issue
