Africa Energy Access Funding faces disbursement bottlenecks as SDG 7 goals demand investment in decentralized solar, minigrids, and rural electrification; COVID-19 pressures donors, requiring faster approvals, standardized documentation, and stronger project preparation and due diligence.
Key Points
Financing to expand Africa's electrification, advancing SDG 7 via disbursement to decentralized solar and minigrids.
✅ Accelerates investment for SDG 7 and rural electrification
✅ Prioritizes decentralized solar, minigrids, and utilities
✅ Speeds approvals, standard docs, and project preparation
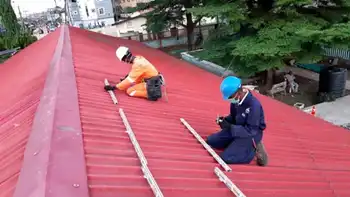
The time frame from final funding approval to disbursement can be the most painful part of any financing process, and the access-to-electricity sector is not spared.
Amid the global spread of the coronavirus over the last few weeks, there have been several funding pledges to promote access to electricity in Africa. In March, the African Development Bank and other partners committed $160 million for the Facility for Energy Inclusion to boost electricity connectivity in Africa through small-scale solar systems and minigrids. Similarly, the Export-Import Bank of the United States allocated $91.5 million for rural electrification in Senegal.
Rockefeller chief wants to redefine 'energy poverty'
Rajiv Shah, president of The Rockefeller Foundation, believes that SDG 7 on energy access lacks ambition. He hopes to drive an effort to redefine it.
Currently, funding is not being adequately deployed to help achieve universal access to energy. The International Energy Agency’s “Africa Energy Outlook 2019” report estimated that an almost fourfold increase in current annual access-to-electricity investments — approximately $120 billion a year over the next 20 years — is required to provide universal access to electricity for the 530 million people in Africa that still lack it.
While decentralized renewable energy across communities, particularly solar, has been instrumental in serving the hardest-to-reach populations, tracking done by Sustainable Energy for All — in the 20 countries with about 80% of those living without access to sustainable energy — suggests that decentralized solar received only 1.2% of the total electricity funding.
The spread of COVID-19 is contributing significantly to Africa’s electricity challenges across the region, creating a surge in the demand for energy from the very important health facilities, an exponential increase in daytime demand as a result of most people staying and working indoors, and a rise from some food processing companies that have scaled up their business operations to help safeguard food security, among others. Thankfully — and rightly so — access-to-electricity providers are increasingly being recognized as “essential service” providers amid the lockdowns across cities.
To start tackling Africa’s electricity challenges more effectively, “funding-ready” energy providers must be able to access and fulfill the required conditions to draw down on the already pledged funding. What qualifies as “funding readiness” is open to argument, but having a clear, commercially viable business and revenue model that is suitable for the target market is imperative.
Developing the skills required to navigate the due-diligence process and put together relevant project documents is critical and sometimes challenging for companies without prior experience. Typically, the final form of all project-related agreements is a prerequisite for the final funding approval.
In addition, having the right internal structures in place — for example, controls to prevent revenue leakage, an experienced management team, a credible board of directors, and meeting relevant regulatory requirements such as obtaining permits and licenses — are also important indicators of funding readiness.
1. Support for project preparation. Programs — such as the Private Financing Advisory Network and GET.invest’s COVID-19 window — that provide business coaching to energy project developers are key to helping surmount these hurdles and to increasing the chances of these projects securing funding or investment. Donor funding and technical-assistance facilities should target such programs.
2. Project development funds. Equity for project development is crucial but difficult to attract. Special funds to meet this need are essential, such as the $760,000 for the development of small-scale renewable energy projects across sub-Saharan Africa recently approved by the African Development Bank-managed Sustainable Energy Fund for Africa.
3. Standardized investment documentation. Even when funding-ready energy project developers have secured investors, delays in fulfilling the typical preconditions to draw down funds have been a major concern. This is a good time for investors to strengthen their technical assistance by supporting the standardization of approval documents and funding agreements across the energy sector to fast-track the disbursement of funds.
4. Bundled investment approvals and more frequent approval sessions. While we implement mechanisms to hasten the drawdown of already pledged funding, there is no better time to accelerate decision-making for new access-to-electricity funding to ensure we are better prepared to weather the next storm. Donors and investors should review their processes to be more flexible and allow for more frequent meetings of investment committees and boards to approve transactions. Transaction reviews and approvals can also be conducted for bundled projects to reduce transaction costs.
5. Strengthened local capacity. African countries must also commit to strengthening the local manufacturing and technical capacity for access-to-electricity components through fiscal incentives such as extended tax holidays, value-added-tax exemptions, accelerated capital allowances, and increased investment allowances.
The ongoing pandemic and resulting impacts due to lack of electricity have further shown the need to increase the pace of implementation of access-to-electricity projects. We know that some of the required capital exists, and much more is needed to achieve Sustainable Development Goal 7 — about access to affordable and clean energy for all — by 2030.
It is time to accelerate our support for access-to-electricity companies and equip them to draw down on pledged funding, while calling on donors and investors to speed up their funding processes to ensure the electricity gets to those most in need.
Related News