Protective Relay Training - Basic
Our customized live online or in‑person group training can be delivered to your staff at your location.

- Live Online
- 12 hours Instructor-led
- Group Training Available
Regular Price:
$699
Coupon Price:
$599
WASHINGTON
—
U.S. Utility Spending Shift highlights rising transmission and distribution costs, grid modernization, and smart meters, while generation expenses decline amid fuel price volatility, capital and labor pressures, and renewable integration across the power sector.
What You Need to Know
A decade-long trend where utilities spend more on delivery and grid upgrades, and less on electricity generation costs.
Delivery O&M, wires, poles, and meters drive rising costs
Generation spending declines amid fuel price changes and PPI
Grid upgrades add reliability, resilience, and renewable integration
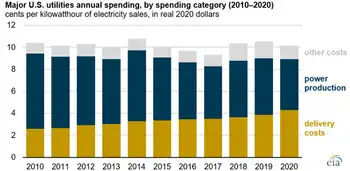
Over the past decade, major utilities in the United States have been spending more on delivering electricity to customers and less on producing that electricity, a shift occurring as electricity demand is flat across many regions.
After adjusting for inflation, major utilities spent 2.6 cents per kilowatthour (kWh) on electricity delivery in 2010, using 2020 dollars. In comparison, spending on delivery was 65% higher in 2020 at 4.3 cents/kWh, and residential bills rose in 2022 as inflation persisted. Conversely, utility spending on power production decreased from 6.8 cents/kWh in 2010 (using 2020 dollars) to 4.6 cents/kWh in 2020.
Utility spending on electricity delivery includes the money spent to build, operate, and maintain the electric wires, poles, towers, and meters that make up the transmission and distribution system. In real 2020 dollar terms, spending on electricity delivery increased every year from 1998 to 2020 as utilities worked to replace aging equipment, build transmission infrastructure to accommodate new wind and solar generation amid clean energy transition challenges that affect costs, and install new technologies such as smart meters to increase the efficiency, reliability, resilience, and security of the U.S. power grid.
Spending on power production includes the money spent to build, operate, fuel, and maintain power plants, as well as the cost to purchase power in cases where the utility either does not own generators or does not generate enough to fulfill customer demand. Spending on electricity production includes the cost of fuels including natural gas prices alongside capital, labor, and building materials, as well as the type of generators being built.
Other utility spending on electricity includes general and administrative expenses, general infrastructure such as office space, and spending on intangible goods such as licenses and franchise fees, even as electricity sales declined in recent years.
The retail price of electricity reflects the cost to produce and deliver power, the rate of return on investment that regulated utilities are allowed, and profits for unregulated power suppliers, and, as electricity prices at 41-year high have been reported, these components have drawn increased scrutiny.
In 2021, demand for consumer goods and the energy needed to produce them has been outpacing supply, though power demand sliding in 2023 with milder weather has also been noted. This difference has contributed to higher prices for fuels used by electric generators, especially natural gas. The increased cost for fuel, capital, labor, and building materials, as seen in the U.S. Bureau of Labor Statistics’ Producer Price Index, is increasing the cost of power production for 2021. U.S. average electricity prices have been higher every month of this year compared with 2020, according to our Monthly Electric Power Industry Report.
Related News
Related News
Fuel Cell Electric Buses Coming to Mississauga
Mississauga Fuel Cell Electric Buses advance zero-emission public transit, leveraging hydrogen fuel cells, green hydrogen…
View more

NEW Hydro One shares down after Ontario government says CEO, board out
Hydro One Leadership Shakeup unsettles investors as Ontario government ousts CEO and board, pressuring shares;…
View more

Tackling climate change with machine learning: Covid-19 and the energy transition
Covid-19 Energy Transition and Machine Learning reshape climate change policy, electricity planning, and grid operations,…
View more

OPG, TVA Partner on New Nuclear Technology Development
OPG-TVA SMR Partnership advances advanced nuclear technology and small modular reactors for 24/7 carbon-free baseload…
View more
N.B. Power hits pause on large new electricity customers during crypto review
N.B. Power Crypto Mining Moratorium underscores electricity demand risks from bitcoin mining, straining the energy…
View more

Vancouver's Reversal on Gas Appliances
Vancouver Natural Gas Ban Reversal spotlights energy policy, electrification tradeoffs, heat pumps, emissions, grid reliability,…
View more
Sign Up for Electricity Forum’s Newsletter
Stay informed with our FREE Newsletter — get the latest news, breakthrough technologies, and expert insights, delivered straight to your inbox.
Electricity Today T&D Magazine Subscribe for FREE

Stay informed with the latest T&D policies and technologies.
- Timely insights from industry experts
- Practical solutions T&D engineers
- Free access to every issue
