Manus Island Naval Base strengthens US-Australia-PNG cooperation at Lombrum, near the South China Sea, bolstering sovereignty, maritime rights, and Pacific security amid APEC talks, infrastructure investment, and Belt and Road competition.
Key Points
A US-Australia-PNG facility at Lombrum to bolster Pacific security and protect maritime rights across the region.
✅ Shared by US, Australia, and PNG at Lombrum on Manus Island
✅ Near South China Sea, reinforcing maritime security and access
✅ Counters opaque lending, aligns with free trade and infrastructure
Scott Morrison has caught himself bang in the middle of escalating tensions between the United States and China.
The US and Australia will share a naval base in the north end of Papua New Guinea on Manus Island, creating another key staging point close to the contested South China Sea.
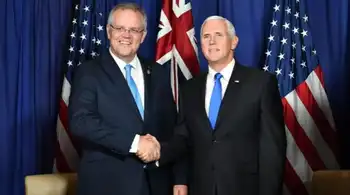
“The United States will partner with Papua New Guinea and Australia on their joint initiative at Lombrum Naval Base,” US Vice President Mike Pence said.
“We will work with these two nations to protect sovereignty and maritime rights in the Pacific Islands. ”
At an Asia Pacific Economic Cooperation meeting in Port Moresby on Saturday, Mr Morrison urged nations to embrace free trade and avoid “unsustainable debt”, as the Philippines' clean energy commitment also featured in discussions.
He confirmed the US and Australia will share an expanded naval base on Manus Island, as the US ramped up rhetoric against China.
Mr Pence quoted President Donald Trump in his speech following Chinese President Xi Jinping, even as a Biden energy agenda is seen by some as better for Canada.
“We have great respect for President Xi and respect for China. But in the president’s words, China’s taken advantage of the United States for many, many years,” he said.
“And those days are over.”
His speech was met with stony silence from the Chinese delegation, after President Xi had reassured leaders his Belt and Road Initiative was not a debt trap.
China has also been at loggerheads with the United States over its territorial ambitions in the Pacific, encapsulated by Xi’s Belt and Road Initiative.
Unveiled in 2013, the Belt and Road initiative aims to bolster a sprawling network of land and sea links with Southeast Asia, Central Asia, the Middle East, Europe and Africa.
China’s efforts to win friends in the resource-rich Pacific have been watched warily by the traditionally influential powers in the region — Australia and the United States.
“It is not designed to serve any hidden geopolitical agenda,” President Xi said on Saturday.
“Nor is it a trap, as some people have labelled it.”
But Mr Pence said loans to developing countries were too often opaque and encouraged nations to look to the US instead of China.
“Too often they come with strings attached and lead to staggering debt,” he said in his speech.
“Do not accept foreign debt that could compromise your sovereignty.
“Just like America, always put your country first.”
Mr Morrison committed Australia to look to the Pacific nations and on Sunday he will host an informal BBQ with Pacific leaders, amid domestic moves like Western Australia's electricity bill credit for households.
He also announced a joint partnership with Japan and the US to fund infrastructure around the region, while at home debates over an electricity market overhaul continue.
On the back of Mr Morrison’s defence of free trade at the summit, Australian Trade Minister Simon Birmingham said he was confident the US was interested in an open trading environment in the long run, with parallel discussions such as a U.S.-Canada energy partnership underscoring regional economic ties.
Australia is hoping the US will, in the end, take a similar approach to its trade dispute with China as it did with its tariff threats against Mexico and Canada, as cross-border negotiations like the Columbia River Treaty continue to shape U.S.-Canada ties.
“Ultimately, they laid down arms, they walked away from threats, and they struck a new trade deal that ensures trade continues in that North American bloc,” Mr Birmingham told ABC TV on Sunday.
“We hope the same will happen in relation to China.”
Four countries including the US have signed up to an effort to bring electricity to 70 per cent of Papua New Guinea’s people by 2030.
Australia, Japan, the US and New Zealand on Sunday signed an agreement to work with Papua New Guinea’s government on electrification.
It’s the latest sign of great power rivalry in the South Pacific, where China is vying with the US and its allies for influence.
Related News