CSA Z462 Arc Flash Training – Electrical Safety Compliance Course
Our customized live online or in‑person group training can be delivered to your staff at your location.

- Live Online
- 6 hours Instructor-led
- Group Training Available
Regular Price:
$249
Coupon Price:
$199
TEHRAN
—
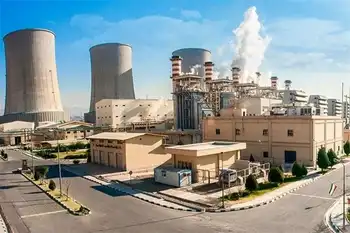
Iran Combined-Cycle Power Plants drive energy efficiency, cut greenhouse gases, and expand megawatt capacity by converting thermal units; MAPNA-led upgrades boost grid reliability, reduce fuel use, and accelerate electricity generation growth nationwide.
Context and Background
Upgraded thermal plants that reuse waste heat to boost efficiency, cut emissions, and add capacity to Iran's grid.
27 thermal plants converted to combined cycle to date
Up to 160 units eligible; +12,600 MW additional capacity
Combined cycle share: 25,083 MW (31.2%) of national capacity
Conversion takes 1-2 years; full thermal fleet in about 5 years
Boosts grid reliability, cuts fuel use, and supports power exports
Iran has turned six percent of its thermal power plans into combined cycle plants in order to reduce greenhouse gases and save energy, with potential to lift thermal plants' PLF under rising demand, IRNA reported, quoting an energy official.
According to the MAPNA Group’s Managing Director Abbas Aliabadi, so far 27 thermal power plants have been converted to combined-cycle ones, aligning with Iran’s push to transmit power to Europe as a regional hub.
“The conversion of a thermal power plant to a combined cycle one takes about one to two years, however, it is possible for us to convert all the country’s thermal power plants into combined cycle plants over a five-year period.
Currently, a total of 478 thermal power plants are operating throughout Iran, of which 160 units could be turned into combined cycle plants. In doing so, 12,600 megawatts will be added to the country’s power capacity, supporting ongoing exports such as supplying a large share of Iraq's electricity under existing arrangements.
Related cross-border work includes deals to rehabilitate Iraq's power grid that support future exchanges.
As reported by IRNA on Wednesday, Iran’s Nominal electricity generation capacity has reached 80,509 megawatts (80.509 gigawatts), and it is deepening energy cooperation with Iraq to bolster regional reliability. The country increased its electricity generation capacity by 500 megawatts (MW) compared to the last year (ended on March 20).
Currently, with a total generation capacity of 25,083 MW (31.2 percent) combined cycle power plants account for the biggest share in the country’s total power generation capacity followed by gas power plants generating 29.9 percent, amid global trends where renewables are set to eclipse coal and regional moves such as Israel's coal reduction signal accelerating shifts. EF/MA
Related News
Related News

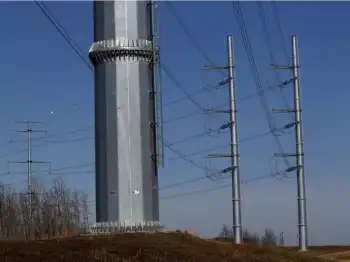
National Energy Board hears oral traditional evidence over Manitoba-Minnesota transmission line
Manitoba-Minnesota Transmission Line connects Bipole III to Minnesota, raising export capacity, as NEB hearings weigh…
View more
Opinion: Now is the time for a western Canadian electricity grid
Western Canada Electric Grid could deliver interprovincial transmission, reliability, peak-load support, reserve sharing, and wind…
View more

Tesla reduces Solar + home battery pricing following California blackouts
Tesla Solar and Powerwall Discount offers a ~10% installation price cut amid PG&E blackouts, helping…
View more

Is The Global Energy Transition On Track?
Global Decarbonization Strategies align renewable energy, electrification, clean air policies, IMO sulfur cap, LNG fuels,…
View more

Electric vehicles are a hot topic in southern Alberta
Canada Electric Vehicle Adoption is accelerating as EV range doubles, fast-charging networks expand along the…
View more
Portland General Electric Program Will Transform Hundreds of Homes Into a Virtual Power Plant
PGE Residential Energy Storage Pilot aggregates 525 home batteries into a virtual power plant, enabling…
View more
Sign Up for Electricity Forum’s Newsletter
Stay informed with our FREE Newsletter — get the latest news, breakthrough technologies, and expert insights, delivered straight to your inbox.
Electricity Today T&D Magazine Subscribe for FREE

Stay informed with the latest T&D policies and technologies.
- Timely insights from industry experts
- Practical solutions T&D engineers
- Free access to every issue

