WikiLeaks reveal Alberta power plans

By CBC.ca


Substation Relay Protection Training

Our customized live online or in‑person group training can be delivered to your staff at your location.

  • Live Online
  • 12 hours Instructor-led
  • Group Training Available
Regular Price:
$699
Coupon Price:
$599
Reserve Your Seat Today
Internal U.S. documents published by WikiLeaks are raising questions about whether the Alberta government plans to export electricity to the United States.

The leaked internal U.S. diplomatic cables reveal that Murray Smith, Alberta's former energy minister, told U.S. officials in 2003 that excess electricity generated for oil sands operations could be made available for export.

According to the documents, Smith said Alberta lacked the transmission lines needed to export the power to the United States.

"But at least for now there is limited capacity to move this west and then south through British Columbia and on to our Pacific Northwest," the cable notes.

"There is almost no capacity to move it south into the U.S. Rocky Mountain states and markets further afield."

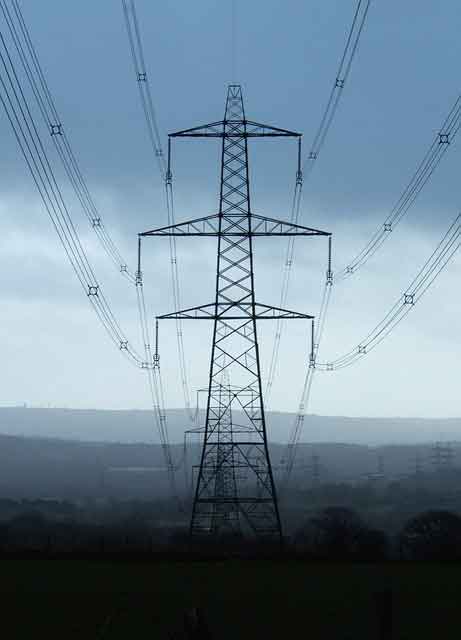
Opposition parties say a proposed multi-billion dollar north-south transmission line will be used to export that power even though the Stelmach government has denied it.

"There's nothing necessarily wrong with exporting surplus power to the United States," NDP Leader Brian Mason said.

"But by hiding it, they're proceeding with a policy that will require Albertans through their electricity bill to pay for this transmission infrastructure which is worth billions and billions of dollars."

Related News

Ontario Teachers' Plan Acquires Brazilian Electricity Transmission Firm Evoltz

Ontario Teachers' Evoltz Acquisition expands electricity transmission in Brazil, adding seven grid lines across ten states, aligning infrastructure strategy with inflation-linked cash flows, renewable energy integration, Latin America and net-zero objectives pending regulatory approvals.


Key Points

A 100% purchase of Brazil's Evoltz, adding seven grid lines and delivering stable, inflation-linked cash flows.

✅ 100% stake in Evoltz with seven transmission lines

✅ Aligns with net-zero and renewable energy strategy

✅ Inflation-linked, core infrastructure cash flows in Brazil


The Ontario Teachers’ Pension Plan has acquired Evoltz Participações, an electricity transmission firm in Brazil, from US asset manager TPG. 

The retirement system took a 100% stake in the energy firm, Ontario Teachers’ said Monday. The acquisition has netted the pension fund seven electricity transmission lines that service consumers and businesses across 10 states in Brazil, amid dynamics similar to electricity rate reductions for businesses seen in Ontario. The firm was founded by TPG just three years ago. 

“Our strategy focuses on allocating significant capital to high-quality core infrastructure assets with lower risks and stable inflation-linked cash flows,” Dale Burgess, senior managing director of infrastructure and natural resources at Ontario Teachers, said in a statement. “Electricity transmission businesses are particularly attractive given their importance in facilitating a transition to a low-carbon economy.” 

The pension fund has invested in other electricity distribution companies recently. In March, Ontario Teachers’ took a 40% stake in Finland’s Caruna, and agreed to acquire a 25% stake in SSEN Transmission in the UK grid. For more than a decade, it has maintained a 50% stake in Chile-based transmission firm Saesa. 

The investment into Evoltz demonstrates Ontario Teachers’ growing portfolio in Brazil and Latin America, while activity in Ontario such as the Peterborough Distribution sale reflects ongoing utility consolidation. In 2016, the firm, with the Canada Pension Plan Investment Board (CPPIB), invested in toll roads in Mexico. They took a 49% stake with Latin American infrastructure group IDEAL. 

Evoltz, which delivers renewable energy, will also help decarbonize the pension fund’s portfolio. In January, the fund pledged to reach net-zero carbon emissions by 2050. Last year, Ontario Teachers’ issued its first green bond offering. The $890 million 10-year bond will help the retirement system fund sustainable investments aligned with policy measures like Ontario's subsidized hydro plan during COVID-19. 

However, Ontario Teachers’ has also received criticism for its investment into parts of Abu Dhabi’s gas pipeline network, and investor concerns about Hydro One highlight sector uncertainties. Last summer, it joined other institutional investors in investing $10.1 billion for a 49% stake. 

As of December, Ontario Teachers’ reached a portfolio with C$221.2 billion (US$182.5 billion) in assets. Since 1990, the fund has maintained a 9.6% annualized return. Last year, it missed its benchmark with an 8.6% return, with examples such as Hydro One shares fall after shake-up underscoring market volatility.

The pension fund expects the deal will close later this fall, pending closing conditions and regulatory approvals, including decisions such as the OEB combined T&D rates ruling that shape utility economics. 


Related News

View more

Solar PV and wind power in the US continue to grow amid favourable government plans

US Renewable Power Outlook 2030 projects surging capacity, solar PV and wind growth, grid modernization, and favorable tax credits, detailing market trends, CAGR, transmission expansion, and policy drivers shaping clean energy generation and consumption.


Key Points

A forecast of US power capacity, generation, and consumption, highlighting solar, wind, tax credits, and grid modernization.

✅ Targets 48.4% renewable capacity share by 2030

✅ Strong growth in solar PV and onshore wind installations

✅ Investment and tax credits drive grid and transmission upgrades


GlobalData’s latest report, ‘United States Power Market Outlook to 2030, Update 2021 – Market Trends, Regulations, and Competitive Landscape’ discusses the power market structure of the United States and provides historical and forecast numbers for capacity, generation and consumption up to 2030. Detailed analysis of the country’s power market regulatory structure, competitive landscape and a list of major power plants are provided. The report also gives a snapshot of the power sector in the country on broad parameters of macroeconomics, supply security, generation infrastructure, transmission and distribution infrastructure, about a quarter of U.S. electricity from renewables in recent years, electricity import and export scenario, degree of competition, regulatory scenario, and future potential. An analysis of the deals in the country’s power sector is also included in the report.

Renewable power held a 19% share of the US’s total power capacity in 2020, and in that year renewables became the second-most prevalent source in the U.S. electricity mix by generation; this share is expected to increase significantly to 48.4% by 2030. Favourable policies introduced by the US Government will continue to drive the country’s renewable sector, particularly solar photovoltaics (PV) and wind power, with wind now the most-used renewable source in the U.S. generation mix. Installed renewable capacity* increased from 16.5GW in 2000 to 239.2GW in 2020, growing at a compound annual growth rate (CAGR) of 14.3%. By 2030, the cumulative renewable capacity is expected to rise to 884.6GW, growing at a CAGR of 14% from 2020 to 2030. Despite increase in prices of renewable equipment, such as solar modules, in 2021, the US renewable sector will show strong growth during the 2021 to 2030 period as this increase in equipment prices are short term due to supply chain disruptions caused by the Covid-19 pandemic.

The expansion of renewable power capacity during the 2000 to 2020 period has been possible due to the introduction of federal schemes, such as Production Tax Credits, Investment Tax Credits and Manufacturing Tax Credits. These have massively aided renewable installations by bringing down the cost of renewable power generation and making it at par with power generated from conventional sources. Over the last few years, the cost of solar PV and wind power installations has declined sharply, and by 2023 wind, solar, and batteries made up most of the utility-scale pipeline across the US, highlighting investor confidence. Since 2010, the cost of utility-scale solar PV projects decreased by around 82% while onshore wind installations decreased by around 39%. This has supported the rapid expansion of the renewable market. However, the price of solar equipment has risen due to an increase in raw material prices and supply shortages. This may slightly delay the financing of some solar projects that are already in the pipeline.

The US will continue to add significant renewable capacity additions during the forecast period as industry outlooks point to record solar and storage installations over the coming years, to meet its target of reaching 80% clean energy by 2030. In November 2021, President Biden signed a $1tr Infrastructure Bill, within which $73bn is designated to renewables. This includes not just renewable capacity building, but also strengthening the country’s power grid and laying new high voltage transmission lines, both of which will be key to driving solar and wind power capacity additions as wind power surges in the U.S. electricity mix nationwide.

The US was one of the worst hit countries in the world due to the Covid-19 pandemic in 2020. With respect to the power sector, the electricity consumption in the country declined by 2.5% in 2020 as compared to 2019, even as renewable electricity surpassed coal in 2022 in the generation mix, highlighting continued structural change. Power plants that were under construction faced delays due to unavailability of components due to supply chain disruptions and unavailability of labour due to travel restrictions.

According to the US Energy Information Administration, 61 power projects, having a total capacity of 2.4GWm which were under construction during March and April 2020 were delayed because of the Covid-19 pandemic. Among renewable power technologies, solar PV and wind power projects were the most badly affected due to the pandemic.

In March and April 2020, 53 solar PV projects, having a total capacity of 1.3GW, and wind power projects, having a total capacity of 1.2GW, were delayed due to the Covid-19 pandemic. Moreover, several states suspended renewable energy auctions due to the pandemic.

For instance, New York State Energy Research and Development Authority (NYSERDA) had issued a new offshore wind solicitation for 1GW and up to 2.5GW in April 2020, but this was suspended due to the Covid-19 pandemic. In July 2020, the authority relaunched the tender for 2.5GW of offshore wind capacity, with a submission deadline in October 2020.

To ease the financial burden on consumers during the pandemic, more than 1,000 utilities in the country announced disconnection moratoria and implemented flexible payment plans. Duke Energy, American Electric Power, Dominion Power and Southern California Edison were among the major utilities that voluntarily suspended disconnections.


Related News

View more

Ontario's electricity 'recovery rate' could lead to higher hydro bills

Ontario Hydro Flat Rate sets a single electricity rate at 12.8 cents per kWh, replacing time-of-use pricing for Ontario ratepayers, affecting hydro bills this summer, alongside COVID-19 Energy Assistance Program support.


Key Points

A fixed 12.8 cents per kWh electricity price replacing time-of-use rates across Ontario from June to November.

✅ Single rate applies 24/7, replacing time-of-use pricing

✅ May slightly raise bills versus pre-pandemic usage patterns

✅ COVID-19 aid offers one-time credits for households, small firms


A new provincial COVID-19 measure, including a fixed COVID-19 hydro rate designed to give Ontario ratepayers "stability" on their hydro bills this summer, could result in slightly higher hydro costs over the next four months.

Ontario Premier Doug Ford's government announced over the weekend that consumers would be charged a single around-the-clock electricity rate between June and November, before a Nov. 1 rate increase takes effect, replacing the much-derided time-of-use model ratepayers have complained about for years.

Instead of being charged between 10 to 20 cents per kilowatt hour, depending on the time of day electricity is used, including ultra-low TOU rates during off-peak hours, hydro users will be charged a blanket rate of 12.8 cents per kWh.

"The new rate will simply show up on your bill," Premier Doug Ford said at a Monday afternoon news conference.

While the government said the new fixed rate would give customers "greater flexibility" to use their home appliances without having to wait for the cheapest rate -- and has tabled legislation to lower rates as part of its broader plan -- the new policy also effectively erases a pandemic-related hydro discount for millions of consumers.

For example, a pre-pandemic bill of $59.90 with time-of-use rates, will now cost $60.28 with the government's new recovery rate, as fixed pricing ends across the province, before delivery charges, rebates and taxes.

That same bill would have been much cheaper -- $47.57 -- if the government continued applying the lowest tier of time-of-use 24/7 under an off-peak price freeze as it had been doing since March 24.

The government also introduced support for electric bills with two new assistance programs to help customers struggling to pay their bills.

The COVID-19 Energy Assistance Program will provide a one-time payment consumers to help pay off electricity debt incurred during the pandemic -- which will cost the government $9 million.

The government will spend another $8 million to provide similar assistance to small businesses hit hard by the pandemic.


Related News

View more

No time to be silent on NZ's electricity future

New Zealand Renewable Energy Strategy examines decarbonisation, GHG emissions, and net energy as electrification accelerates, expanding hydro, geothermal, wind, and solar PV while weighing intermittency, storage, materials, and energy security for a resilient power system.


Key Points

A plan to expand electricity generation, balancing decarbonisation, net energy limits, and energy security.

✅ Distinguishes decarbonisation targets from renewable capacity growth

✅ Highlights net energy limits, intermittency, and storage needs

✅ Addresses materials, GHG build-out costs, and energy security


The Electricity Authority has released a document outlining a plan to achieve the Government’s goal of more than doubling the amount of electricity generated in New Zealand over the next few decades.

This goal is seen as a way of both reducing our greenhouse gas (GHG) emissions overall, as everything becomes electrified, and ensuring we have a 100 percent renewable energy system at our disposal. Often these two goals are seen as being the same – to decarbonise we must transition to more renewable energy to power our society.

But they are quite different goals and should be clearly differentiated. GHG emissions could be controlled very effectively by rationing the use of a fossil fuel lockdown approach, with declining rations being available over a few years. Such a direct method of controlling emissions would ensure we do our bit to remain within a safe carbon budget.

If we took this dramatic step we could stop fretting about how to reduce emissions (that would be guaranteed by the rationing), and instead focus on how to adapt our lives to the absence of fossil fuels.

Again, these may seem like the same task, but they are not. Decarbonising is generally thought of in terms of replacing fossil fuels with some other energy source, signalling that a green recovery must address more than just wind capacity. Adapting our lives to the absence of fossil fuels pushes us to ask more fundamental questions about how much energy we actually need, what we need energy for, and the impact of that energy on our environment.

MBIE data indicate that between 1990 and 2020, New Zealand almost doubled the total amount of energy it produced from renewable energy sources - hydro, geothermal and some solar PV and wind turbines.

Over this same time period our GHG emissions increased by about 25 percent. The increase in renewables didn’t result in less GHG emissions because we increased our total energy use by almost 50 percent, mostly by using fossil fuels. The largest fossil fuel increases were used in transport, agriculture, forestry and fisheries (approximately 60 percent increases for each).

These data clearly demonstrate that increasing renewable energy sources do not necessarily result in reduced GHG emissions.

The same MBIE data indicate that over this same time period, the amount of Losses and Own Use category for energy use more than doubled. As of 2020 almost 30 percent of all energy consumed in New Zealand fell into this category.

These data indicate that more renewable energy sources are historically associated with less energy actually being available to do work in society.

While the category Losses and Own Use is not a net energy analysis, the large increase in this category makes the call for a system-wide net energy analysis all the more urgent.

Net energy is the amount of energy available after the energy inputs to produce and deliver the energy is subtracted. There is considerable data available indicating that solar PV and wind turbines have a much lower net energy surplus than fossil fuels.

And there is further evidence that when the intermittency and storage requirements are engineered into a total renewable energy system, the net energy of the entire system declines sharply. Could the Losses and Other Uses increase over this 30-year period be an indication of things to come?

Despite the importance of net energy analysis in designing a national energy system which is intended to provide energy security and resilience, there is not a single mention of net energy surplus in the EA reference document.

So over the last 30 years, New Zealand has doubled its renewable energy capacity, and at the same time increased its GHG emissions and reduced the overall efficiency of the national energy system.

And we are now planning to more than double our renewable energy system yet again over the next 30 years, even as zero-emissions electricity by 2035 is being debated elsewhere. We need to ask if this is a good idea.

How can we expand New Zealand’s solar PV and wind turbines without using fossil fuels? We can’t.

How could we expand our solar PV and wind turbines without mining rare minerals and the hidden costs of clean energy they entail, further contributing to ecological destruction and often increasing social injustices? We can't.

Even if we could construct, deliver, install and maintain solar PV and wind turbines without generating more GHG emissions and destroying ecosystems and poor communities, this “renewable” infrastructure would have to be replaced in a few decades. But there are at least two major problems with this assumed scenario.

The rare earth minerals required for this replacement will already be exhausted by the initial build out. Recycling will only provide a limited amount of replacements.

The other challenge is that a mostly “renewable” energy system will likely have a considerably lower net energy surplus. So where, in 2060, will the energy come from to either mine or recycle the raw materials, and to rebuild, reinstall and maintain the next iteration of a renewable energy system?

There is currently no plan for this replacement. It is a serious misnomer to call these energy technologies “renewable”. They are not as they rely on considerable raw material inputs and fossil energy for their production and never ending replacement.

New Zealand is, of course, blessed with an unusually high level of hydro electric and geothermal power. New Zealand currently uses over 170 GJ of total energy per capita, 40 percent of which is “renewable”. This provides approximately 70 GJ of “renewable” energy per capita with our current population.

This is the average global per capita energy level from all sources across all nations, as calls for 100% renewable energy globally emphasize. Several nations operate with roughly this amount of total energy per capita that New Zealand can generate just from “renewables”.

It is worth reflecting on the 170 GJ of total energy use we currently consume. Different studies give very different results regarding what levels are necessary for a good life.

For a complex industrial society such as ours, 100 GJ pc is said to be necessary for a high levels of wellbeing, determined both subjectively (life satisfaction/ happiness measures), and objectively (e.g. infant mortality levels, female morbidity as an index of population health, access to nutritious food and educational and health resources, etc). These studies do not take into account the large amount of energy that is wasted either through inefficient technologies, or frivolous use, which effective decarbonization strategies seek to reduce.

Other studies that consider the minimal energy needed for wellbeing suggest a much lower level of per capita energy consumption is required. These studies take a different approach and focus on ensuring basic wellbeing is maintained, but not necessarily with all the trappings of a complex industrial society. Their results indicate a level of approximately 20 GJ per capita is adequate.

In either case, we in New Zealand are wasting a lot of energy, both in terms of the efficiency of our technologies (see the Losses and Own Use info above), and also in our uses which do not contribute to wellbeing (think of the private vehicle travel that could be done by active or public transport – if we had good infrastructure in place).

We in New Zealand need a national dialogue about our future. And energy availability is only one aspect. We need to discuss what our carrying capacity is, what level of consumption is sustainable for our population, and whether we wish to make adjustments in either our per capita consumption or our population. Both together determine whether we are on the sustainable side of carrying capacity. Currently we are on the unsustainable side, meaning our way of life cannot endure. Not a good look for being a good ancestor.

The current trajectory of the Government and Electricity Authority appears to be grossly unsustainable. At the very least they should be able to answer the questions posed here about the GHG emissions from implementing a totally renewable energy system, the net energy of such a system, and the related environmental and social consequences.

Public dialogue is critical to collectively working out our future. Allowing the current profit-driven trajectory to unfold is a recipe for disasters for our children and grandchildren.

Being silent on these issues amounts to complicity in allowing short-term financial interests and an addiction to convenience jeopardise a genuinely secure and resilient future. Let’s get some answers from the Government and Electricity Authority to critical questions about energy security.


Related News

View more

Which of the cleaner states imports dirty electricity?

Hourly Electricity Emissions Tracking maps grid balancing areas, embodied emissions, and imports/exports, revealing carbon intensity shifts across PJM, ERCOT, and California ISO, and clarifying renewable energy versus coal impacts on health and climate.


Key Points

An hourly method tracing generation, flows, and embodied emissions to quantify carbon intensity across US balancing areas.

✅ Hourly traces of imports/exports and generation mix

✅ Consumption-based carbon intensity by balancing area

✅ Policy insights for renewables, coal, health costs


In the United States, electricity generation accounts for nearly 30% of our carbon emissions. Some states have responded to that by setting aggressive renewable energy standards; others are hoping to see coal propped up even as its economics get worse. Complicating matters further is the fact that many regional grids are integrated, and as America goes electric the stakes grow, meaning power generated in one location may be exported and used in a different state entirely.

Tracking these electricity exports is critical for understanding how to lower our national carbon emissions. In addition, power from a dirty source like coal has health and environment impacts where it's produced, and the costs of these aren't always paid by the parties using the electricity. Unfortunately, getting reliable figures on how electricity is produced and where it's used is challenging, even for consumers trying to find where their electricity comes from in the first place, leaving some of the best estimates with a time resolution of only a month.

Now, three Stanford researchers—Jacques A. de Chalendar, John Taggart, and Sally M. Benson—have greatly improved on that standard, and they have managed to track power generation and use on an hourly basis. The researchers found that, of the 66 grid balancing areas within the United States, only three have carbon emissions equivalent to our national average, and they have found that imports and exports of electricity have both seasonal and daily changes. de Chalendar et al. discovered that the net results can be substantial, with imported electricity increasing California's emissions/power by 20%.

Hour by hour
To figure out the US energy trading landscape, the researchers obtained 2016 data for grid features called balancing areas. The continental US has 66 of these, providing much better spatial resolution on the data than the larger grid subdivisions. This doesn't cover everything—several balancing areas in Canada and Mexico are tied in to the US grid—and some of these balancing areas are much larger than others. The PJM grid, serving Pennsylvania, New Jersey, and Maryland, for example, is more than twice as large as Texas' ERCOT, in a state that produces and consumes the most electricity in the US.

Despite these limitations, it's possible to get hourly figures on how much electricity was generated, what was used to produce it, and whether it was used locally or exported to another balancing area. Information on the generating sources allowed the researchers to attach an emissions figure to each unit of electricity produced. Coal, for example, produces double the emissions of natural gas, which in turn produces more than an order of magnitude more carbon dioxide than the manufacturing of solar, wind, or hydro facilities. These figures were turned into what the authors call "embodied emissions" that can be traced to where they're eventually used.

Similar figures were also generated for sulfur dioxide and nitrogen oxides. Released by the burning of fossil fuels, these can both influence the global climate and produce local health problems.

Huge variation
The results were striking. "The consumption-based carbon intensity of electricity varies by almost an order of magnitude across the different regions in the US electricity system," the authors conclude. The low is the Bonneville Power grid region, which is largely supplied by hydropower; it has typical emissions below 100kg of carbon dioxide per megawatt-hour. The highest emissions come in the Ohio Valley Electric region, where emissions clear 900kg/MW-hr. Only three regional grids match the overall grid emissions intensity, although that includes the very large PJM (where capacity auction payouts recently fell), ERCOT, and Southern Co balancing areas.

Most of the low-emissions power that's exported comes from the Pacific Northwest's abundant hydropower, while the Rocky Mountains area exports electricity with the highest associated emissions. That leads to some striking asymmetries. Local generation in the hydro-rich Idaho Power Company has embodied emissions of only 71kg/MW-hr, while its imports, coming primarily from Rocky Mountain states, have a carbon content of 625kg/MW-hr.

The reliance on hydropower also makes the asymmetry seasonal. Local generation is highest in the spring as snow melts, but imports become a larger source outside this time of year. As solar and wind can also have pronounced seasonal shifts, similar changes will likely be seen as these become larger contributors to many of these regional grids. Similar things occur daily, as both demand and solar production (and, to a lesser extent, wind) have distinct daily profiles.

The Golden State
California's CISO provides another instructive case. Imports represent less than 30% of its total electric use in 2016, yet California electricity imports provided 40% of its embodied emissions. Some of these, however, come internally from California, provided by the Los Angeles Department of Water and Power. The state itself, however, has only had limited tracking of imported emissions, lumping many of its sources as "other," and has been exporting its energy policies to Western states in ways that shape regional markets.

Overall, the 2016 inventory provides a narrow picture of the US grid, as plenty of trends are rapidly changing our country's emissions profile, including the rise of renewables and the widespread adoption of efficiency measures and other utility trends in 2017 that continue to evolve. The method developed here can, however, allow for annual updates, providing us with a much better picture of trends. That could be quite valuable to track things like how the rapid rise in solar power is altering the daily production of clean power.

More significantly, it provides a basis for more informed policymaking. States that wish to promote low-emissions power can use the information here to either alter the source of their imports or to encourage the sites where they're produced to adopt more renewable power. And those states that are exporting electricity produced primarily through fossil fuels could ensure that the locations where the power is used pay a price that includes the health costs of its production.


Related News

View more

Atlantic grids, forestry, coastlines need rethink in era of intense storms: experts

Atlantic Canada Hurricane Resilience focuses on climate change adaptation: grid hardening, burying lines, coastline resiliency to sea-level rise, mixed forests, and aggressive tree trimming to reduce outages from hurricane-force winds and post-tropical storms.


Key Points

A strategy to harden grids, protect coasts, and manage forests to limit hurricane damage across Atlantic Canada.

✅ Grid hardening and selective undergrounding to cut outage risk.

✅ Coastal defenses: seawalls, dikes, and shoreline vegetation upgrades.

✅ Mixed forests and proactive tree trimming to reduce windfall damage.


In an era when storms with hurricane-force winds are expected to keep battering Atlantic Canada, experts say the region should make major changes to electrical grids, power utilities and shoreline defences and even the types of trees being planted.

Work continues today to reconnect customers after post-tropical storm Dorian knocked out power to 80 per cent of homes and businesses in Nova Scotia. By early afternoon there were 56,000 customers without electricity in the province, compared with 400,000 at the storm's peak on the weekend, a reminder that major outages can linger long after severe weather.

Recent scientific literature says 35 hurricanes -- not including post-tropical storms like Dorian -- have made landfall in the region since 1850, an average of one every five years that underscores the value of interprovincial connections like the Maritime Link for reliability.

Heavy rains and strong winds batter Shelburne, N.S. on Saturday, Sept. 7, 2019 as Hurricane Dorian approaches, making storm safety practices crucial for residents. (Suzette Belliveau/ CTV Atlantic)

Anthony Taylor, a forest ecologist scientist with Natural Resources Canada, wrote in a recent peer-reviewed paper that climate change is expected to increase the frequency of severe hurricanes.

He says promoting more mixed forests with hardwoods would reduce the rate of destruction caused by the storms.

Erni Wiebe, former director of distribution at Manitoba Hydro, says the storms should cause Atlantic utilities to rethink their view that burying lines is too expensive and to contemplate other long-term solutions such as the Maritime Link that enhance grid resilience.

Blair Feltmate, head of the Intact Centre on Climate Change at the University of Waterloo, says Atlantic Canada should also develop standards for coastline resiliency due to predictions of rising sea levels combining with the storms, while considering how delivery rate changes influence funding timelines.

He says that would mean a more rapid refurbishing of sea walls and dike systems, along with more shoreline vegetation.

Feltmate also calls for an aggressive tree-trimming program to limit power outages that he says "will otherwise continue to plague the Maritimes," while addressing risks like copper theft through better security.


Related News

View more

Sign Up for Electricity Forum’s Newsletter

Stay informed with our FREE Newsletter — get the latest news, breakthrough technologies, and expert insights, delivered straight to your inbox.

Electricity Today T&D Magazine Subscribe for FREE

Stay informed with the latest T&D policies and technologies.
  • Timely insights from industry experts
  • Practical solutions T&D engineers
  • Free access to every issue

Download the 2025 Electrical Training Catalog

Explore 50+ live, expert-led electrical training courses –

  • Interactive
  • Flexible
  • CEU-cerified