Green tech bubble concerns grow

By Reuters


High Voltage Maintenance Training Online

Our customized live online or in‑person group training can be delivered to your staff at your location.

  • Live Online
  • 12 hours Instructor-led
  • Group Training Available
Regular Price:
$599
Coupon Price:
$499
Reserve Your Seat Today
Private equity firms are concerned about an investment bubble occurring in the green energy sector, among other hot industries, a survey of more than 200 fund managers said.

The recent credit crisis has made investors cautious and more aware of risks that can arise from crowded investment positions, according to the survey, carried out by tax and accounting services firm Rothstein Kass and released.

Green energy is the sector most likely to produce the next investment bubble, the survey said, with 24 percent of those surveyed highlighting it. Commodities were the second most likely, followed by gold and then financial services.

The respondents answered the questions in January, prior to recent falls in the gold price. The metal, as of May 17, is about $100 below its record highs above $1,575 an ounce set earlier this month.

"I think lot of people are jumping into green and cleantech figuring it's the next place to make money," said Thomas Angell, principal-in-charge of the Private Equity Practice at Rothstein Kass. "For the right technology... there's obviously a price to be paid."

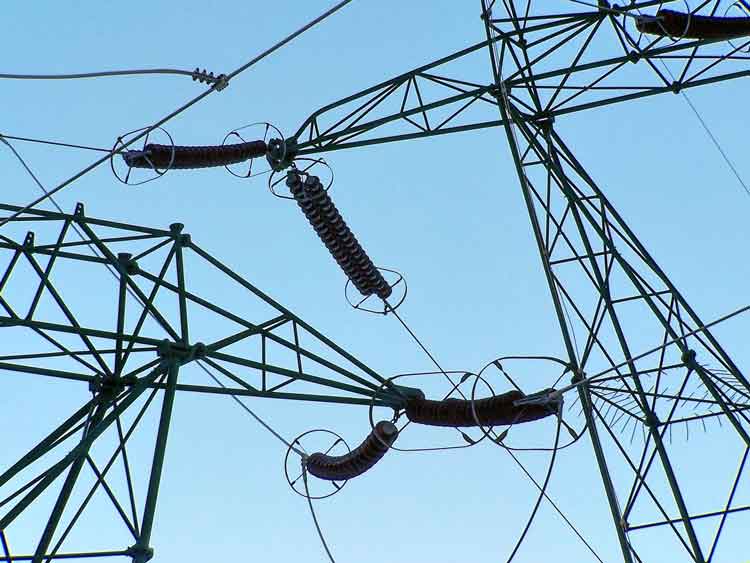
Green energy can include power sources including solar, wind, geothermal and others that have a much lower pollution or carbon footprint than fossil fuels. These are among the fastest growing sources of energy but remain tiny compared with traditional coal, oil and natural gas.

Cleantech companies aim to use technology to reduce pollutants and waste generated by industries such as manufacturing, energy, construction and transportation.

For new investments, private equity firms are most keen on increasing their investments in technology, healthcare and cleantech, the survey of 207 private equity fund managers said. Most polled were small and mid-sized funds but the survey included some mega-funds.

Private equity firms have been benefiting from an improving economy and rising stock market valuations and have seen the value of their portfolios increase. They have also taken advantage of a rebound in M&A and stronger IPO markets to exit some of their investments.

However, while debt markets have recovered since the credit crisis — allowing private equity firms to strike larger deals — valuations of assets have increased, making deals hard to strike. Funds, which were left with a lot of 'dry powder' — or capital available to invest, have in some cases struggled to invest that money.

"When the market crashed and everything stopped, there was a lot of dry powder in a lot of private equity funds," said Angell. "They probably figured they could make some great deals on some of these businesses."

However, what ended up happening was that unless a business was in dire need of clinching a sale, sellers "pulled off the market," Angell said.

"So where you would have thought there may have been some good deals going on, nothing happened for a while," he said.

Private equity managers were roughly split on whether firms would increasingly strike leveraged buyout deals, and about half polled thought buyout firms would increasingly club together on deals, according to the survey.

More than 70 percent of respondents said they expect higher deal prices in 2011 as compared with 2010.

Some private equity firms have struggled since the credit crisis to raise money, as investors in their funds have had less available capital to invest.

Nearly 50 percent of the private equity managers that participated in the survey plan to raise capital in 2011, Rothstein Kass said.

The survey said nearly 80 percent of private equity fund managers expect pressure to reduce fees, an increase from 65 percent in Rothstein Kass' survey a year earlier.

Related News

EIA expects solar and wind to be larger sources of U.S. electricity generation this summer

US Summer Electricity Outlook 2022 projects rising renewable energy generation as utility-scale solar and wind capacity additions surge, while coal declines and natural gas shifts amid higher fuel prices and regional supply constraints.


Key Points

An EIA forecast of summer 2022 power: more solar and wind, less coal, and shifting gas use amid higher fuel prices.

✅ Solar +10 million MWh; wind +8 million MWh vs last summer

✅ Coal generation -20 million MWh amid supply constraints, retirements

✅ Gas prices near $9/MMBtu; slight national gen decline


In our Summer Electricity Outlook, a supplement to our May 2022 Short-Term Energy Outlook, we expect the largest increases in U.S. electric power sector generation this summer will come from renewable energy sources such as wind and solar generation. These increases are the result of new capacity additions. We forecast utility-scale solar generation between June and August 2022 will grow by 10 million megawatthours (MWh) compared with the same period last summer, and wind generation will grow by 8 million MWh. Forecast generation from coal and natural gas declines by 26 million MWh this summer, although natural gas generation could increase in some electricity markets where coal supplies are constrained.

For recent context, overall U.S. power generation in January rose 9.3% year over year, the EIA reports.

Wind and solar power electric-generating capacity has been growing steadily in recent years. By the start of June, we estimate the U.S. electric power sector will have 65 gigawatts (GW) of utility-scale solar-generating capacity, a 31% increase in solar capacity since June 2021. Almost one-third of this new solar capacity will be built in the Texas electricity market. The electric power sector will also have an estimated 138 GW of wind capacity online this June, which is a 12% increase from last June.

Along with growth in renewables capacity, we expect that an additional 6 GW of new natural gas combined-cycle generating capacity will come online by June 2022, an increase of 2% from last summer. Despite this increase in capacity, we expect natural gas-fired electricity generation at the national level will be slightly (1.3%) lower than last summer.

We forecast the price of natural gas delivered to electric generators will average nearly $9 per million British thermal units between June and August 2022, which would be more than double the average price last summer. The higher expected natural gas prices and growth in renewable generation will likely lead to less natural gas-fired generation in some regions of the country.

In contrast to renewables and natural gas, the electricity industry has been steadily retiring coal-fired power plants over the past decade. Between June 2021 and June 2022, the electric power sector will have retired 6 GW (2%) of U.S. coal-fired generating capacity.

In previous years, higher natural gas prices would have resulted in more coal-fired electricity generation across the fleet. However, coal-fired power plants have been limited in their ability to replenish their historically low inventories in recent months as a result of mine closures, rail capacity constraints, and labor market tightness. These coal supply constraints, along with continued retirement of generating capacity, contribute to our forecast that U.S. coal-fired generation will decline by 20 million MWh (7%) this summer. In some regions of the country, these coal supply constraints may lead to increased natural gas-fired electricity generation despite higher natural gas prices.


Related News

View more

US January power generation jumps 9.3% on year: EIA

US January power generation climbed to 373.2 TWh, EIA data shows, with coal edging natural gas, record wind output, record nuclear generation, rising hydro, and stable utility-scale solar amid higher Henry Hub prices.


Key Points

US January power generation hit 373.2 TWh; coal led gas, wind and nuclear set records, with solar edging higher.

✅ Coal 31.8% share; gas 29.4%; coal output 118.7 TWh, gas 109.6 TWh.

✅ Wind hit record 26.8 TWh; nuclear record 74.6 TWh.

✅ Total generation 373.2 TWh, highest January since 2014.


The US generated 373.2 TWh of power in January, up 7.9% from 345.9 TWh in December and 9.3% higher than the same month in 2017, Energy Information Administration data shows.

The monthly total was the highest amount in January since 377.3 TWh was generated in January 2014.

Coal generation totaled 118.7 TWh in January, up 11.4% from 106.58 TWh in December and up 2.8% from the year-ago month, consistent with projections of a coal-fired generation increase for the first time since 2014. It was also the highest amount generated in January since 132.4 TWh in 2015.

For the second straight month, more power was generated from coal than natural gas, as 109.6 TWh came from gas, up 3.3% from 106.14 TWh in December and up 19.9% on the year.

However, the 118.7 TWh generated from coal was down 9.6% from the five-year average for the month, due to the higher usage of gas and renewables and a rising share of non-fossil generation in the overall mix.

#google#

Coal made up 31.8% of the total US power generation in January, up from 30.8% in December but down from 33.8% in January 2017.

Gas` generation share was at 29.4% in the latest month, with momentum from record gas-fired electricity earlier in the period, down from 30.7% in December but up from 26.8% in the year-ago month.

In January, the NYMEX Henry Hub gas futures price averaged $3.16/MMBtu, up 13.9% from $2.78/MMBtu averaged in December but down 4% from $3.29/MMBtu averaged in the year-ago month.


WIND, NUCLEAR GENERATION AT RECORD HIGHS

Wind generation was at a record-high 26.8 TWh in January, up 29.3% from 22.8 TWh in December and the highest amount on record, according to EIA data going back to January 2001. Wind generated 7.2% of the nation`s power in January, as an EIA summer outlook anticipates larger wind and solar contributions, up from 6.6% in December and 6.1% in the year-ago month.

Utility-scale solar generated 3.3 TWh in January, up 1.3% from 3.1 TWh in December and up 51.6% on the year. In January, utility-scale solar generation made up 0.9% of US power generation, during a period when solar and wind supplied 10% of US electricity in early 2018, flat from December but up from 0.6% in January 2017.

Nuclear generation was also at a record-high 74.6 TWh in January, up 1.3% month on month and the highest monthly total since the EIA started tracking it in January 2001, eclipsing the previous record of 74.3 TWh set in July 2008. Nuclear generation made up 20% of the US power in January, down from 21.3% in December and 21.4% in the year-ago month.

Hydro power totaled 25.4 TWh in January, making up 6.8% of US power generation during the month, up from 6.5% in December but down from 8.2% in January 2017.


Related News

View more

Energy-insecure households in the U.S. pay 27% more for electricity than others

Community Solar for Low-Income Homes expands energy equity by delivering renewable energy access, predictable bill savings, and tax credit benefits to renters and energy-insecure households, accelerating distributed generation and storage adoption nationwide.


Key Points

A program model enabling renters and LMI households to subscribe to off-site solar and save on utility bills.

✅ Earn bill credits from shared solar generation.

✅ Expands access for renters and LMI subscribers.

✅ Often paired with storage and IRA tax credit adders.


On a square-foot basis, the issue of inequality is made worse by higher costs for energy usage in the nation. Efforts like community solar programs such as Maryland community solar are underway to boost low-income participation in the cost benefits of renewable energy.

The Energy Information Administration (EIA) shows that households that are considered energy insecure, or those that have the inability to adequately meet basic household energy costs, are paying more for electricity than their wealthier counterparts. 

On average in the United States in 2020, households were billed about $1.04 per square foot for all energy sources. For homes that did not report energy insecurity, that average was $0.98 per square foot, while homes with energy insecurity issues paid an average of $1.24 per square foot for energy. This means that U.S. residents that need the most support on their energy bills are stuck with costs 27% higher than their neighbors on square-foot-basis.

EIA said energy-insecure households have reduced or forgone basic necessities to pay energy bills, kept their houses at unsafe temperatures because of energy cost concerns, or been unable to repair heating or cooling equipment because of cost.

In 2020, households with income less than $10,000 a year were billed an average of $1.31 per square foot for energy, while households making $100,000 or more were billed an average of $0.96 per square foot, said EIA. Renters paid considerably more ($1.28 per square foot) than owners ($0.98 per square foot). There were also considerable differences between regions, with New England solar growth sparking grid upgrade debates, ethnic groups and races, and insulation levels, as seen below.

The energy transition toward renewables like solar has offered price stability, amid record solar and storage growth nationwide, but thus far energy-insecure communities have relatively been left behind. A recent Berkeley Lab report, Residential Solar-Adopter Income and Demographic Trends, indicates that even though the rate of solar adoption among low-income residents is increasing (from 5% in 2010 to 11% in 2021), that segment of energy consumers remains under-represented among solar adopters, relative to its share of the population.


Community solar efforts

As such, the United States is targeting communities most impacted by energy costs that have not benefitted from the transition, highlighting “Energy Communities” that are eligible for an additional 10% tax credit through funds made possible by the Inflation Reduction Act.

Additionally, a push for community solar development is taking place nationwide to extend access to affordable solar energy to renters and other residents that aren’t able to leverage finances to invest in predictable, low-cost residential solar systems. The Biden Administration set a goal this year to sign up 5 million community solar households, achieving $1 billion in bill savings by 2025. The community solar model only represents about 8% of the total distributed solar capacity in the nation. This target would entail a jump from 3 GW installed capacity to 20 GW by the target year. The Department of Energy estimates community solar subscribers save an average of 20% on their bills.

California this year passed AB 2316, the Community Renewable Energy Act takes aim at four acute problems in the state’s power market: reliability amid rising outage risks, rates, climate and equity. The law creates a community renewable energy program, including community solar-plus-storage, supported by cheaper batteries, to overcome access barriers for nearly half of Californians who rent or have low incomes. Community solar typically involves customers subscribing to an off-site solar facility, receiving a utility bill credit for the power it generates.

“Community renewable energy is a proven powerful tool to help close California’s clean energy gap, bringing much needed relief to millions struggling with high housing costs and utility debt,” said Alexis Sutterman, energy equity program manager at the California Environmental Justice Alliance.

The program has energy equity baked into its structure, working to make sure Californians of all income levels participate in the benefits of the energy transition. Not only does it open solar access to renters, the law ensures that at least 51% of subscribers are low-income customers, which is expected to make projects eligible for a 10% tax credit adder under the IRA.

“The money’s on the table now,” said Jeff Cramer, president and chief executive of the Coalition for Community Solar Access. “While there are groups pushing for solar access for all, and states with strong legislation, there are other pockets of interest in surprising places in the United States. For example, Louisiana has no policy for community solar or support for low-income residents going solar but the city of New Orleans has its own utility commission with a community solar program. In Nebraska, forward-looking co-operatives have created community solar projects.

Community solar markets are active in 22 states, with more expected to come online in the future as states pursue 100% clean energy targets across the country. However, the market is expected to require strong community outreach efforts to foster trust and gain subscribers.

“There is a distrust of community solar initially in LMI communities as many have been burned before by retail energy false promises,” said Eric LaMora, executive director, community solar, Nautilus Solar on a panel at the Solar Energy Industries Association Finance, Tax, and Buyers seminar. “People are suspicious but there really are no hooks with community solar.”

LMI residents are leery to provide tax records or much documents at all in order to sign up for community solar, LaMora said. “We were surprised to see less of a default rate with LMI residents. We attribute this to the fact that they see significant savings on their electric bill, making it easier to pay each month,” he said.


Related News

View more

Almost 500-mile-long lightning bolt crossed three US states

Longest Lightning Flash Record confirmed by WMO: a 477.2-mile megaflash spanning Mississippi, Louisiana, and Texas, detected by satellite sensors, highlighting Great Plains supercell storms, lightning safety, and extreme weather monitoring advancements.


Key Points

It is the WMO-verified 477.2-mile megaflash across MS, LA, and TX, detected via satellites.

✅ Spanned 477.2 miles across Mississippi, Louisiana, and Texas

✅ Verified by WMO using space-based lightning detection

✅ Occurs in megaflash-prone regions like the U.S. Great Plains


An almost 500-mile long bolt of lightning that lit up the sky across three US states has set a new world record for longest flash, scientists have confirmed.

The lightning bolt, extended a total of 477.2 miles (768 km) and spread across Mississippi, Louisiana, and Texas.

The previous record was 440.6 miles (709 km) and recorded in Brazil in 2018.

Lightning rarely extends over 10 miles and usually lasts under a second, yet utilities plan for severe weather when building long-distance lines such as the TransWest Express transmission project to enhance reliability.

Another lightning flash recorded in 2020 - in Uruguay and Argentina - has also set a new record for duration at 17.1 seconds. The previous record was 16.7 seconds.

"These are extraordinary records from lightning flash events," Professor Randall Cerveny, the WMO's rapporteur of weather and climate extremes, said.

According to the WMO, both records took place in areas prone to intense storms that produce 'megaflashes', namely the Great Plains region of the United States and the La Plata basin of South America's southern cone, where utilities adapting to climate change is an increasing priority.

Professor Cerveny added that greater extremes are likely to exist and are likely to be recorded in the future thanks to advances in space-based lightning detection technology.

The WMO warned that lightning was a hazard and urged people in both regions and around the world to take caution during storms, which can lead to extensive disruptions like the Tennessee power outages reported after severe weather.

"These extremely large and long-duration lightning events were not isolated but happened during active thunderstorms," lightning specialist Ron Holle said in a WMO statement.

"Any time there is thunder heard, it is time to reach a lightning-safe place".

Previously accepted WMO 'lightning extremes' include a 1975 incident in which 21 people were killed by a single flash of a lightning as they huddled inside a tent in Zimbabwe, and modern events show how dangerous weather can also cut electricity for days, as with the Hong Kong typhoon outages that affected families.

In another incident, 469 people were killed when lightning struck the Egyptian town of Dronka in 1994, causing burning oil to flood the town, and major incidents can also disrupt infrastructure, as seen during the LA power outage following a substation fire.

The WMO notes that the only lightning-safe locations are "substantial" buildings with wiring and plumbing, and dedicated lightning protection training helps reinforce these guidelines, rather than structures such as bus stops or those found at beaches.

Fully enclosed metal-topped vehicles are also considered reliably safe, and regional storm safety tips offer additional guidance.


Related News

View more

Why Fort Frances wants to build an integrated microgrid to deliver its electricity

Fort Frances Microgrid aims to boost reliability in Ontario with grid-connected and island modes, Siemens feasibility study, renewable energy integration, EV charging expansion, and resilience modeled after First Nations projects and regional biomass initiatives.


Key Points

A community microgrid in Fort Frances enabling grid and island modes to improve reliability and integrate renewables.

✅ Siemens-led feasibility via FedNor funding

✅ Grid-connected or islanded for outage resilience

✅ Integrates renewables, EV charging, and industry growth


When the power goes out in Fort Frances, Ont., the community may be left in the dark for hours.

The hydro system's unreliability — caused by its location on the provincial power grid — has prompted the town to seek a creative solution: its own self-contained electricity grid with its own source of power, known as a microgrid. 

Located more than 340 kilometres west of Thunder Bay, Ont., on the border of Minnesota, near the Great Northern Transmission Line corridor, Fort Frances gets its power from a single supply point on Ontario's grid. 

"Sometimes, it's inevitable that we have to have like a six- to eight-hour power outage while equipment is being worked on, and that is no longer acceptable to many of our customers," said Joerg Ruppenstein, president and chief executive officer of Fort Frances Power Corporation.

While Ontario's electrical grid serves the entire province, and national efforts explore macrogrids, a microgrid is contained within a community. Fort Frances hopes to develop an integrated, community-based electric microgrid system that can operate in two modes:

  • Grid-connected mode, which means it's connected to the provincial grid and informed by western grid planning approaches
  • Island mode, which means it's disconnected from the provincial grid and operates independently

The ability to switch between modes allows flexibility. If a storm knocks down a line, the community will still have power.

The town has been given grant funding from the Federal Economic Development Agency for Northern Ontario (FedNor), echoing smart grid funding in Sault Ste. Marie initiatives, for the project. On Monday night, council voted to grant a request for proposal to Siemens Canada Limited to conduct a feasibility study into a microgrid system.

The study, anticipated to be completed by the end of 2023 or early 2024, will assess what an integrated community-based microgrid system could look like in the town of just over 7,000 people, said Faisal Anwar, chief administrative officer of Fort Frances. A timeline for construction will be determined after that. 

The community is still reeling from the closure of the Resolute Forest Products pulp and paper mill in 2014 and faces a declining population, said Ruppenstein. It's hoped the microgrid system will help attract new industry to replace those lost workers and jobs, drawing on Manitoba's hydro experience as a model.

This gives the town a competitive advantage.

"If we were conceivably to attract a larger industrial player that would consume a considerable amount of energy, it would result in reduced rates for everyone…we're the only utility really in Ontario that can offer that model," Ruppenstein said.

The project can also incorporate renewable energy like solar or wind power, as seen in B.C.'s clean energy shift efforts, into the microgrid system, and support the growth of electric vehicles, he said. Many residents fill their gas tanks in Minnesota because it's cheaper, but Fort Frances has the potential to become a hub for electric vehicle charging.

A few remote First Nations have recently switched to microgrid systems fuelled by green energy, including Gull Bay First Nation and Fort Severn First Nation. These are communities that have historically relied on diesel fuel either flown in, which is incredibly expensive, or transported via ice roads, which are seeing shorter seasons each year.

Natural Resources Minister Jonathan Wilkinson was in Thunder Bay, Ont., to announce $35 million for a biomass generation facility in Whitesand First Nation, complementing federal funding for the Manitoba-Saskatchewan transmission line elsewhere in the region.


Related News

View more

Energy-hungry Europe to brighten profit at US solar equipment makers

European Solar Inverter Demand surges as photovoltaics and residential solar expand during the clean energy transition, driven by high natural gas prices; Germany leads, boosting Enphase and SolarEdge sales for rooftop systems and grid-tied installations.


Key Points

Rising European need for solar inverters, fueled by residential PV growth, high energy costs, and clean energy policies.

✅ Germany leads EU rooftop PV installations

✅ Enphase and SolarEdge see revenue growth

✅ High gas prices and policies spur adoption


Solar equipment makers are expected to post higher quarterly profit, benefiting from strong demand in Europe for critical components that convert energy from the sun into electricity, amid record renewable momentum worldwide.

The continent is emerging as a major market for solar firms as it looks to reduce its dependence on the Russian energy supply and accelerate its clean energy transition, with solar already reshaping power prices in Northern Europe across the region, brightening up businesses of companies such as Enphase Energy (ENPH.O) and SolarEdge Technologies (SEDG.O), which make solar inverters.

Wall Street expects Enphase and SolarEdge to post a combined adjusted net income of $323.8 million for the April-June quarter, a 56.7% jump from a year earlier, even as demand growth slows in the United States.

The energy crisis in Europe is not as acute as last year when Western sanctions on Russia severely crimped supplies, but prices of natural gas and electricity continue to be much higher than in the United States, Raymond James analyst Pavel Molchanov said.

As a result, demand for residential solar keeps growing at a strong pace in the region, with Germany being one of the top markets and solar adoption in Poland also accelerating in recent years across the region.

About 159,000 residential solar systems became operational in the first quarter in Germany amid a solar power boost that reflects policy and demand, a 146% rise from a year earlier, according to BSW solar power association.

Adoption of solar is also helping European homeowners have greater control over their energy costs as fossil fuel prices tend to be more volatile, Morningstar analyst Brett Castelli said.

SolarEdge, which has a bigger exposure to Europe than Enphase, said its first-quarter revenue from the continent more than doubled compared with last year.

In comparison, growth in the United States has been tepid due to lukewarm demand in states like Texas and Arizona where cheaper electricity prices make the economics of residential solar less attractive, even though solar is now cheaper than gas in parts of the U.S. market.

Higher interest rates following the U.S. Federal Reserve's recent actions to tame inflation are also weighing on demand, even as power outage risks rise across the United States.

Analysts also expect weakness in California where a new metering reform reduces the money credited to rooftop solar owners for sending excess power into the grid, underscoring how policy shifts can reshape the sector. The sunshine state accounts for nearly a third of the U.S. residential solar market.

Enphase will report its results on Thursday after the bell, while SolarEdge will release its second-quarter numbers on Aug. 1.


Related News

View more

Sign Up for Electricity Forum’s Newsletter

Stay informed with our FREE Newsletter — get the latest news, breakthrough technologies, and expert insights, delivered straight to your inbox.

Electricity Today T&D Magazine Subscribe for FREE

Stay informed with the latest T&D policies and technologies.
  • Timely insights from industry experts
  • Practical solutions T&D engineers
  • Free access to every issue

Download the 2025 Electrical Training Catalog

Explore 50+ live, expert-led electrical training courses –

  • Interactive
  • Flexible
  • CEU-cerified