Con Edison ordered to pay for poor services

By Newsday


NFPA 70e Training - Arc Flash

Our customized live online or in‑person group training can be delivered to your staff at your location.

  • Live Online
  • 6 hours Instructor-led
  • Group Training Available
Regular Price:
$199
Coupon Price:
$149
Reserve Your Seat Today
Con Edison has been ordered to set aside $18 million in shareholder money to benefit customers after the state Public Service Commission found the company failed to meet service standards in 2006.

Separately, Niagara Mohawk, which is owned by National Grid, was ordered to set aside $8.8 million in shareholder money as a penalty for having too many service interruptions.

But customers shouldn't start looking for rebate checks in the mail. It's unclear how the companies will be required to distribute the funds.

Spokesman James Denn said the commission will decide how the money is distributed. He said it could be used to offset future rate increases.

Steve Brady, a spokesman for National Grid, said the company gave customers one-time rebates when faced with a similar penalty last year and could do so again.

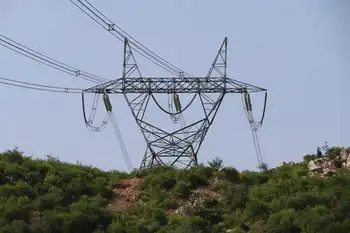
The commission found that Con Ed failed to meet reliability targets when it came to the frequency of interruptions, which are defined as outages of five minutes or more. It had a total of 15,862 interruptions in 2006.

The company also surpassed the duration target for outages, which was an average interruption time of 3.7 hours for customers who experience a sustained interruption in a given year. On average, affected Con Ed customers were without power for 12.31 hours in 2006.

Those outages affected 733,204 Con Ed customers.

"The PSC decision to fine Con Edison $18 million fails to even scratch the surface of what is necessary to hold Con Edison accountable for its poor performance in 2006," said Assemb. Michael Gianaris (D-Queens).

"Today's fine is a pittance compared to the damage Con Ed has caused by its unreliable service," said Democratic Assemb. Richard Brodsky, of Westchester County. "At a time when the company is reporting record profits, we are not satisfied with receiving only a small fraction of the scrutiny that we have requested."

Brodsky, who chairs the Assembly Committee on Corporations, Authorities and Commissions, said the lengthy outages in 2006 in Long Island City and Westchester demonstrated how much Con Ed has deteriorated.

"We have learned many lessons from the outage in Long Island City as well as from the Westchester County storms," Con Ed spokesman Joseph Petta said in a written statement. "Those lessons already are being applied to our policies and procedures to help prevent outages and ensure more rapid restoration when they occur."

The commission also eliminated the maximum level of reimbursement that Con Ed would owe customers who lost perishable medications during extended outages.

National Grid was ordered to double how much shareholders pay because the company failed to meet the same standard three years in a row. The company failed to limit the ratio of customers who had interruptions compared to the number of customers served.

Related News

France’s first offshore wind turbine produces electricity

Floatgen Floating Offshore Wind Turbine exports first kWh to France's grid from SEM-REV off Le Croisic, showcasing Ideol's concrete floating foundation by Bouygues and advancing marine renewable energy leadership ambitions.


Key Points

A grid-connected demo turbine off Le Croisic, proving Ideol's floating foundation at SEM-REV.

✅ First power exported to French grid from SEM-REV site

✅ Ideol concrete floating base built by Bouygues

✅ Demonstrator can supply up to 5,000 inhabitants


Floating offshore wind turbine Floatgen, the first offshore wind turbine installed off the French coast, exported its first KWh to the electricity grid, echoing the offshore wind power milestone experienced by U.S. customers recently.

The connection of the electricity export cable, similar in ambition to the UK's 2 GW substation program, and a final series of tests carried out in recent days enabled the Floatgen wind turbine, which is installed 22 km off Le Croisic (Loire-Atlantique), to become fully operational on Tuesday 18 September.

This announcement is a highly symbolic step for the partners involved in this project. This wind turbine is the first operational unit of the floating foundation concept patented by Ideol and built in concrete by Bouygues Travaux Publics. A second unit of the Ideol foundation will soon be operational off Japan. For Centrale Nantes, this is the first production tool and the first injection of electricity into its export cable at its SEM-REV test site dedicated to marine renewable energies, alongside projects such as the Scotland-England subsea power link that expand transmission capacity (third installation after tests on acoustic sensors and cable weights).

This announcement is also symbolic for France since Floatgen lays the foundation for an industrial offshore wind energy sector and represents a unique opportunity to become the global leader in floating wind, as major clean energy corridors like the Canadian hydropower line to New York illustrate growing demand.

With its connection to the grid, SEM-REV will enable the wind turbine to supply electricity to 5000 inhabitants, and similar integrated microgrid initiatives show how local reliability can be enhanced.


Related News

View more

US January power generation jumps 9.3% on year: EIA

US January power generation climbed to 373.2 TWh, EIA data shows, with coal edging natural gas, record wind output, record nuclear generation, rising hydro, and stable utility-scale solar amid higher Henry Hub prices.


Key Points

US January power generation hit 373.2 TWh; coal led gas, wind and nuclear set records, with solar edging higher.

✅ Coal 31.8% share; gas 29.4%; coal output 118.7 TWh, gas 109.6 TWh.

✅ Wind hit record 26.8 TWh; nuclear record 74.6 TWh.

✅ Total generation 373.2 TWh, highest January since 2014.


The US generated 373.2 TWh of power in January, up 7.9% from 345.9 TWh in December and 9.3% higher than the same month in 2017, Energy Information Administration data shows.

The monthly total was the highest amount in January since 377.3 TWh was generated in January 2014.

Coal generation totaled 118.7 TWh in January, up 11.4% from 106.58 TWh in December and up 2.8% from the year-ago month, consistent with projections of a coal-fired generation increase for the first time since 2014. It was also the highest amount generated in January since 132.4 TWh in 2015.

For the second straight month, more power was generated from coal than natural gas, as 109.6 TWh came from gas, up 3.3% from 106.14 TWh in December and up 19.9% on the year.

However, the 118.7 TWh generated from coal was down 9.6% from the five-year average for the month, due to the higher usage of gas and renewables and a rising share of non-fossil generation in the overall mix.

#google#

Coal made up 31.8% of the total US power generation in January, up from 30.8% in December but down from 33.8% in January 2017.

Gas` generation share was at 29.4% in the latest month, with momentum from record gas-fired electricity earlier in the period, down from 30.7% in December but up from 26.8% in the year-ago month.

In January, the NYMEX Henry Hub gas futures price averaged $3.16/MMBtu, up 13.9% from $2.78/MMBtu averaged in December but down 4% from $3.29/MMBtu averaged in the year-ago month.


WIND, NUCLEAR GENERATION AT RECORD HIGHS

Wind generation was at a record-high 26.8 TWh in January, up 29.3% from 22.8 TWh in December and the highest amount on record, according to EIA data going back to January 2001. Wind generated 7.2% of the nation`s power in January, as an EIA summer outlook anticipates larger wind and solar contributions, up from 6.6% in December and 6.1% in the year-ago month.

Utility-scale solar generated 3.3 TWh in January, up 1.3% from 3.1 TWh in December and up 51.6% on the year. In January, utility-scale solar generation made up 0.9% of US power generation, during a period when solar and wind supplied 10% of US electricity in early 2018, flat from December but up from 0.6% in January 2017.

Nuclear generation was also at a record-high 74.6 TWh in January, up 1.3% month on month and the highest monthly total since the EIA started tracking it in January 2001, eclipsing the previous record of 74.3 TWh set in July 2008. Nuclear generation made up 20% of the US power in January, down from 21.3% in December and 21.4% in the year-ago month.

Hydro power totaled 25.4 TWh in January, making up 6.8% of US power generation during the month, up from 6.5% in December but down from 8.2% in January 2017.


Related News

View more

European responses to Covid-19 accelerate electricity system transition by a decade - Wartsila

EU-UK Coal Power Decline 2020 underscores Covid-19's impact on power generation, with renewables rising, carbon emissions falling, and electricity demand down, revealing resilient grids and accelerating the energy transition across European markets.


Key Points

Covid-19's impact on EU-UK power: coal down, renewables up, lower emissions intensity and reduced electricity demand.

✅ Coal generation down 25.5% EU-UK; 29% in March 10-April 10 period

✅ Renewables share up to 46%; grids remained stable and flexible

✅ Electricity demand fell 10%; emissions intensity dropped 19.5%


Coal based power generation has fallen by over a quarter (25.5%) across the European Union (EU) and United Kingdom (UK) in the first three months of 2020, compared to 2019, as a result of the response to Covid-19, with renewable energy reaching a 43% share, as wind and solar outpaced gas across the EU, according to new analysis by the technology group Wärtsilä.

The impact is even more stark in the last month, with coal generation collapsing by almost one third (29%) between March 10 and April 10 compared to the same period in 2019, making up only 12% of total EU and UK generation. By contrast, renewables delivered almost half (46%) of generation – an increase of 8% compared to 2019.

In total, demand for electricity across the continent is down by one tenth (10%), mirroring global demand declines of around 15%, due to measures taken to combat Covid-19, the biggest drop in demand since the Second World War. The result is an unprecedented fall in carbon emissions from the power sector, with emission intensity falling by 19.5% compared to the same March 10-April 10 period last year. The analysis comes from the Wärtsilä Energy Transition Lab, a new free-to-use data platform developed by Wärtsilä to help the industry, policy makers and the public understand the impact of Covid-19 on European electricity markets and analyse what this means for the future design and operation of its energy systems. The goal is to help accelerate the transition to 100% renewables.

Björn Ullbro, Vice President for Europe & Africa at Wärtsilä Energy Business, said: “The impact of the Covid-19 crisis on European energy systems is extraordinary. We are seeing levels of renewable electricity that some people believed would cause systems to collapse, yet they haven’t – in fact they are coping well. The question is, what does this mean for the future?”

“What we can see today is how our energy systems cope with much more renewable power – knowledge that will be invaluable, aligning with IAEA low-carbon insights, to accelerate the energy transition. We are making this new platform freely available to support the energy industry to adapt and use the momentum this tragic crisis has created to deliver a better, cleaner energy system, faster.”

The figures mark a dramatic shift in Europe’s energy mix – one that was not anticipated to occur until the end of the decade. The impact of the Covid-19 crisis has effectively accelerated the energy transition in the short-term, even as later lockdowns saw power demand hold firm in parts of Europe, providing a unique opportunity to see how energy systems function with far higher levels of renewables.

Ullbro added: “Electricity demand across Europe has fallen due to the lockdown measures applied by governments to stop the spread of the coronavirus. However, total renewable generation has remained at pre-crisis levels with low electricity prices, combined with renewables-friendly policy measures, crowding out gas and fossil fuel power generation, especially coal. This sets the scene for the next decade of the energy transition.”

These Europe-wide impacts are mirrored at a national level, for example:

  • In the UK, renewables now have a 43% share of generation, following a stall in low-carbon progress in 2019 (up 10% on the same March 10-April 10 period in 2019) with coal power down 35% and gas down 24%.
  • Germany has seen the share of renewables reach 60% (up 12%) and coal generation fall 44%, resulting in a fall in the carbon intensity of its electricity of over 30%.
  • Spain currently has 49% renewables with coal power down by 41%.
  • Italy has seen the steepest fall in demand, down 21% so far.

An industry first, the Wärtsilä Energy Transition Lab has been specifically developed as an open-data platform for the energy industry to understand the impact of Covid-19 and help accelerate the energy transition. The tool provides detailed data on electricity generation, demand and pricing for all 27 EU countries and the UK, combining Entso-E data in a single, easy to use platform. It will also allow users to model how systems could operate in future with higher renewables, as global power demand surpasses pre-pandemic levels, helping pinpoint problem areas and highlight where to focus policy and investment.


Related News

View more

Global use of coal-fired electricity set for biggest fall this year

Global Coal Power Decline 2019 signals a record fall in coal-fired electricity as China plateaus, India dips, and the EU and US accelerate renewables, curbing carbon emissions and advancing the global energy transition.


Key Points

A record 2019 drop in global coal power as renewables rise and demand slows across China, India, the EU, and the US.

✅ 3% global fall in coal-fired electricity in 2019.

✅ China plateaus; India declines for first time in decades.

✅ EU and US shift to renewables and gas, cutting emissions.


The world’s use of coal-fired electricity is on track for its biggest annual fall on record this year after more than four decades of near-uninterrupted growth that has stoked the global climate crisis.

Data shows that coal-fired electricity is expected to fall by 3% in 2019, or more than the combined coal generation in Germany, Spain and the UK last year and could help stall the world’s rising carbon emissions this year.

The steepest global slump on record is likely to emerge in 2019 as India’s reliance on coal power falls for the first time in at least three decades this year, and China’s coal power demand plateaus, reflecting the broader global energy transition underway.

Both developing nations are using less coal-fired electricity due to slowing economic growth in Asia as well as the rise of cleaner energy alternatives. There is also expected to be unprecedented coal declines across the EU and the US as developed economies turn to clean forms of energy such as low-cost solar power to replace ageing coal plants.

In almost 40 years the world’s annual coal generation has fallen only twice before: in 2009, in the wake of the global financial crisis, and in 2015, following a slowdown in China’s coal plants amid rising levels of deadly air pollution.

The research was undertaken by the Centre for Research on Energy and Clean Air , the Institute for Energy Economics and Financial Analysis and the UK climate thinktank Sandbag.

The researchers found that China’s coal-fired power generation was flatlining, despite an increase in the number of coal plants being built, because they were running at record low rates. China builds the equivalent of one large new coal plant every two weeks, according to the report, but its coal plants run for only 48.6% of the time, compared with a global utilisation rate of 54% on average.

The findings come after a report from Global Energy Monitor found that the number of coal-fired power plants in the world is growing, because China is building new coal plants five times faster than the rest of the world is reducing their coal-fired power capacity.

The report found that in other countries coal-fired power capacity fell by 8GW in the 18 months to June but over the same period China increased its capacity by 42.9GW.

In a paper for the industry journal Carbon Brief, the researchers said: “A 3% reduction in power sector coal use could imply zero growth in global CO2 emissions, if emissions changes in other sectors mirror those during 2018.”

However, the authors of the report have warned that despite the record coal power slump the world’s use of coal remained far too high to meet the climate goals of the Paris agreement, and some countries are still seeing increases, such as Australia’s emissions rise amid increased pollution from electricity and transport.

The US – which is backing out of the Paris agreement – has made the deepest cuts to coal power of any developed country this year by shutting coal plants down in favour of gas power and renewable energy, with utilities such as Duke Energy facing investor pressure to disclose climate plans. By the end of August the US had reduced coal by almost 14% over the year compared with the same months in 2018.

The EU reported a record slump in coal-fired electricity use in the first half of the year of almost a fifth compared with the same months last year. This trend is expected to accelerate over the second half of the year to average a 23% fall over 2019 as a whole. The EU is using less coal power in favour of gas-fired electricity – which can have roughly half the carbon footprint of coal – and renewable energy, helped by policies such as the UK carbon tax that have slashed coal-fired generation.

We will not stay quiet on the escalating climate crisis and we recognise it as the defining issue of our lifetimes. The Guardian will give global heating, wildlife extinction and pollution the urgent attention they demand. Our independence means we can interrogate inaction by those in power. It means Guardian reporting will always be driven by scientific facts, never by commercial or political interests.

We believe that the problems we face on the climate crisis are systemic and that fundamental societal change is needed. We will keep reporting on the efforts of individuals and communities around the world who are fearlessly taking a stand for future generations and the preservation of human life on earth. We want their stories to inspire hope. We will also report back on our own progress as an organisation, as we take important steps to address our impact on the environment.


Related News

View more

Most Energy Will Come From Fossil Fuels, Even In 2040

2040 Energy Outlook projects a shifting energy mix as renewables scale, EV adoption accelerates, and IEA forecasts plateauing oil demand alongside rising natural gas, highlighting policy, efficiency, and decarbonization trends that shape global consumption.


Key Points

A data-driven view of future energy mix, covering renewables, fossil fuels, EVs, oil demand, and policy impacts.

✅ Renewables reach 16-30% by 2040, higher with strong policy support.

✅ Fossil fuels remain dominant, with oil flat and natural gas rising.

✅ EV share surges, cutting oil use; efficiency curbs demand growth.


Which is more plausible: flying taxis, wind turbine arrays stretching miles into the ocean, and a solar roof on every house--or a scorched-earth, flooded post-Apocalyptic world? 

We have no way of peeking into the future, but we can certainly imagine it. There is plenty of information about where the world is headed and regardless of how reliable this information is—or isn’t—we never stop wondering. Will the energy world of 20 years from now be better or worse than the world we live in now? 

The answer may very well lie in the observable trends.


A Growing Population

The global population is growing, and it will continue to grow in the next two decades. This will drive a steady growth in energy demand, at about 1 percent per year, according to the International Energy Agency.

This modest rate of growth is good news for all who are concerned about the future of the planet. Parts of the world are trying to reduce their energy consumption, and this should have a positive effect on the carbon footprint of humanity. The energy thirst of most parts of the world will continue growing, however, hence the overall growth.

The world’s population is currently growing at a rate of a little over 1 percent annually. This rate of growth has been slowing since its peak in the 1960s and forecasts suggest that it will continue to slow. Growth in energy demand, on the other hand, may at some point stop moving in tune with population growth trends as affluence in some parts of the world grows. The richer people get, the more energy they need. So, to the big question: where will this energy come from?


The Rise of Renewables

For all the headline space they have been claiming, it may come as a disappointing surprise to many that renewable energy, excluding hydropower, to date accounts for just 14 percent of the global primary energy mix. 

Certainly, adoption of solar and wind energy has been growing in leaps and bounds, with their global share doubling in five years in many markets, but unless governments around the world commit a lot more money and effort to renewable energy, by 2040, solar and wind’s share in the energy mix will still only rise to about 16 to 17 percent. That’s according to the only comprehensive report on the future of energy that collates data from all the leading energy authorities in the world, by non-profit Resources for the Future.

The growth in renewables adoption, however, would be a lot more impressive if governments do make serious commitments. Under that scenario, the share of renewables will double to over 30 percent by 2040, echoing milestones like over 30% of global electricity reached recently: that’s the median rate of all authoritative forecasts. Amongst them, the adoption rates of renewables vary between 15 percent and 61 percent by 2040.

Even the most bullish of the forecasts on renewables is still far below the 100-percent renewable future many would like to fantasize about, although BNEF’s 50% by 2050 outlook points to what could be possible in the power sector. 

But in 2040, most of the world’s energy will still come from fossil fuels.


EV Energy

Here, forecasters are more optimistic. Again, there is a wide variation between forecasts, but in each and every one of them the share of electric vehicles on the world’s roads in 2040 is a lot higher than the meagre 1 percent of the global car fleet EVs constitute today.
Related: Gas Prices Languish As Storage Falls To Near-Record Lows

Government policy will be the key, as U.S. progress toward 30% wind and solar shows how policy steers the power mix that EVs ultimately depend on. Bans of internal combustion engines will go a long way toward boosting EV adoption, which is why some forecasters expect electric cars to come to account for more than 50 percent of cars on the road in 2040. Others, however, are more guarded in their forecasts, seeing their share of the global fleet at between 16 percent and a little over 40 percent.

Many pin their hopes for a less emission-intensive future on electric cars. Indeed, as the number of EVs rises, they displace ICE vehicles and, respectively, the emission-causing oil that fuels for ICE cars are made from.  It should be a no brainer that the more EVs we drive, the less emissions we produce. Unfortunately, this is not necessarily the case: China is the world’s biggest EV market, and its solar PV expansion has been rapid, it has the most EVs—including passenger cars and buses—but it is also one of the biggest emitters.

Still, by 2040, if the more optimistic forecasts come true, the world will be consuming less oil than it is consuming now: anywhere from 1.2 million bpd to 20 million bpd less, the latter case envisaging an all-electric global fleet in 2040. 


This Ain’t Your Daddy’s Oil

No, it ain’t. It’s your grandchildren’s oil, for good or for bad. The vision of an oil-free world where renewable power is both abundant and cheap enough to replace all the ways in which crude oil and natural gas are used will in 2040 still be just that--a vision, with practical U.S. grid constraints underscoring the challenges. Even the most optimistic energy scenarios for two decades from now see them as the dominant source of energy, with forecasts ranging between 60 percent and 79 percent. While these extremes are both below the over-80 percent share fossil fuels have in the world’s energy mix, they are well above 50 percent, and in the U.S. renewables are projected to reach about one-fourth of electricity soon, even as fossil fuels remain foundational.

Still, there is good news. Fuel efficiency alone will reduce oil demand significantly by 2040. In fact, according to the IEA, demand will plateau at a little over 100 million bpd by the mid-2030s. Combined with the influx of EVs many expect, the world of 20 years from now may indeed be consuming a lot less oil than the world of today. It will, however, likely consume a lot more natural gas. There is simply no way around fossil fuels, not yet. Unless a miracle of politics happens (complete with a ripple effect that will cost millions of people their jobs) in 2040 we will be as dependent on oil and gas as we are but we will hopefully breathe cleaner air.

By Irina Slav for Oilprice.com


Related News

View more

Alberta Electricity market needs competition

Alberta Electricity Market faces energy-only vs capacity debate as transmission, distribution, and administration fees surge; rural rates rise amid a regulated duopoly of investor-owned utilities, prompting calls for competition, innovation, and lower bills.


Key Points

Alberta's electricity market is an energy-only system with rising delivery charges and limited rural competition.

✅ Energy-only design; capacity market scrapped

✅ Delivery charges outpace energy on monthly bills

✅ Rural duopoly limits competition and raises rates


Last week, Alberta’s new Energy Minister Sonya Savage announced the government, through its new electricity rules, would be scrapping plans to shift Alberta’s electricity to a capacity market and would instead be “restoring certainty in the electricity system.”


The proposed transition from energy only to a capacity market is a contentious subject as a market reshuffle unfolds across the province that many Albertans probably don’t know much about. Our electricity market is not a particularly glamorous subject. It’s complicated and confusing and what matters most to ordinary Albertans is how it affects their monthly bills.


What they may not realize is that the cost of their actual electricity used is often just a small fraction of their bill amid rising electricity prices across the province. The majority on an average electricity bill is actually the cost of delivering that electricity from the generator to your house. Charges for transmission, distribution and franchise and administration fees are quickly pushing many Alberta households to the limit with soaring bills.


According to data from Alberta’s Utilities Consumer Advocate (UCA), and alongside policy changes, in 2004 the average monthly transmission costs for residential regulated-rate customers was below $2. In 2018 that cost was averaging nearly $27 a month. The increase is equally dramatic in distribution rates which have more than doubled across the province and range wildly, averaging from as low as $10 a month in 2004 to over $80 a month for some residential regulated-rate customers in 2018.


Where you live determines who delivers your electricity. In Alberta’s biggest cities and a handful of others the distribution systems are municipally owned and operated. Outside those select municipalities most of Alberta’s electricity is delivered by two private companies which operate as a regulated duopoly. In fact, two investor-owned utilities deliver power to over 95 per cent of rural Alberta and they continue to increase their share by purchasing the few rural electricity co-ops that remained their only competition in the market. The cost of buying out their competition is then passed on to the customers, driving rates even higher.


As the CEO of Alberta’s largest remaining electricity co-op, I know very well that as the price of materials, equipment and skilled labour increase, the cost of operating follows. If it costs more to build and maintain an electricity distribution system there will inevitably be a cost increase passed on to the consumer. The question Albertans should be asking is how much is too much and where is all that money going with these private- investor-owned utilities, as the sector faces profound change under provincial leadership?


The reforms to Alberta’s electricity system brought in by Premier Klein in the late 1900s and early 2000s contributed to a surge in investment in the sector and led to an explosion of competition in both electricity generation and retail. 


More players entered the field which put downward pressure on electricity rates, encouraged innovation and gave consumers a competitive choice, even as a Calgary electricity retailer urged the government to scrap the overhaul. But the legislation and regulations that govern rural electricity distribution in Alberta continue to facilitate and even encourage the concentration of ownership among two players which is certainly not in the interests of rural Albertans.


It is also not in the spirit of the United Conservative Party platform commitment to a “market-based” system. A market-based system suggests more competition. Instead, what we have is something approaching a monopoly for many Albertans. The UCP promised a review of the transition to a capacity market that would determine which market would be best for Alberta, and through proposed electricity market changes has decided that we will remain an energy-only market.
Consumers in rural Alberta need electricity to produce the goods that power our biggest industries. Instead of regulating and approving continued rate increases from private multinational corporations, we need to drive competition and innovation that can push rates down and encourage growth and investment in rural-based industries and communities.


Related News

View more

Sign Up for Electricity Forum’s Newsletter

Stay informed with our FREE Newsletter — get the latest news, breakthrough technologies, and expert insights, delivered straight to your inbox.

Electricity Today T&D Magazine Subscribe for FREE

Stay informed with the latest T&D policies and technologies.
  • Timely insights from industry experts
  • Practical solutions T&D engineers
  • Free access to every issue

Live Online & In-person Group Training

Advantages To Instructor-Led Training – Instructor-Led Course, Customized Training, Multiple Locations, Economical, CEU Credits, Course Discounts.

Request For Quotation

Whether you would prefer Live Online or In-Person instruction, our electrical training courses can be tailored to meet your company's specific requirements and delivered to your employees in one location or at various locations.