Minnesota wind farm, transmission line dedicated

By Electricity Forum


CSA Z462 Arc Flash Training - Electrical Safety Essentials

Our customized live online or in‑person group training can be delivered to your staff at your location.

  • Live Online
  • 6 hours Instructor-led
  • Group Training Available
Regular Price:
$249
Coupon Price:
$199
Reserve Your Seat Today
MinnesotaÂ’s largest wind farm and the stateÂ’s largest transmission line built to carry wind power into the Twin Cities were dedicated and will soon become fully operational, subject to final approvals by the regional transmission operator.

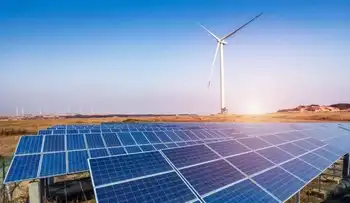
A total of 137 wind turbines, with a maximum generating capacity of 205 megawatts of electricity, comprise enXcoÂ’s Fenton Wind Project in southwestern Minnesota, making it the largest single wind farm in the state.

“Today’s event marks the 20th year in wind energy development for our company,” said James Walker, vice president of asset management for enXco, “and to dedicate the state’s largest wind park makes this milestone even more special.”

Xcel EnergyÂ’s 345-kV transmission line, along with two major 115-kV lines will deliver the power into the Minnesota High voltage transmission grid allowing delivery of the power from the Fenton Wind farm and other wind power resources from the Buffalo Ridge region of the state into the Twin Cities area.

“This region of Minnesota is very rich in wind power resources and we’ve been working hard to tap into it with this transmission line,” said Doug Jaeger, vice president of transmission for Xcel Energy. “Once the wind farms are fully developed in this region, we will be able to deliver up to an 825 MW crop of wind power from the fields of southwestern Minnesota to the Twin Cities market.”

Under a 20-year agreement, enXco will own and operate the Fenton Wind Park and sell all the energy it produces to Xcel Energy. The agreement is similar to arrangements the independent power provider has with the utility in its other service territories.

“We’re proud to have built this magnificent wind farm not only because it will provide alternative energy to the citizens of Minnesota for years to come but also because it stands as a symbol of this country’s efforts to chart a new energy course,” noted Tom Wacker, senior vice president of Mortenson Construction, which built the project for enXco. Wacker announced that Mortenson’s Energy Group celebrates its 50th completed wind farm project with Fenton.

Approximately 515 MW of wind power capacity has been installed in the Buffalo Ridge area of southwestern Minnesota. About 350 MW of additional wind power capacity is planned to be on-line by 2008. Existing transmission from the region was not able to carry the anticipated wind power load until the new transmission lines were completed. An additional leg of the 345-kV transmission line soon will be completed into Sioux Falls to support the transmission grid in that region.

The transmission grid, in which the Fenton wind farm and southwestern line will operate, is managed by the Midwest Independent Transmission System Operator (MISO), one of the nationÂ’s regional transmission management organizations. MISO is responsible for dispatching and balancing generating and transmission resources to serve customer demand throughout the Midwest and Upper Midwest region of the nation. MISO is expected to commission the Fenton wind farm and transmission lines into operation in the next few weeks.

During the 2007 legislative session, Minnesota lawmakers passed and Gov. Tim Pawlenty signed into law legislation that requires the stateÂ’s utilities to obtain 25 percent of their electrical energy from renewable resources. Xcel Energy, which supported the new law, must obtain 30 percent of its electricity from renewables by 2020.

“That means we will have to build more wind farms and more transmission in order to meet this ambitious goal,” Jaeger said.

Related News

Alberta Ends Moratorium on Renewable Energy Projects

Alberta Ends Renewable Energy Moratorium, accelerating wind and solar deployment while prioritizing grid stability, reliability, and infrastructure upgrades to attract investment, cut emissions, meet climate targets, and integrate renewables into the provincial power system.


Key Points

It is Alberta's decision to lift a pause on new wind and solar projects while enhancing grid reliability.

✅ Resumes wind and solar development across Alberta.

✅ Focuses on grid stability and infrastructure upgrades.

✅ Aims to attract investment and meet climate targets.


The Alberta government has announced the end of a temporary suspension on the development of new renewable energy projects, as the power grid operator prepares to accept green energy bids across the market. This pause, which had been in place since May 2023, was initially implemented to evaluate the effects of rapid growth in renewable energy installations on the province's power grid and overall energy system. However, the decision to lift the moratorium reflects a shift in the government’s approach to balancing energy needs and environmental goals.

The suspension was introduced amid concerns that the swift expansion of wind and solar energy projects, including documented challenges with solar energy expansion in the province, could place undue stress on Alberta's electrical grid and infrastructure. Officials expressed worries about the ability of the grid to handle the increased load and the potential need for upgrades to accommodate new renewable energy sources. The government aimed to assess the implications of this growth and determine appropriate measures to ensure that the energy system could support both existing and future demands.

The moratorium drew significant criticism from various sectors, including renewable energy companies, environmental advocates, and local communities. Critics argued that the pause was detrimental to Alberta's efforts to transition to cleaner energy sources and meet climate targets, citing cases like TransAlta scrapping a wind farm amid policy uncertainty. They pointed out that halting projects could delay investments and job creation associated with the renewable energy sector, potentially impeding progress towards a more sustainable energy future.

In response to these concerns, the Alberta government conducted further reviews and consultations. The decision to cancel the pause reflects the government’s recognition of the importance of advancing renewable energy initiatives while also addressing the need for grid stability and infrastructure development. By ending the moratorium, the government aims to support the continued growth of renewable energy projects and maintain momentum in the shift towards greener energy solutions.

The lifting of the moratorium is expected to have a positive impact on the renewable energy industry in Alberta. Several planned projects that were put on hold can now proceed, leading to renewed investment and economic benefits, including a renewable energy surge that could power 4,500 jobs across the province. The government’s decision signals a commitment to integrating renewable energy sources into the provincial grid in a way that ensures both reliability and sustainability.

Going forward, the Alberta government plans to implement measures to better manage the integration of renewable energy into the existing power infrastructure. This includes addressing any potential challenges related to grid capacity and ensuring that the growth of renewable energy projects aligns with the province's overall energy strategy, as recent federal procurement such as a $500M green electricity contract with an Edmonton company underscores demand that integration efforts must accommodate. The goal is to create a balanced approach that supports the development of clean energy while maintaining the stability and efficiency of the energy system.

The end of the moratorium aligns with Alberta’s broader objectives to reduce greenhouse gas emissions and promote environmental sustainability within a province recognized as a powerhouse for both green energy and fossil fuels in Canada. The government’s approach reflects a willingness to adapt policies and strategies in response to evolving industry needs and environmental priorities. By removing the pause, Alberta demonstrates its commitment to fostering a diverse and resilient energy sector that can meet both current and future demands.

The decision to cancel the moratorium is also seen as a move to reinforce Alberta’s position as a leader in renewable energy development. With the lifting of restrictions, the province can continue to attract investment in clean energy projects, as neighboring jurisdictions such as B.C. streamline clean energy approvals to accelerate deployment, enhance its reputation as a progressive energy market, and contribute to global efforts to address climate change.

In summary, the Alberta government’s decision to lift the pause on renewable energy projects represents a significant shift in its approach to energy policy. The move reflects an acknowledgment of the importance of advancing renewable energy while addressing the practical challenges associated with grid management and infrastructure development. By ending the moratorium, Alberta aims to support the growth of clean energy initiatives and maintain its commitment to sustainability and environmental responsibility.


Related News

View more

The Netherlands Outpaces Canada in Solar Power Generation

Netherlands vs Canada Solar Power compares per capita capacity, renewable energy policies, photovoltaics adoption, rooftop installations, grid integration, and incentives like feed-in tariffs and BIPV, highlighting efficiency, costs, and public engagement.


Key Points

Concise comparison of per capita capacity, policies, technology, and engagement in Dutch and Canadian solar adoption.

✅ Dutch per capita PV capacity exceeds Canada's by wide margin.

✅ Strong incentives: net metering, feed-in tariffs, rooftop focus.

✅ Climate, grid density, and awareness drive higher yields.


When it comes to harnessing solar power, the Netherlands stands as a shining example of efficient and widespread adoption, far surpassing Canada in solar energy generation per capita. Despite Canada's vast landmass and abundance of sunlight, the Netherlands has managed to outpace its North American counterpart, which some experts call a solar power laggard in solar energy production. This article explores the factors behind the Netherlands' success in solar power generation and compares it to Canada's approach.

Solar Power Capacity and Policy Support

The Netherlands has rapidly expanded its solar power capacity in recent years, driven by a combination of favorable policies, technological advancements, and public support. According to recent data, the Netherlands boasts a significantly higher per capita solar power capacity compared to Canada, where demand for solar electricity lags relative to deployment in many regions, leveraging its smaller geographical size and dense population centers to maximize solar panel installations on rooftops and in urban areas.

In contrast, Canada's solar energy development has been slower, despite having vast areas of suitable land for solar farms. Challenges such as regulatory hurdles, varying provincial policies, and the high initial costs of solar installations have contributed to a more gradual adoption of solar power across the country. However, provinces like Ontario have seen significant growth in solar installations due to supportive government incentives and favorable feed-in tariff programs, though growth projections were scaled back after Ontario scrapped a key program.

Innovation and Technological Advancements

The Netherlands has also benefited from ongoing innovations in solar technology and efficiency improvements. Dutch companies and research institutions have been at the forefront of developing new solar panel technologies, improving efficiency rates, and exploring innovative applications such as building-integrated photovoltaics (BIPV). These advancements have helped drive down the cost of solar energy and increase its competitiveness with traditional fossil fuels.

In contrast, while Canada has made strides in solar technology research and development, commercialization and widespread adoption have been more restrained due to factors like market fragmentation and the country's reliance on other energy sources such as hydroelectricity.

Public Awareness and Community Engagement

Public awareness and community engagement play a crucial role in the Netherlands' success in solar power adoption. The Dutch government has actively promoted renewable energy through public campaigns, educational programs, and financial incentives for homeowners and businesses to install solar panels. This proactive approach has fostered a culture of energy conservation and sustainability among the Dutch population.

In Canada, while there is growing public support for renewable energy, varying levels of awareness and engagement across different provinces have impacted the pace of solar energy adoption. Provinces like British Columbia and Alberta have seen increasing interest in solar power, driven by environmental concerns, technological advancements, and economic benefits, as the country is set to hit 5 GW of installed capacity in the near term.

Climate and Geographic Considerations

Climate and geographic considerations also influence the disparity in solar power generation between the Netherlands and Canada. The Netherlands, despite its northern latitude, benefits from relatively mild winters and a higher average annual sunlight exposure compared to most regions of Canada. This favorable climate has facilitated higher solar energy yields and made solar power a more viable option for electricity generation.

In contrast, Canada's diverse climate and geography present unique challenges for solar energy deployment. Northern regions experience extended periods of darkness during winter months, limiting the effectiveness of solar panels in those areas. Despite these challenges, advancements in energy storage technologies and hybrid solar-diesel systems are making solar power increasingly feasible in remote and off-grid communities across Canada, even as Alberta faces expansion challenges related to grid integration and policy.

Future Prospects and Challenges

Looking ahead, both the Netherlands and Canada face opportunities and challenges in expanding their respective solar power capacities. In the Netherlands, continued investments in solar technology, grid infrastructure upgrades, and policy support will be crucial for maintaining momentum in renewable energy development.

In Canada, enhancing regulatory consistency, scaling up solar installations in urban and rural areas, and leveraging emerging technologies will be essential for narrowing the gap with global leaders in solar energy generation and for seizing opportunities in the global electricity market as the energy transition accelerates.

In conclusion, while the Netherlands currently generates more solar power per capita than Canada, with the Prairie Provinces poised to lead growth in the Canadian market, both countries have unique strengths and challenges in their pursuit of a sustainable energy future. By learning from each other's successes and leveraging technological advancements, both nations can further accelerate the adoption of solar power and contribute to global efforts to combat climate change.


Related News

View more

Here are 3 ways to find out where your electricity comes from

US energy mix shows how the electric grid blends renewables, fossil fuels, nuclear, and hydro, varying by ISO/RTO markets, utilities, and state policies, affecting carbon emissions, pricing, reliability, and access.


Key Points

The US energy mix is the grid's source breakdown by region: fossil fuels, renewables, nuclear, and hydro.

✅ Check ISO or RTO dashboards for real-time generation by fuel source.

✅ Utilities may offer green power plans or RECs at modest premiums.

✅ Energy mix shifts with policy, pricing, and grid reliability needs.


There are few resources more important than energy. Sure, you may die if you don't eat for days. But your phone will die if you go too long without charging it. Energy feeds tech, the internet, city infrastructure, refrigerators, lights, and has evolved throughout U.S. history in profound ways. You get the idea. Yet unlike our other common needs, such as food, energy sources aren't exactly front of mind for most people. 

"I think a lot of people don't put a lot of bandwidth into thinking about this part of their lives," said Richard McMahon, the SVP of energy supply and finance at Edison Electric Institute, a trade group that represents investor-owned electric companies in the US. 

It makes sense. For most Americans, electricity is always there, and in many locations, there's not much of a choice involved, even as electricity demand is flat across the U.S. today. You sign up with a utility when you move into a new residence and pay your bills when they're due. 

But there's an important reality that indifference eschews: In 2018, a third of the energy-related carbon-dioxide emissions in the US came from the electric power sector, according to the US Energy Information Administration (EIA). 

A good chunk of that is from the residential sector, which consistently uses more energy than commercial customers, per EIA data.

Just as many people exercise choice when they eat, you typically also have a choice when it comes to your energy supply. That's not to say your current offering isn't what you want, or that switching will be easy or affordable, but "if you're a customer and want power with a certain attribute," McMahon said, "you can pretty much get it wherever you are." 

But first, you need to know the energy mix you have right now. As it turns out, it's not so straightforward. At all.

This brief guide may help. 

For some utility providers, you can find out if it publishes the energy mix online. Dominion Energy, which serves Idaho, North Carolina, Ohio, South Carolina, Utah, Virginia, West Virginia, and Wyoming, provides this information in a colored graphic. 

"Once you figure out who your utility is you can figure out what mix of resources they use," said Heidi Ratz, an electricity markets researcher at the World Resources Institute.

But not all utilities publish this information.

It has to do with their role in the grid and reflects utility industry trends in structure and markets. Some utility companies are vertically integrated; they generate power through nuclear plants or wind farms and distribute those electrons directly to their customers. Other utilities just distribute the power that different companies produce. 

Consider Consolidated Edison, or Con Ed, which distributes energy to parts of New York City. While reporting this story, Business Insider could not find information about the utility's energy mix online. When reached for comment, a spokesperson said, "we're indifferent to where it comes from."

That's because, in New York, distribution utilities like Con Ed often buy energy through a wholesale marketplace.

Take a look at this map. If you live in one of the colored regions, your electricity is sold on a wholesale market regulated by an organization called a regional transmission organization (RTO) or independent system operator (ISO). Distribution utilities like Con Ed often buy their energy through these markets, based on availability and cost, while raising questions about future utility revenue models as prices shift. 

Still, it's pretty easy to figure out where your energy comes from. Just look up the ISO or RTO website (such as NYISO or CAISO). Usually, these organizations will provide energy supply information in near-real time. 

That's exactly what Con Edison (which buys energy on the NYISO marketplace) suggested. As of Friday morning, roughly 40% of the energy on the market place was natural gas or other fossil fuels, 34% was nuclear, and about 22% was hydro. 

If you live in another region governed by an ISO or RTO, such as in most of California, you can do the same thing. Like NYISO, CAISO has a dashboard that shows (again, as of Friday morning) about 36% of the energy on the market comes from natural gas and more than 20% comes from renewables. 

In the map linked above, you'll notice that some of the ISOs and RTOs like MISO encompass enormous regions. That means that even if you figure out where the energy in your market comes from, it's not going to be geographically specific. But there are a couple of ways to drill down even further. 

The Environmental Protection Agency has a straightforward tool called Power Profiler. You can enter your zip code to see the fuel mix in your area. But it's not perfect. The data are from 2016 and, in some regions of the country like the upper Midwest, they aren't much more localized, and some import dirty electricity due to regional trading. 

The World Resources Institute also has a tool that allows you to see the electricity mix by state, based on 2017 data from EIA. These numbers represent power generation, not the electricity actually flowing into your sockets, but they offer a rough idea of what energy resources are operating in your state. 

One option is to check with your utility to see if it has a "green power" offering. Over 600 utilities across the country have one, according to the Climate Reality Project, though they often come at a slightly higher cost. It's typically on the scale of just a few more cents per kilowatt-hour. 

There are also independent, consumer-facing companies like Arcadia and Green Mountain Energy that allow you to source renewable energy, by virtually connecting you to community solar projects or purchasing Renewable Energy Certificates, or RECs, on your behalf, as America goes electric and more options emerge. 

"RECs measure an investment in a clean energy resource," Ratz said, in an email. "The goal of putting that resource on the grid is to push out the need for dirtier resources."

The good news: Even if you do nothing, your energy mix will get cleaner. Coal production has fallen to lows not seen since the 1980s, amid disruptions in coal and nuclear sectors that affect reliability and costs, while renewable electricity generation has doubled since 2008. So whether you like it or not, you'll be roped into the clean energy boom one way or another. 


Related News

View more

Report: Solar ITC Extension Would Be ‘Devastating’ for US Wind Market

Solar ITC Impact on U.S. Wind frames how a 30% solar investment tax credit could undercut wind PTC economics, shift corporate procurement, and, without transmission and storage, slow onshore builds despite offshore wind momentum.


Key Points

It is how a solar ITC extension may curb U.S. wind growth absent PTC parity, transmission, storage, and offshore backing.

✅ ITC at 30% risks shifting corporate procurement to solar.

✅ Post-PTC wind faces grid, transmission, and curtailment headwinds.

✅ Offshore wind, storage pairing, TOU demand could offset.


The booming U.S. wind industry, amid a wind power surge, faces an uncertain future in the 2020s. Few factors are more important than the fate of the solar ITC.

An extension of the solar investment tax credit (ITC) at its 30 percent value would be “devastating” to the future U.S. wind market, according to a new Wood Mackenzie report.

The U.S. is on track to add a record 14.6 gigawatts of new wind capacity in 2020, despite Covid-19 impacts, and nearly 39 gigawatts during a three-year installation boom from 2019 to 2021, according to Wood Mackenzie’s 2019 North America Wind Power Outlook.

But the market’s trajectory begins to look highly uncertain from the early 2020s onward, and solar is one of the main reasons why.

Since the dawn of the modern American renewables market, the wind and solar sectors have largely been allies on the national stage, benefiting from many of the same favorable government plans and sharing big-picture goals. Until recently, wind and solar companies rarely found themselves in direct competition.

But the picture is changing as solar catches up to wind on cost and the grid penetration of renewables surges. What was once a vague alliance between the two fastest growing renewables technologies could morph into a serious rivalry.

While many project developers are now active in both sectors, including NextEra Energy Resources, Invenergy and EDF, the country’s thriving base of wind manufacturers could face tougher days ahead.


The ITC's inherent advantage

At this point, wind remains solar’s bigger sibling in many ways.

The U.S. has nearly 100 gigawatts of installed wind capacity today, compared to around 67 gigawatts of solar. With their substantially higher capacity factors, wind farms generated four times more power for the U.S. grid last year than utility-scale solar plants, for a combined wind-solar share of 8.2 percent, according to government figures, even as renewables are projected to reach one-fourth of U.S. electricity generation. (Distributed PV systems further add to solar’s contribution.)

But it's long been clear that wind would lose its edge at some point. The annual solar market now regularly tops wind. The cost of solar energy is falling more rapidly, and appears to have more runway for further reduction. Solar’s inherent generation pattern is more valuable in many markets, delivering power during peak-demand hours, while the wind often blows strongest at night.


And then there’s the matter of the solar ITC.

In 2015, both wind and solar secured historic multi-year extensions to their main federal subsidies. The extensions gave both industries the longest period of policy clarity they’ve ever enjoyed, setting in motion a tidal wave of installations set to crest over the next few years.

Even back in 2015, however, it was clear that solar got the better deal in Washington, D.C.

While the wind production tax credit (PTC) began phasing down for new projects almost immediately, solar developers were given until the end of 2019 to qualify projects for the full ITC.

And critically, while the wind PTC drops to nothing after its sunset, commercially owned solar projects will remain eligible for a 10 percent ITC forever, based on the existing legislation. Over time, that amounts to a huge advantage for solar.

In another twist, the solar industry is now openly fighting for an extension of the 30 percent ITC, while the wind industry seemingly remains cooler on the prospect of pushing for a similar prolongation — having said the current PTC extension would be the last.


Plenty of tailwinds, too

Wood Mackenzie's report catalogues multiple factors that could work for or against the wind market in the "uncharted" post-PTC years, many of them, including the Covid-19 crisis, beyond the industry’s direct control.

If things go well, annual installations could bounce back to near-record levels by 2027 after a mid-decade contraction, the report says. But if they go badly, installations could remain depressed at 4 gigawatts or below from 2022 through most of the coming decade, and that includes an anticipated uplift from the offshore market.

An extension of the solar ITC without additional wind support would “severely compound” the wind market’s struggle to rebound in the 2020s, the report says. The already-evident shift in corporate renewables procurement from wind to solar could intensify dramatically.

The other big challenge for wind in the 2020s is the lack of progress on transmission infrastructure that would connect potentially massive low-cost wind farms in interior states with bigger population centers. A hoped-for national infrastructure package that might address the issue has not materialized.

Even so, many in the wind business remain cautiously optimistic about the post-PTC years, with a wind jobs forecast bolstering sentiment, and developers continue to build out longer-term project pipelines.

Turbine technology continues to improve. And an extension of the solar ITC is far from assured.

Other factors that could work in wind’s favor in the years ahead include:

The nascent offshore sector, which despite lingering regulatory uncertainty at the federal level looks set to blossom into a multi-gigawatt annual market by the mid-2020s, in line with an offshore wind forecast that highlights substantial growth potential. Lobbying efforts for an offshore wind ITC extension are gearing up, offering a potential area for cooperation between wind and solar.

The potential linkage of policy support for energy storage to wind projects, building on the current linkage with solar.

Growing electric vehicle sales and a shift toward time-of-use retail electricity billing, which could boost power demand during off-peak hours when wind generation is strong.

The land-use advantages wind farms have over solar in some agricultural regions.


Related News

View more

Carbon capture: How can we remove CO2 from the atmosphere?

CO2 Removal Technologies address climate change via negative emissions, including carbon capture, reforestation, soil carbon, biochar, BECCS, DAC, and mineralization, helping meet Paris Agreement targets while managing costs, land use, and infrastructure demands.


Key Points

Methods to extract or sequester atmospheric CO2, combining natural and engineered approaches to limit warming.

✅ Includes reforestation, soil carbon, biochar, BECCS, DAC, mineralization

✅ Balances climate goals with costs, land, energy, and infrastructure

✅ Key to Paris Agreement targets under 1.5-2.0 °C warming


The world is, on average, 1.1 degrees Celsius warmer today than it was in 1850. If this trend continues, our planet will be 2 – 3 degrees hotter by the end of this century, according to the Intergovernmental Panel on Climate Change (IPCC).

The main reason for this temperature rise is higher levels of atmospheric carbon dioxide, which cause the atmosphere to trap heat radiating from the Earth into space. Since 1850, the proportion of CO2 in the air has increased, with record greenhouse gas concentrations documented, from 0.029% to 0.041% (288 ppm to 414 ppm).

This is directly related to the burning of coal, oil and gas, which were created from forests, plankton and plants over millions of years. Back then, they stored CO2 and kept it out of the atmosphere, but as fossil fuels are burned, that CO2 is released. Other contributing factors include industrialized agriculture and slash-and-burn land clearing techniques, and emissions from SF6 in electrical equipment are also concerning today.

Over the past 50 years, more than 1200 billion tons of CO2 have been emitted into the planet's atmosphere — 36.6 billion tons in 2018 alone, though global emissions flatlined in 2019 before rising again. As a result, the global average temperature has risen by 0.8 degrees in just half a century.


Atmospheric CO2 should remain at a minimum
In 2015, the world came together to sign the Paris Climate Agreement which set the goal of limiting global temperature rise to well below 2 degrees — 1.5 degrees, if possible.

The agreement limits the amount of CO2 that can be released into the atmosphere, providing a benchmark for the global energy transition now underway. According to the IPCC, if a maximum of around 300 billion tons were emitted, there would be a 50% chance of limiting global temperature rise to 1.5 degrees. If CO2 emissions remain the same, however, the CO2 'budget' would be used up in just seven years.

According to the IPCC's report on the 1.5 degree target, negative emissions are also necessary to achieve the climate targets.


Using reforestation to remove CO2
One planned measure to stop too much CO2 from being released into the atmosphere is reforestation. According to studies, 3.6 billion tons of CO2 — around 10% of current CO2 emissions — could be saved every year during the growth phase. However, a study by researchers at the Swiss Federal Institute of Technology, ETH Zurich, stresses that achieving this would require the use of land areas equivalent in size to the entire US.

Young trees at a reforestation project in Africa (picture-alliance/OKAPIA KG, Germany)
Reforestation has potential to tackle the climate crisis by capturing CO2. But it would require a large amount of space


More humus in the soil
Humus in the soil stores a lot of carbon. But this is being released through the industrialization of agriculture. The amount of humus in the soil can be increased by using catch crops and plants with deep roots as well as by working harvest remnants back into the ground and avoiding deep plowing. According to a study by the German Institute for International and Security Affairs (SWP) on using targeted CO2 extraction as a part of EU climate policy, between two and five billion tons of CO2 could be saved with a global build-up of humus reserves.


Biochar shows promise
Some scientists see biochar as a promising technology for keeping CO2 out of the atmosphere. Biochar is created when organic material is heated and pressurized in a zero or very low-oxygen environment. In powdered form, the biochar is then spread on arable land where it acts as a fertilizer. This also increases the amount of carbon content in the soil. According to the same study from the SWP, global application of this technology could save between 0.5 and two billion tons of CO2 every year.


Storing CO2 in the ground
Storing CO2 deep in the Earth is already well-known and practiced on Norway's oil fields, for example. However, the process is still controversial, as storing CO2 underground can lead to earthquakes and leakage in the long-term. A different method is currently being practiced in Iceland, in which CO2 is sequestered into porous basalt rock to be mineralized into stone. Both methods still require more research, however, with new DOE funding supporting carbon capture, utilization, and storage.

Capturing CO2 to be held underground is done by using chemical processes which effectively extract the gas from the ambient air, and some researchers are exploring CO2-to-electricity concepts for utilization. This method is known as direct air capture (DAC) and is already practiced in other parts of Europe.  As there is no limit to the amount of CO2 that can be captured, it is considered to have great potential. However, the main disadvantage is the cost — currently around €550 ($650) per ton. Some scientists believe that mass production of DAC systems could bring prices down to €50 per ton by 2050. It is already considered a key technology for future climate protection.

The inside of a carbon capture facility in the Netherlands (RWE AG)
Carbon capture facilities are still very expensive and take up a huge amount of space

Another way of extracting CO2 from the air is via biomass. Plants grow and are burned in a power plant to produce electricity. CO2 is then extracted from the exhaust gas of the power plant and stored deep in the Earth, with new U.S. power plant rules poised to test such carbon capture approaches.

The big problem with this technology, known as bio-energy carbon capture and storage (BECCS) is the huge amount of space required. According to Felix Creutzig from the Mercator Institute on Global Commons and Climate Change (MCC) in Berlin, it will therefore only play "a minor role" in CO2 removal technologies.


CO2 bound by rock minerals
In this process, carbonate and silicate rocks are mined, ground and scattered on agricultural land or on the surface water of the ocean, where they collect CO2 over a period of years. According to researchers, by the middle of this century it would be possible to capture two to four billion tons of CO2 every year using this technique. The main challenges are primarily the quantities of stone required, and building the necessary infrastructure. Concrete plans have not yet been researched.


Not an option: Fertilizing the sea with iron
The idea is use iron to fertilize the ocean, thereby increasing its nuturient content, which would allow plankton to grow stronger and capture more CO2. However, both the process and possible side effects are very controversial. "This is rarely treated as a serious option in research," concludes SWP study authors Oliver Geden and Felix Schenuit.


Related News

View more

18% of electricity generated in Canada in 2019 came from fossil fuels

EV Decarbonization Strategy weighs life-cycle emissions and climate targets, highlighting mode shift to public transit, cycling, and walking, grid decarbonization, renewable energy, and charging infrastructure to cut greenhouse gases while reducing private car dependence.


Key Points

A plan to cut transport emissions by pairing EV adoption with mode shift, clean power, and less private car use.

✅ Prioritize mode shift: transit, cycling, and walking.

✅ Electrify remaining vehicles with clean, renewable power.

✅ Expand charging, improve batteries, and manage critical minerals.


California recently announced that it plans to ban the sales of gas-powered vehicles by 2035, a move similar to a 2035 electric vehicle mandate seen elsewhere, Ontario has invested $500 million in the production of electric vehicles (EVs) and Tesla is quickly becoming the world's highest-valued car company.

It almost seems like owning an electric vehicle is a silver bullet in the fight against climate change, but it isn't, as a U of T study explains today. What we should also be focused on is whether anyone should use a private vehicle at all.
 
As a researcher in sustainable mobility, I know this answer is unsatisfying. But this is where my latest research has led.

Battery EVs, such as the Tesla Model 3 - the best selling EV in Canada in 2020 - have no tailpipe emissions. But they do have higher production and manufacturing emissions than conventional vehicles, and often run on electricity that comes from fossil fuels.

Almost 18 per cent of the electricity generated in Canada came from fossil fuels in 2019, and even as Canada's EV goals grow more ambitious today, the grid mix varies from zero in Quebec to 90 per cent in Alberta.
 
Researchers like me compare the greenhouse gas emissions of an alternative vehicle, such as an EV, with those of a conventional vehicle over a vehicle lifetime, an exercise known as a life-cycle assessment. For example, a Tesla Model 3 compared with a Toyota Corolla can provide up to 75 per cent reduction in greenhouse gases emitted per kilometre travelled in Quebec, but no reductions in Alberta.


Hundreds of millions of new cars

To avoid extreme and irreversible impacts on ecosystems, communities and the overall global economy, we must keep the increase in global average temperatures to less than 2 C - and ideally 1.5 C - above pre-industrial levels by the year 2100.

We can translate these climate change targets into actionable plans. First, we estimate greenhouse gas emissions budgets using energy and climate models for each sector of the economy and for each country. Then we simulate future emissions, taking alternative technologies into account, as well as future potential economic and societal developments.

I looked at the U.S. passenger vehicle fleet, which adds up to about 260 million vehicles, while noting the potential for Canada-U.S. collaboration in this transition, to answer a simple question: Could the greenhouse gas emissions from the sector be brought in line with climate targets by replacing gasoline-powered vehicles with EVs?

The results were shocking. Assuming no changes to travel behaviours and a decarbonization of 80 per cent of electricity, meeting a 2 C target could require up to 300 million EVs, or 90 per cent of the projected U.S. fleet, by 2050. That would require all new purchased vehicles to be electric from 2035 onwards.

To put that into perspective, there are currently 880,000 EVs in the U.S., or 0.3 per cent of the fleet. Even the most optimistic projections, despite hype about an electric-car revolution gaining steam, from the International Energy Agency suggest that the U.S. fleet will only be at about 50 per cent electrified by 2050.


Massive and rapid electrification

Still, 90 per cent is theoretically possible, isn't it? Probably, but is it desirable?

In order to hit that target, we'd need to very rapidly overcome all the challenges associated with EV adoption, such as range anxiety, the higher purchase cost and availability of charging infrastructure.
 
A rapid pace of electrification would severely challenge the electricity infrastructure and the supply chain of many critical materials for the batteries, such as lithium, manganese and cobalt. It would require vast capacity of renewable energy sources and transmission lines, widespread charging infrastructure, a co-ordination between two historically distinct sectors (electricity and transportation systems) and rapid innovations in electric battery technologies. I am not saying it's impossible, but I believe it's unlikely.

Read more: There aren't enough batteries to electrify all cars - focus on trucks and buses instead

So what? Shall we give up, accept our collective fate and stop our efforts at electrification?

On the contrary, I think we should re-examine our priorities and dare to ask an even more critical question: Do we need that many vehicles on the road?


Buses, trains and bikes

Simply put, there are three ways to reduce greenhouse gas emissions from passenger transport: avoid the need to travel, shift the transportation modes or improve the technologies. EVs only tackle one side of the problem, the technological one.

And while EVs do decrease emissions compared with conventional vehicles, we should be comparing them to buses, including leading electric bus fleets in North America, trains and bikes. When we do, their potential to reduce greenhouse gas emissions disappears because of their life cycle emissions and the limited number of people they carry at one time.

If we truly want to solve our climate problems, we need to deploy EVs along with other measures, such as public transit and active mobility. This fact is critical, especially given the recent decreases in public transit ridership in the U.S., mostly due to increasing vehicle ownership, low gasoline prices and the advent of ride-hailing (Uber, Lyft)

Governments need to massively invest in public transit, cycling and walking infrastructure to make them larger, safer and more reliable, rather than expanding EV subsidies alone. And we need to reassess our transportation needs and priorities.

The road to decarbonization is long and winding. But if we are willing to get out of our cars and take a shortcut through the forest, we might get there a lot faster.

Author: Alexandre Milovanoff - Postdoctoral Researcher, Environmental Engineering, University of Toronto The Conversation


Related News

View more

Sign Up for Electricity Forum’s Newsletter

Stay informed with our FREE Newsletter — get the latest news, breakthrough technologies, and expert insights, delivered straight to your inbox.

Electricity Today T&D Magazine Subscribe for FREE

Stay informed with the latest T&D policies and technologies.
  • Timely insights from industry experts
  • Practical solutions T&D engineers
  • Free access to every issue

Download the 2025 Electrical Training Catalog

Explore 50+ live, expert-led electrical training courses –

  • Interactive
  • Flexible
  • CEU-cerified