California Nuclear Renewable Bill AB 2898 seeks to add nuclear to the Renewables Portfolio Standard, impacting Diablo Canyon, PG&E compliance, carbon-free targets, and potential license extensions while addressing climate goals and natural gas reliance.
Key Points
A bill to add nuclear to California's RPS, influencing Diablo Canyon, PG&E planning, and carbon-free climate targets.
✅ Reclassifies nuclear as renewable in California's RPS.
✅ Could influence Diablo Canyon license extension and ownership.
✅ Targets carbon-free goals while limiting natural gas reliance.
Although he admits it's a long shot, a member of the California Legislature from the district that includes the Diablo Canyon nuclear plant has introduced a bill that would add nuclear power to the state's list of renewable energy sources.
"I think that nuclear power is an important component of generating large-scale electricity that's good for the environment," said Jordan Cunningham, R-San Luis Obispo. "Without nuclear as part of the renewable portfolio, we're going to have tremendous difficulty meeting the state's climate goals without a significant cost increase on electricity ratepayers."
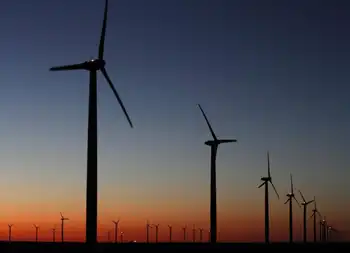
Established in 2002, California's Renewables Portfolio Standard spells out the power sources eligible to count toward the state's goals to wean itself of fossil fuels. The list includes solar, wind, biomass, geothermal, small hydroelectric facilities and even tidal currents. The standard has been updated, currently calling for 60 percent of California's electricity to come from renewables by 2030 and 100 percent from carbon-free sources by 2045, even as some analyses argue net-zero emissions may be difficult to achieve without nuclear power.
Nuclear power is not part of the portfolio standard and Diablo Canyon — the only remaining nuclear plant in California — is scheduled to stop producing electricity by 2025, even as some Southern California plant closures face postponement to maintain grid reliability.
Pacific Gas & Electric, the operators of Diablo Canyon, announced in 2016 an agreement with a collection of environmental and labor groups to shut down the plant, often framed as part of a just transition for workers and communities. PG&E said Diablo will become uneconomical to run due to changes in California's power grid — such as growth of renewable energy sources, increased energy efficiency measures and the migration of customers from traditional utilities to community choice energy programs.
But Cunningham thinks the passage of Assembly Bill 2898, which he introduced last week, — as innovators like Bill Gates' mini-reactor venture tout new designs — could give the plant literally a new lease on life.
"If PG&E were able to count the power produced (at Diablo) toward its renewable goals, it might — I'm not saying it will or would, but it might — cause them to reconsider applying to extend the operating license at Diablo," Cunningham said.
Passing the bill, supporters say, could also make Diablo Canyon attractive to an outside investor to purchase and then apply to the Nuclear Regulatory Commission for a license extension.
But nuclear power has long generated opposition in California and AB 2898 will face long odds in Sacramento, and similar efforts elsewhere have drawn opposition from power producers as well. The Legislature is dominated by Democrats, who have expressed more interest in further developing wind and solar energy projects than offering a lifeline to nuclear.
And if the bill managed to generate momentum, anti-nuclear groups will certainly be quick to mobilize, reflecting a national energy debate over Three Mile Island and whether to save struggling plants.
When told of Cunningham's bill, David Weisman, outreach coordinator for the Alliance for Nuclear Responsibility, said flatly, "Diablo Canyon has become a burdensome, costly nuclear white elephant."
Critics say nuclear power by definition cannot be considered renewable because it leaves behind waste in the form of spent nuclear fuel that then has to be stored, while supporters point to next-gen nuclear designs that aim to improve safety and costs. The federal government has not found a site to deposit the waste that has built up over decades from commercial nuclear power plants.
Even though Diablo Canyon is the only nuclear plant left in the Golden State, it accounts for 9 percent of California's power mix. Cunningham says if the plant closes, the state's reliance on natural gas — a fossil fuel — will increase, pointing to what happened when the San Onofre Nuclear Generating Station closed.
In 2011, the final full year operations for San Onofre, nuclear accounted for 18.2 percent of in-state generation and natural gas made up 45.4 percent. The following year, nuclear dropped to 9.3 percent and gas shot up to 61.1 percent of in-state generation.
"If we're going to get serious about being a national leader as California has been on dealing with climate change, I think nuclear is part of the answer," Cunningham said.
But judging from the response to an email from the Union-Tribune, PG&E isn't exactly embracing Cunningham's bill.
"We remain focused on safely and reliably operating Diablo Canyon Power Plant until the end of its current operating licenses and planning for a successful decommissioning," said Suzanne Hosn, a PG&E senior manager at Diablo Canyon. "The Assemblyman's proposal does not change any of PG&E's plans for the plant."
Cunningham concedes AB 2898 is "a Hail Mary pass" but said "it's an important conversation that needs to be had."
The second-term assemblyman introduced a similar measure late last year that sought to have the Legislature bring the question before voters as an amendment to the state constitution. But the legislation, which would require a two-thirds majority vote in the Assembly and the Senate, is still waiting for a committee assignment.
AB 2898, on the other hand, requires a simple majority to move through the Legislature. Cunningham said he hopes the bill will receive a committee assignment by the end of next month.
Related News