NFPA 70E Training
Our customized live online or in‑person group training can be delivered to your staff at your location.

- Live Online
- 6 hours Instructor-led
- Group Training Available
Regular Price:
$199
Coupon Price:
$149
TORONTO
—
Ontario EV Battery Separator Plant anchors Canada's EV supply chain, with Asahi Kasei producing lithium-ion battery separators in Niagara Region to support Honda's Alliston assembly, clean transportation growth, and sustainable manufacturing jobs.
Context and Background
Asahi Kasei's Niagara Region plant makes lithium-ion battery separators supplying Honda's EV factory in Ontario.
Starts up by 2027 to align with Honda EV output timeline.
Backed by clean tech tax credits and public investment.
Boosts local jobs, R&D, and clean transportation leadership.
The automotive industry is undergoing a seismic shift, and Canada is firmly planting its flag in the electric vehicle (EV) revolution, propelled by recent EV assembly deals across the country. A new $1.6 billion battery component plant in Ontario's Niagara Region signifies a significant step towards a cleaner, more sustainable transportation future. This Asahi Kasei facility, a key player in Honda's $15 billion electric vehicle supply chain investment, promises to create jobs, boost the local economy, and solidify Ontario's position as a leader in clean transportation technology.
Honda's ambitious project forms part of Honda's Ontario EV investment that involves constructing a dedicated battery plant adjacent to their existing Alliston, Ontario assembly facility. This new plant will focus on producing fully electric vehicles, requiring a robust supply chain for critical components. Asahi Kasei's Niagara Region plant enters the picture here, specializing in the production of battery separators – a thin film crucial for separating the positive and negative electrodes within a lithium-ion battery. These separators play a vital role in ensuring the battery functions safely and efficiently.
The Niagara Region plant is expected to be operational by 2 027, perfectly aligning with Honda's EV production timeline. This strategic partnership benefits both companies: Honda secures a reliable source for a vital component, while Asahi Kasei capitalizes on the burgeoning demand for EV parts. The project is a catalyst for economic growth in Ontario, creating jobs in construction and manufacturing, supporting an EV jobs boom province-wide, and potentially future research and development sectors. Additionally, it positions the province as a hub for clean transportation technology, attracting further investment and fostering innovation.
This announcement isn't an isolated event. News of Volkswagen constructing a separate EV battery plant in St. Thomas, Ontario, and the continuation of a major EV battery project near Montreal further underscore Canada's commitment to electric vehicles. These developments signify a clear shift in the country's automotive landscape, with a focus on sustainable solutions.
Government support has undoubtedly played a crucial role in attracting these investments. The Honda deal involves up to $5 billion in public funds. Asahi Kasei's Niagara Region plant is also expected to benefit from federal and provincial clean technology tax credits. This demonstrates a collaborative effort between government and industry, including investments by Canada and Quebec in battery assembly, to foster a thriving EV ecosystem in Canada.
The economic and environmental benefits of this project are undeniable. Battery production is expected to create thousands of jobs, while the shift towards electric vehicles will lead to reduced emissions and a cleaner environment. Ontario stands to gain significantly from this transition, becoming a leader in clean energy technology and attracting skilled workers and businesses catering to the EV sector, especially as the U.S. auto pivot to EVs accelerates across the border.
However, challenges remain. Concerns about the environmental impact of battery production, particularly the sourcing of raw materials and the potential for hazardous waste, need to be addressed. Additionally, ensuring a skilled workforce capable of handling the complexities of EV technology is paramount.
Despite these challenges, the future of electric vehicles in Canada appears bright. Major automakers are making significant investments, government support is growing, and consumer interest in EVs is on the rise. The Niagara Region plant serves as a tangible symbol of Canada's commitment to a cleaner and more sustainable transportation future. With careful planning and continued Canada-U.S. collaboration across the sector, this project has the potential to revolutionize the Canadian automotive industry and pave the way for a greener tomorrow.
Related News

"It's freakishly cold": Deep freeze slams American energy sector
Texas Deep Freeze Energy Crisis strains grids as polar vortex triggers rolling blackouts, record natural…
View more
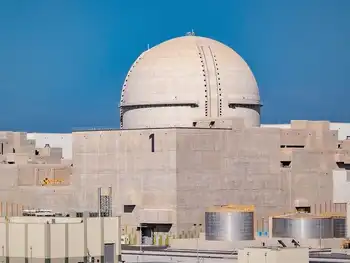
Barakah Unit 1 reaches 100% power as it steps closer to commercial operations, due to begin early 2021
Barakah Unit 1 100 Percent Power signals the APR-1400 reactor delivering 1400MW of clean baseload…
View more
U.A.E. Becomes First Arab Nation to Open a Nuclear Power Plant
UAE Nuclear Power Plant launches the Barakah facility, delivering clean electricity to the Middle East…
View more
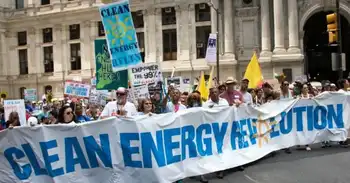
New Program Set to Fight for 'Electricity Future That Works for People and the Planet'
Energy Justice Program drives a renewables-based transition, challenging utility monopolies with legal action, promoting rooftop…
View more

Victims of California's mega-fire will sue electricity company
PG&E Wildfire Lawsuit alleges utility negligence, inadequate infrastructure maintenance, and faulty transmission lines, as victims…
View more
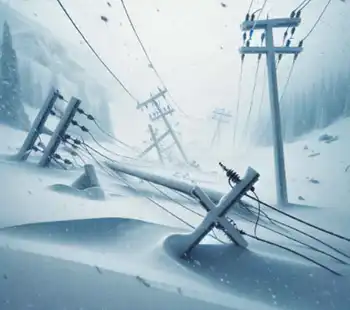
Canadian Electricity Grids Increasingly Exposed to Harsh Weather
North American Grid Reliability faces extreme weather, climate change, demand spikes, and renewable variability; utilities,…
View more
Sign Up for Electricity Forum’s Newsletter
Stay informed with our FREE Newsletter — get the latest news, breakthrough technologies, and expert insights, delivered straight to your inbox.
Electricity Today T&D Magazine Subscribe for FREE

Stay informed with the latest T&D policies and technologies.
- Timely insights from industry experts
- Practical solutions T&D engineers
- Free access to every issue

