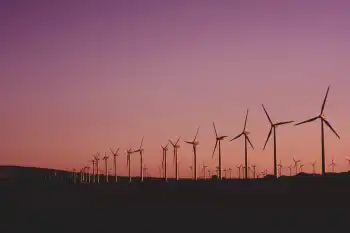
Offshore wind power accelerates low-carbon electrification, leveraging floating turbines, high capacity factors, HVDC transmission, and hydrogen production to decarbonize grids, cut CO2, and deliver competitive, reliable renewable energy near demand centers.
Key Points
Offshore wind power uses offshore turbines to deliver low-carbon electricity with high capacity factors and falling costs.
✅ Sea-based wind farms with 40-50% capacity factors
✅ Floating turbines unlock deep-water, far-shore resources
✅ Enables hydrogen production and strengthens grid reliability
The need for affordable low-carbon technologies is greater than ever
Global energy-related CO2 emissions reached a historic high in 2018, driven by an increase in coal use in the power sector. Despite impressive gains for renewables, fossil fuels still account for nearly two-thirds of electricity generation, the same share as 20 years ago. There are signs of a shift, with increasing pledges to decarbonise economies and tackle air pollution, and with World Bank support helping developing countries scale wind, but action needs to accelerate to meet sustainable energy goals. As electrification of the global energy system continues, the need for clean and affordable low-carbon technologies to produce this electricity is more pressing than ever. This World Energy Outlook special report offers a deep dive on a technology that today has a total capacity of 23 GW (80% of it in Europe) and accounts for only 0.3% of global electricity generation, but has the potential to become a mainstay of the world's power supply. The report provides the most comprehensive analysis to date of the global outlook for offshore wind, its contributions to electricity systems and its role in clean energy transitions.
The offshore wind market has been gaining momentum
The global offshore wind market grew nearly 30% per year between 2010 and 2018, benefitting from rapid technology improvements. Over the next five years, about 150 new offshore wind projects are scheduled to be completed around the world, pointing to an increasing role for offshore wind in power supplies. Europe has fostered the technology's development, led by the UK offshore wind sector alongside Germany and Denmark. The United Kingdom and Germany currently have the largest offshore wind capacity in operation, while Denmark produced 15% of its electricity from offshore wind in 2018. China added more capacity than any other country in 2018.
The untapped potential of offshore wind is vast
The best offshore wind sites could supply more than the total amount of electricity consumed worldwide today. And that would involve tapping only the sites close to shores. The IEA initiated a new geospatial analysis for this report to assess offshore wind technical potential country by country. The analysis was based on the latest global weather data on wind speed and quality while factoring in the newest turbine designs. Offshore wind's technical potential is 36 000 TWh per year for installations in water less than 60 metres deep and within 60 km from shore. Global electricity demand is currently 23 000 TWh. Moving further from shore and into deeper waters, floating turbines could unlock enough potential to meet the world's total electricity demand 11 times over in 2040. Our new geospatial analysis indicates that offshore wind alone could meet several times electricity demand in a number of countries, including in Europe, the United States and Japan. The industry is adapting various floating foundation technologies that have already been proven in the oil and gas sector. The first projects are under development and look to prove the feasibility and cost-effectiveness of floating offshore wind technologies.
Offshore wind's attributes are very promising for power systems
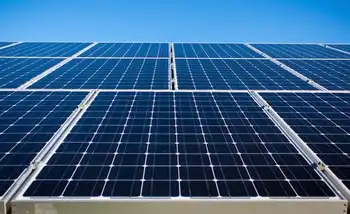
New offshore wind projects have capacity factors of 40-50%, as larger turbines and other technology improvements are helping to make the most of available wind resources. At these levels, offshore wind matches the capacity factors of gas- and coal-fired power plants in some regions – though offshore wind is not available at all times. Its capacity factors exceed those of onshore wind and are about double those of solar PV. Offshore wind output varies according to the strength of the wind, but its hourly variability is lower than that of solar PV. Offshore wind typically fluctuates within a narrower band, up to 20% from hour to hour, than solar PV, which varies up to 40%.
Offshore wind's high capacity factors and lower variability make its system value comparable to baseload technologies, placing it in a category of its own – a variable baseload technology. Offshore wind can generate electricity during all hours of the day and tends to produce more electricity in winter months in Europe, the United States and China, as well as during the monsoon season in India. These characteristics mean that offshore wind's system value is generally higher than that of its onshore counterpart and more stable over time than that of solar PV. Offshore wind also contributes to electricity security, with its high availability and seasonality patterns it is able to make a stronger contribution to system needs than other variable renewables. In doing so, offshore wind contributes to reducing CO2 and air pollutant emissions while also lowering the need for investment in dispatchable power plants. Offshore wind also has the advantage of avoiding many land use and social acceptance issues that other variable renewables are facing.
Offshore wind is on track to be a competitive source of electricity
Offshore wind is set to be competitive with fossil fuels within the next decade, as well as with other renewables including solar PV. The cost of offshore wind is declining and is set to fall further. Financing costs account for 35% to 50% of overall generation cost, and supportive policy frameworks are now enabling projects to secure low cost financing in Europe, with zero-subsidy tenders being awarded. Technology costs are also falling. The levelised cost of electricity produced by offshore wind is projected to decline by nearly 60% by 2040. Combined with its relatively high value to the system, this will make offshore wind one of the most competitive sources of electricity. In Europe, recent auctions indicate that offshore wind will soon beat new natural gas-fired capacity on cost and be on a par with solar PV and onshore wind. In China, offshore wind is set to become competitive with new coal-fired capacity around 2030 and be on par with solar PV and onshore wind. In the United States, recent project proposals indicate that offshore wind will soon be an affordable option, even as the 1 GW timeline continues to evolve, with potential to serve demand centres along the country's east coast.
Innovation is delivering deep cost reductions in offshore wind, and transmission costs will become increasingly important. The average upfront cost to build a 1 gigawatt offshore wind project, including transmission, was over $4 billion in 2018, but the cost is set to drop by more than 40% over the next decade. This overall decline is driven by a 60% reduction in the costs of turbines, foundations and their installation. Transmission accounts for around one-quarter of total offshore wind costs today, but its share in total costs is set to increase to about one-half as new projects move further from shore. Innovation in transmission, for example through work to expand the limits of direct current technologies, will be essential to support new projects without raising their overall costs.
Offshore wind is set to become a $1 trillion business
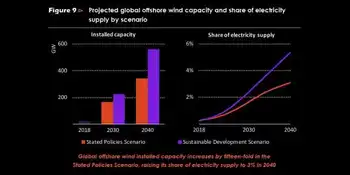
Offshore wind power capacity is set to increase by at least 15-fold worldwide by 2040, becoming a $1 trillion business. Under current investment plans and policies, the global offshore wind market is set to expand by 13% per year, reflecting its growth despite Covid-19 in recent years, passing 20 GW of additions per year by 2030. This will require capital spending of $840 billion over the next two decades, almost matching that for natural gas-fired or coal-fired capacity. Achieving global climate and sustainability goals would require faster growth: capacity additions would need to approach 40 GW per year in the 2030s, pushing cumulative investment to over $1.2 trillion.
The promising outlook for offshore wind is underpinned by policy support in an increasing number of regions. Several European North Seas countries – including the United Kingdom, Germany, the Netherlands and Denmark – have policy targets supporting offshore wind. Although a relative newcomer to the technology, China is quickly building up its offshore wind industry, aiming to develop a project pipeline of 10 GW by 2020. In the United States, state-level targets and federal incentives are set to kick-start the U.S. offshore wind surge in the coming years. Additionally, policy targets are in place and projects under development in Korea, Japan, Chinese Taipei and Viet Nam.
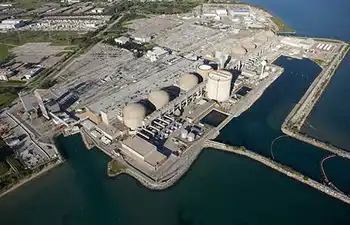
The synergies between offshore wind and offshore oil and gas activities provide new market opportunities. Since offshore energy operations share technologies and elements of their supply chains, oil and gas companies started investing in offshore wind projects many years ago. We estimate that about 40% of the full lifetime costs of an offshore wind project, including construction and maintenance, have significant synergies with the offshore oil and gas sector. That translates into a market opportunity of $400 billion or more in Europe and China over the next two decades. The construction of foundations and subsea structures offers potential crossover business, as do practices related to the maintenance and inspection of platforms. In addition to these opportunities, offshore oil and gas platforms require electricity that is often supplied by gas turbines or diesel engines, but that could be provided by nearby wind farms, thereby reducing CO2 emissions, air pollutants and costs.
Offshore wind can accelerate clean energy transitions
Offshore wind can help drive energy transitions by decarbonising electricity and by producing low-carbon fuels. Over the next two decades, its expansion could avoid between 5 billion and 7 billion tonnes of CO2 emissions from the power sector globally, while also reducing air pollution and enhancing energy security by reducing reliance on imported fuels. The European Union is poised to continue leading the wind energy at sea in Europe industry in support of its climate goals: its offshore wind capacity is set to increase by at least fourfold by 2030. This growth puts offshore wind on track to become the European Union's largest source of electricity in the 2040s. Beyond electricity, offshore wind's high capacity factors and falling costs makes it a good match to produce low-carbon hydrogen, a versatile product that could help decarbonise the buildings sector and some of the hardest to abate activities in industry and transport. For example, a 1 gigawatt offshore wind project could produce enough low-carbon hydrogen to heat about 250 000 homes. Rising demand for low-carbon hydrogen could also dramatically increase the market potential for offshore wind. Europe is looking to develop offshore "hubs" for producing electricity and clean hydrogen from offshore wind.
It's not all smooth sailing
Offshore wind faces several challenges that could slow its growth in established and emerging markets, but policy makers and regulators can clear the path ahead. Developing efficient supply chains is crucial for the offshore wind industry to deliver low-cost projects. Doing so is likely to call for multibillion-dollar investments in ever-larger support vessels and construction equipment. Such investment is especially difficult in the face of uncertainty. Governments can facilitate investment of this kind by establishing a long-term vision for offshore wind and by drawing on U.K. policy lessons to define the measures to be taken to help make that vision a reality. Long-term clarity would also enable effective system integration of offshore wind, including system planning to ensure reliability during periods of low wind availability.
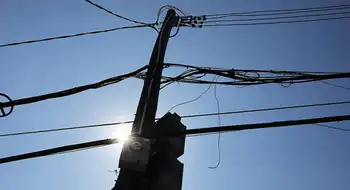
The success of offshore wind depends on developing onshore grid infrastructure. Whether the responsibility for developing offshore transmission lies with project developers or transmission system operators, regulations should encourage efficient planning and design practices that support the long-term vision for offshore wind. Those regulations should recognise that the development of onshore grid infrastructure is essential to the efficient integration of power production from offshore wind. Without appropriate grid reinforcements and expansion, there is a risk of large amounts of offshore wind power going unused, and opportunities for further expansion could be stifled. Development could also be slowed by marine planning practices, regulations for awarding development rights and public acceptance issues.
The future of offshore wind looks bright but hinges on the right policies
The outlook for offshore wind is very positive as efforts to decarbonise and reduce local pollution accelerate. While offshore wind provides just 0.3% of global electricity supply today, it has vast potential around the world and an important role to play in the broader energy system. Offshore wind can drive down CO2 emissions and air pollutants from electricity generation. It can also do so in other sectors through the production of clean hydrogen and related fuels. The high system value of offshore wind offers advantages that make a strong case for its role alongside other renewables and low-carbon technologies. Government policies will continue to play a critical role in the future of offshore wind and the overall pace of clean energy transitions around the world.
Related News