Powering India: feeding an insatiable need

By The Independent


CSA Z462 Arc Flash Training - Electrical Safety Essentials

Our customized live online or in‑person group training can be delivered to your staff at your location.

  • Live Online
  • 6 hours Instructor-led
  • Group Training Available
Regular Price:
$249
Coupon Price:
$199
Reserve Your Seat Today
Like most countries, India's electricity is distributed to its population via a large, centralized grid system.

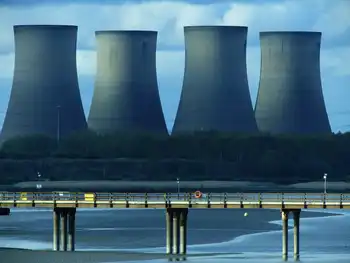
Through the construction of thermal power plants and large hydroelectric dams, the Government has added 150MW of installed generating capacity to this grid in the 62 years since independence, yet such priority is given to feeding the insatiable demands of the cities that 78 million people in India are still living without an electricity connection.

Yet a connection to the electricity grid far from assures a dependable supply of power for those living in rural areas. A recent report by Greenpeace India, Still Waiting, surveyed a tier A city, a tier B city and three villages in five states across India, and found that, while the cities received between 22 and 24 hours of electricity supply per day, all the villages surveyed had a power supply of less than 12 hours a day on average. In the villages, electricity is used for pumping drinking water, irrigating crops and keeping wild animals at bay, in addition to lighting and for small industry.

To compound their problems, the rural population are often the ones who must suffer the local environmental and health impacts of centralized power plants, such as the choking grey ash produced by burning coal, or the inhospitable and marshy land created by impounding large water bodies.

Related News

Learn how fees and usage impacts your electricity bill in new online CER tool

CER Interactive Electricity Bill Tool compares provincial electricity prices, fees, taxes, and usage. Explore household appliance costs, hydroelectric generation, and consumption trends across Canada with interactive calculators and a province-by-province breakdown.


Key Points

An online CER report with calculators comparing electricity prices, fees, and usage to explain household energy costs.

✅ Province-by-province bill, price, and consumption comparison

✅ Calculator for appliance and electronics energy costs

✅ Explains fees, taxes, regulation, and generation sources


Canadians have a new way to assess their electricity bill in a new, interactive online report released by the Canada Energy Regulator (CER).

The report titled What is in a residential electricity bill? features a province-to-province comparison of electricity bills, generation and consumption. It also explains electricity prices across the country, including how Calgary electricity prices have changed, allowing people to understand why costs vary depending on location, fees, regulation and taxes.  

Learn how fees and usage impacts your electricity bill in new online CER tool
Interactive tools allow people to calculate the cost of household appliances and electronic use for each province and territory, and to understand how Ontario rate increases may affect monthly bills. For example, an individual can use the tools to find out that leaving a TV on for 24-hours in Quebec costs $5.25 per month, while that same TV on for a whole day would cost $12.29 per month in Saskatchewan, $20.49 per month in the Northwest Territories, and $15.30 per month in Nova Scotia.

How Canadians use energy varies as much as how provinces and territories produce it, especially in regions like Nunavut where unique conditions influence costs. Millions of Canadians rely on electricity to power their household appliances, charge their electronics, and heat their homes. Provinces with abundant hydro-electric resources like Quebec, B.C., Manitoba, and Newfoundland and Labrador use electricity for home heating and tend to consume the most electricity.

By gathering data from various sources, this report is the first Canadian publication that features interactive tools to allow for a province-by-province comparison of electricity bills while highlighting different elements within an electricity bill, a helpful context as Canada faces a critical supply crunch in the years ahead.

The CER monitors energy markets and assesses Canadian energy requirements and trends, including clean electricity regulations developments that shape pricing. This report is part of a portfolio of publications on energy supply, demand and infrastructure that the CER publishes regularly as part of its ongoing market monitoring.

"No matter where you go in the country, Canadians want to know how much they pay for power and why, especially amid price spikes in Alberta this year," says lead author Colette Craig. "This innovative, interactive report really explains electricity bills to help everyone understand electricity pricing and consumption across Canada."

Quick Facts

  • Quebec ranks first in electricity consumption per capita at 21.0 MW.h, followed by Saskatchewan at 20.0 MW.h, Newfoundland and Labrador at 19.3 MW.h.
  • About 95% of Quebec's electricity is produced from hydroelectricity.
  • Provinces that use electricity for home heating tend to consume the most electricity.
  • Canada's largest consuming sector for electricity was industrial at 238 TW.h. The residential and commercial sectors consumed 168 TW.h and 126 TW.h, respectively.
  • In 2018, Canada produced 647.7 terawatt hours (TW.h) of electricity. More than half of the electricity in Canada (61%) is generated from hydro sources. The remainder is produced from a variety of sources, such as fossil fuels (natural gas and petroleum), nuclear, wind, coal, biomass, solar.
  • Canada is a net exporter of electricity. In 2019, net exports to the U.S. electricity market totaled 47.0 TW.h.
  • The total value of Canada's electricity exports was $2.5 billion Canadian dollars and the value of imports was $0.6 billion Canadian dollars, resulting in 2019 net exports of $1.9 billion.
  • All regions in Canada are reflected in this report but it does not include data that reflects the COVID-19 lockdown and its effects on residential electricity bills.


Related News

View more

India is now the world’s third-largest electricity producer

India Electricity Production 2017 surged to 1,160 BU, ranking third globally; rising TWh output with 334 GW capacity, strong renewables and thermal mix, 7% CAGR in generation, and growing demand, investments, and FDI inflows.


Key Points

India's 2017 power output reached 1,160 BU, third globally, supported by 334 GW capacity, rising renewables, and 7% CAGR.

✅ 1,160 BU generated; third after China and the US

✅ Installed capacity 334 GW; 65% thermal, rising renewables

✅ Generation CAGR ~7%; demand, FDI, investments rising


India now generates around 1,160.1 billion units of electricity in financial year 2017, up 4.72% from the previous year, and amid surging global electricity demand that is straining power systems. The country is behind only China which produced 6,015 terrawatt hours (TWh. 1 TW = 1,000,000 megawatts) and the US (4,327 TWh), and is ahead of Russia, Japan, Germany, and Canada.


India’s electricity production grew 34% over seven years to 2017, and the country now produces more energy than Japan and Russia, which had 27% and 8.77% more electricity generation capacity installed, respectively, than India seven years ago.

India produced 1,160.10 billion units (BU) of electricity–one BU is enough to power 10 million households (one household using average of about 3 units per day) for a month–in financial year (FY) 2017. Electricity production stood at 1,003.525 BU between April 2017-January 2018, according to a February 2018 report by India Brand Equity Foundation (IBEF), a trust established by the commerce ministry.

#google#

With a production of 1,423 BU in FY 2016, India was the third largest producer and the third largest consumer of electricity in the world, behind China (6,015 BU) and the United States (4,327 BU).

With an annual growth rate of 22.6% capacity addition over a decade to FY 2017, renewables beat other power sources–thermal, hydro and nuclear. Renewables, however, made up only 18.79% of India’s energy, up 68.65% since 2007, and globally, low-emissions sources are expected to cover most demand growth in the coming years. About 65% of installed capacity continues to be thermal.

As of January 2018, India has installed power capacity of 334.4 gigawatt (GW), making it the fifth largest installed capacity in the world after European Union, China, United States and Japan, and with much of the fleet coal-based, imported coal volumes have risen at times amid domestic supply constraints.

The government is targeting capacity addition of around 100 GW–the current power production of United Kingdom–by 2022, as per the IBEF report.


Electricity generation grew at 7% annually

India achieved a 34.48% growth in electricity production by producing 1,160.10 BU in 2017 compared to 771.60 BU in 2010–meaning that in these seven years, electricity production in India grew at a compound annual growth rate (CAGR) of 7.03%, while thermal power plants' PLF has risen recently amid higher demand and lower hydro.


Generation capacity grew at 10% annually

Of 334.5 GW installed capacity as of January 2018–up 60% from 132.30 GW in 2007–thermal installed capacity was 219.81 GW. Hydro and renewable energy installed capacity totaled 44.96 GW and 62.85 GW, respectively, said the report.

The CAGR in installed capacity over a decade to 2017 was 10.57% for thermal power, 22.06% for renewable energy–the fastest among all sources of power–2.51% for hydro power and 5.68% for nuclear power.


Growing demand, higher investments will drive future growth

Growing population and increasing penetration of electricity connections, along with increasing per-capita usage would provide further impetus to the power sector, said the report.

Power consumption is estimated to increase from 1,160.1 BU in 2016 to 1,894.7 BU in 2022, as per the report, though electricity demand fell sharply in one recent period.

Increasing investment remained one of the driving factors of power sector growth in the country.

Power sector has a 100% foreign direct investment (FDI) permit, which boosted FDI inflows in the sector.

Total FDI inflows in the power sector reached $12.97 billion (Rs 83,713 crore) during April 2000 to December 2017, accounting for 3.52% of FDI inflows in India, the report said.


Related News

View more

B.C. Hydro misled regulator: report

BC Hydro SAP Oversight Report assesses B.C. Utilities Commission findings on misleading testimony, governance failures, public funds oversight, IT project risk, compliance gaps, audit controls, ratepayer impacts, and regulatory accountability in major enterprise software decisions.


Key Points

A summary of BCUC findings on BC Hydro's SAP IT project oversight, governance lapses, and regulatory compliance.

✅ BCUC probed testimony, cost overruns, and governance failures

✅ Project split to avoid scrutiny; incomplete records and late corrections

✅ Reforms pledged: stronger business cases, compliance, audit controls


B.C. Hydro misled the province’s independent regulator about an expensive technology program, thereby avoiding scrutiny on how it spent millions of dollars in public money, according to a report by the B.C. Utilities Commission.

The Crown power corporation gave inaccurate testimony to regulators about the software it had chosen, called SAP, for an information technology project that has cost $197 million, said the report.

“The way the SAP decision was made prevented its appropriate scrutiny by B.C. Hydro’s board of directors and the BCUC, reflecting governance risks seen in Manitoba Hydro board changes in other jurisdictions,” the commission found.

“B.C. Hydro’s CEO and CFO and its (audit and risk management board committee) members did not exhibit good business judgment when reviewing and approving the SAP decision without an expenditure approval or business case, highlighting how board upheaval at Hydro One can carry market consequences.”

The report was the result of a complaint made in 2016 by then-opposition NDP MLA Adrian Dix, who alleged B.C. Hydro lied to the regulatory commission to try to get approval for a risky IT project in 2008 that then went over budget and resulted in the firing of Hydro’s chief information officer.

The commission spent two years investigating. Its report outlined how B.C. Hydro split the IT project into smaller components to avoid scrutiny, failed to produce the proper planning document when asked, didn’t disclose cost increases of up to $38 million, reflecting pressures seen at Manitoba Hydro's debt across the sector, gave incomplete testimony and did not quickly correct the record when it realized the mistakes.

“Essentially all of the things I asserted were substantiated, and so I’m pleased,” Dix, who is now minister of health, said on Monday. “I think ratepayers can be pleased with it, because even though it was an elaborate process, it involves hundreds of millions of spending by a public utility and it clearly required oversight.”

The BCUC stopped short of agreeing with Dix’s allegation that the errors were deliberate. Instead it pointed toward a culture at B.C. Hydro of confusion, misunderstanding and fear of dealing with the independent regulatory process.

“Therefore, the panel finds that there was a culture of reticence to inform the BCUC when there was doubt about something, even among individuals that understood or should have understood the role of the BCUC, a pattern that can fuel Hydro One investor concerns in comparable markets,” read the report.

“Because of this doubt and uncertainty among B.C. Hydro staff, the panel finds no evidence to support a finding that the BCUC was intentionally misled. The panel finds B.C. Hydro’s culture of reticence to be inappropriate.”

By law, B.C. Hydro is supposed to get approval by the commission for rate changes and major expenditures. Its officials are often put under oath when providing information.

B.C. Hydro apologized for its conduct in 2016. The Crown corporation said Monday it supports the commission’s findings and has made improvements to management of IT projects, including more rigorous business case analyses.

“We participated fully in the commission’s process and acknowledged throughout the inquiry that we could have performed better during the regulatory hearings in 2008,” said spokesperson Tanya Fish.

“Since then, we have taken steps to ensure we meet the highest standards of openness and transparency during regulatory proceedings, including implementing a (thorough) awareness program to support staff in providing transparent and accurate testimony at all times during a regulatory process.”

The Ministry of Energy, which is responsible for B.C. Hydro, said in a statement it accepts all of the BCUC recommendations and will include the findings as part of a review it is conducting into Hydro’s operations and finances, including its deferred operating costs for context, and regulatory oversight.

Dix, who is now grappling with complex IT project management in his Health Ministry, said the lessons learned by B.C. Hydro and outlined in the report are important.

“I think the report is useful reading on all those scores,” he said. “It’s a case study in what shouldn’t happen in a major IT project.”


Related News

View more

Brazilian electricity workers call for 72-hour strike

Eletrobras Privatization Strike sparks a 72-hour CNE walkout by Brazil's electricity workers, opposing asset sell-offs and grid privatization while pledging essential services; unions target President Wilson Ferreira Jr. over energy-sector reforms.


Key Points

A 72-hour CNE walkout by Brazil's electricity workers opposing Eletrobras sell-offs, while keeping essential services.

✅ 72-hour strike led by CNE unions and federations

✅ Targets privatization plans and leadership at Eletrobras

✅ Essential services maintained to avoid consumer impact


Brazil's national electricity workers' collective (CNE) has called for a 72-hour strike to protest the privatization of state-run electric company Eletrobras and its subsidiaries.

The CNE, which gathers the electricity workers' confederation, federations, unions and associations, said the strike is to begin at Monday midnight (0300 GMT) and last through midnight Wednesday, even as some utilities elsewhere have considered asking staff to live on site to maintain operations.

Workers are demanding the ouster of Eletrobras President Wilson Ferreira Jr., who they say is the leading promoter of the privatization move.

Some 24,000 workers are expected to take part in the strike. However, the CNE said it will not affect consumers by ensuring essential services, a pledge echoed by utilities managing costs elsewhere such as Manitoba Hydro's unpaid days off during the pandemic.

#google#

Eletrobras accounts for 32 percent of Brazil's installed energy generation capacity, mainly via hydroelectric plants. Besides, it also operates nuclear and thermonuclear plants, and solar and wind farms, reflecting trends captured by young Canadians' interest in electricity jobs in recent years.

The company distributes electricity in six northern and northeastern states, and handles 47 percent of the nation's electricity transmission lines, even as a U.S. grid pandemic warning has highlighted reliability risks.

The government owns a 63-percent stake in the company, a reminder that public policy shapes the sector, similar to Canada's future-of-work investment initiatives announced recently.


Related News

View more

Energy Department Announces 20 New Competitors for the American-Made Solar Prize

American-Made Solar Prize Round 3 accelerates DOE-backed solar innovation, empowering entrepreneurs and domestic manufacturing with photovoltaics and grid integration support via National Laboratories, incubators, and investors to validate products, secure funding, and deploy backup power.


Key Points

A DOE challenge fast-tracking solar innovation to market readiness, boosting US manufacturing and grid integration.

✅ $50,000 awards to 20 teams for prototype validation

✅ Access to National Labs, incubators, investors, and mentors

✅ Focus on PV advances and grid integration solutions


The U.S. Department of Energy (DOE) announced the 20 competitors who have been invited to advance to the next phase of the American-Made Solar Prize Round 3, a competition designed to incentivize the nation’s entrepreneurs to strengthen American leadership in solar energy innovation and domestic manufacturing, a key front in the clean energy race today.

The American-Made Solar Prize is designed to help more American entrepreneurs thrive in the competitive global energy market. Each round of the prize brings new technologies to pre-commercial readiness in less than a year, ensuring new ideas enter the marketplace. As part of the competition, teams will have access to a network of DOE National Laboratories, technology incubators and accelerators, and related DOE efforts like next-generation building upgrades, venture capital firms, angel investors, and industry. This American-Made Network will help these competitors raise private funding, validate early-stage products, or test technologies in the field.

Each team will receive a $50,000 cash prize and become eligible to compete in the next phase of the competition. Through a rigorous evaluation process, teams were chosen based on the novelty of their ideas and how their solutions address a critical need of the solar industry. The teams were selected from 120 submissions and represent 11 states. These projects will tackle challenges related to new solar applications, like farming, as well as show how solar can be used to provide backup power when the grid goes down, aided by increasingly affordable batteries now reaching scale. Nine teams will advance solar photovoltaic technologies, and 11 will address challenges related to how solar integrates with the grid. The projects are as follows:

Photovoltaics:

  • Durable Antireflective and Self-Cleaning Glass (Pittsburgh, PA)
  • Pursuit Solar - More Power, Less Hassle (Denver, NC)
  • PV WaRD (San Diego, CA)
  • Remotely Deployed Solar Arrays (Charlottesville, VA)
  • Robotics Changing the Landscape for Solar Farms (San Antonio, TX)
  • TrackerSled (Chicago, IL)
  • Transparent Polymer Barrier Films for PV (Bristol, PA)
  • Solar for Snow (Duluth, MN)
  • SolarWall Power Tower (Buffalo, NY)


Systems Integration:

  • Affordable Local Solar Storage via Utility Virtual Power Plants (Parker, TX)
  • Allbrand Solar Monitor (Detroit, MI)
  • Beyond Monitoring – Next Gen Software and Hardware (Atlanta, GA)
  • Democratizing Solar with Artificial Intelligence Energy Management (Houston, TX)
  • Embedded, Multi-Function Maximum Power Point Tracker for Smart Modules (Las Vegas, NV)
  • Evergrid: Keep Solar Flowing When the Grid Is Down (Livermore, CA)
  • Inverter Health Scan (San Jose, CA)
  • JuiceBox: Integrated Solar Electricity for Americans Transitioning out of Homelessness and Recovering from Natural Disasters (Claremont, CA)
  • Low-Cost Parallel-Connected DC Power Optimizer (Blacksburg, VA)
  • Powerfly: A Plug-and-Play Solar Monitoring Device (Berkeley, CA)
  • Simple-Assembly Storage Kit (San Antonio, TX)

Read the descriptions of the projects to see how they contribute to efforts to improve solar and wind power worldwide.

Over the next six months, these teams will fast-track their efforts to identify, develop, and test disruptive solutions amid record solar and storage growth projected nationwide. During a national demonstration day at Solar Power International in September 2020, a panel of judges will select two final winners who will receive a $500,000 prize. Learn more at the American-Made Solar Prize webpage.

The American-Made Challenges incentivize the nation's entrepreneurs to strengthen American leadership in energy innovation and domestic manufacturing. These new challenges seek to lower the barriers U.S.-based innovators face in reaching manufacturing scale by accelerating the cycles of learning from years to weeks while helping to create partnerships that connect entrepreneurs to the private sector and the network of DOE’s National Laboratories across the nation, alongside recent wind energy awards that complement solar innovation.

Go here to learn how this work aligns with a tenfold solar expansion being discussed nationally.

https://www.energy.gov/eere/solar/solar-energy-technologies-office


Related News

View more

PG&E Rates Set to Stabilize in 2025

PG&E 2024 Rate Hikes signal sharp increases to fund wildfire safety, infrastructure upgrades, and CPUC-backed reliability, with rates expected to stabilize in 2025, affecting rural residents, businesses, and high-risk zones across California.


Key Points

PG&E’s 2024 hikes fund wildfire safety and grid upgrades, with pricing expected to stabilize in 2025.

✅ Driven by wildfire safety, infrastructure, and reinsurance costs

✅ Largest impacts in rural, high-risk zones; business rates vary

✅ CPUC oversight aims to ensure necessary, justified investments


Pacific Gas and Electric (PG&E) is expected to implement a series of rate hikes that, amid analyses of why California electricity prices are soaring across the state, will significantly impact California residents. These increases, while substantial, are anticipated to be followed by a period of stabilization in 2025, offering a sense of relief to customers facing rising costs.

PG&E, one of the largest utility providers in the state, announced that its 2024 rate hikes are part of efforts to address increasing operational costs, including those related to wildfire safety, infrastructure upgrades, and regulatory requirements. As California continues to face climate-related challenges like wildfires, utilities like PG&E are being forced to adjust their financial models to manage the evolving risks. Wildfire-related liabilities, which have plagued PG&E in recent years, play a significant role in these rate adjustments. In response to previous fire-related lawsuits, including a bankruptcy plan supported by wildfire victims that reshaped liabilities, and the increased cost of reinsurance, PG&E has made it clear that customers will bear part of the financial burden.

These rate hikes will have a multi-faceted impact. Residential users, particularly those in rural or high-risk wildfire zones, will see some of the largest increases. Business customers will also be affected, although the adjustments may vary depending on the size and energy consumption patterns of each business. PG&E has indicated that the increases are necessary to secure the utility’s financial stability while continuing to deliver reliable service to its customers.

Despite the steep increases in 2024, PG&E's executives have assured that the company's pricing structure will stabilize in 2025. The utility has taken steps to balance the financial needs of the business with the reality of consumer affordability. While some rate hikes are inevitable given California's regulatory landscape and climate concerns, PG&E's leadership believes the worst of the increases will be seen next year.

PG&E’s anticipated stabilization comes after a year of scrutiny from California regulators. The California Public Utilities Commission (CPUC) has been working closely with PG&E to scrutinize its rate request and ensure that hikes are justifiable and used for necessary investments in infrastructure and safety improvements. The CPUC’s oversight is especially crucial given the company’s history of safety violations and the public outrage over past wildfire incidents, including reports that its power lines may have sparked fires in California, which have been linked to PG&E’s equipment.

The hikes, though significant, reflect the broader pressures facing utilities in California, where extreme weather patterns are becoming more frequent and intense due to climate change. Wildfires, which have grown in severity and frequency in recent years, have forced PG&E to invest heavily in fire prevention and mitigation strategies, including compliance with a judge-ordered use of dividends for wildfire mitigation across its service area. This includes upgrading equipment, inspecting power lines, and implementing more rigorous protocols to prevent accidents that could spark devastating fires. These investments come at a steep cost, which PG&E is passing along to consumers through higher rates.

For homeowners and businesses, the potential for future rate stabilization offers a glimmer of hope. However, the 2024 increases are still expected to hit consumers hard, especially those already struggling with high living costs. The steep hikes have prompted public outcry, with calls for action as bills soar amplifying advocacy group arguments that utilities should absorb more of the costs related to climate change and fire prevention instead of relying on ratepayers.

Looking ahead to 2025, the expectation is that PG&E’s rates will stabilize, but the question remains whether they will return to pre-2024 levels or continue to rise at a slower rate. Experts note that California’s energy market remains volatile, and while the rates may stabilize in the short term, long-term cost management will depend on ongoing investments in renewable energy sources and continued efforts to make the grid more resilient to climate-related risks.

As PG&E navigates this challenging period, the company’s commitment to transparency and working with regulators will be crucial in rebuilding trust with its customers. While the immediate future may be financially painful for many, the hope is that the utility's focus on safety and infrastructure will lead to greater long-term stability and fewer dramatic rate increases in the years to come.

Ultimately, California residents will need to brace for another tough year in terms of utility costs but can find reassurance that PG&E’s rate increases will eventually stabilize. For those seeking relief, there are ongoing discussions about increasing energy efficiency, exploring renewable energy alternatives, and expanding assistance programs for lower-income households to help mitigate the financial strain of these price hikes.


Related News

View more

Sign Up for Electricity Forum’s Newsletter

Stay informed with our FREE Newsletter — get the latest news, breakthrough technologies, and expert insights, delivered straight to your inbox.

Electricity Today T&D Magazine Subscribe for FREE

Stay informed with the latest T&D policies and technologies.
  • Timely insights from industry experts
  • Practical solutions T&D engineers
  • Free access to every issue

Live Online & In-person Group Training

Advantages To Instructor-Led Training – Instructor-Led Course, Customized Training, Multiple Locations, Economical, CEU Credits, Course Discounts.

Request For Quotation

Whether you would prefer Live Online or In-Person instruction, our electrical training courses can be tailored to meet your company's specific requirements and delivered to your employees in one location or at various locations.