NFPA 70b Training - Electrical Maintenance
Our customized live online or in‑person group training can be delivered to your staff at your location.

- Live Online
- 12 hours Instructor-led
- Group Training Available
Regular Price:
$699
Coupon Price:
$599
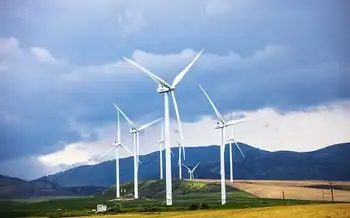
The U.S. added nearly 1,400 megawatts of wind energy capacity during the second quarter of 2008, providing enough electricity to power more than 400,000 homes, according to an industry report.
The American Wind Energy Association said new wind turbines this year will generate about 7,500 megawatts of additional electricity, far surpassing the 5,249 megawatts installed in 2007.
Wind power accounted for more than one-third of the new electric generating capacity installed in the U.S. in 2007, and the industry is projected to grow at a 45 percent pace for the second straight year, said Randall Swisher, the association's executive director.
"We're past the point of wind being a marginal player," Swisher said.
A financial bailout package passed by Congress and signed by President Bush provided an eight-year extension of investment tax credits for the solar industry but gave just a one-year extension of production tax credits for the wind industry.
Swisher said capital in the near term clearly will cost more and be more difficult to get, but other factors provide a bit of a silver lining. Transportation costs are continuing to come down, and steel prices have dropped significantly in the past few months. A wind turbine, by weight, is 89 percent steel, Swisher said.
Industry growth is also occurring on the manufacturing side.
Eight new wind turbine component manufacturing facilities opened in the U.S. this year, nine were expanded and 19 new facilities were announced, according to the trade group.
Swisher said governors from states such as Colorado and Iowa have worked hard to attract companies that build turbines, towers and blades to fuel their local economies.
"Wind will be one of the leading sources of new manufacturing jobs in the 21st century," he said. "And there are a bunch of governors that are starting to figure that out and are driving their own state economic development strategies to take advantage of that."
Related News
Cryptocurrency firm in Plattsburgh fights $1 million electric charge
Coinmint Plattsburgh Dispute spotlights cryptocurrency mining, hydropower electricity rates, a $1M security deposit, Public Service…
View more
DOE Announces $28M Award for Wind Energy
DOE Wind Energy Funding backs 13 R&D projects advancing offshore wind, distributed energy, and utility-scale…
View more
Ontario's Clean Electricity Regulations: Paving the Way for a Greener Future
Ontario Clean Electricity Regulations accelerate renewable energy adoption, drive emissions reduction, and modernize the smart…
View more
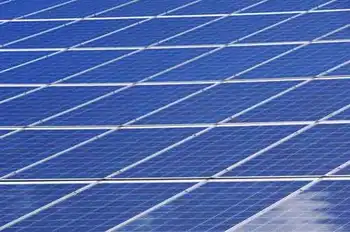
Energy-insecure households in the U.S. pay 27% more for electricity than others
Community Solar for Low-Income Homes expands energy equity by delivering renewable energy access, predictable bill…
View more
IAEA reactor simulators get more use during Covid-19 lockdown
IAEA Nuclear Reactor Simulators enable virtual nuclear power plant training on IPWR/PWR systems, load-following operations,…
View more
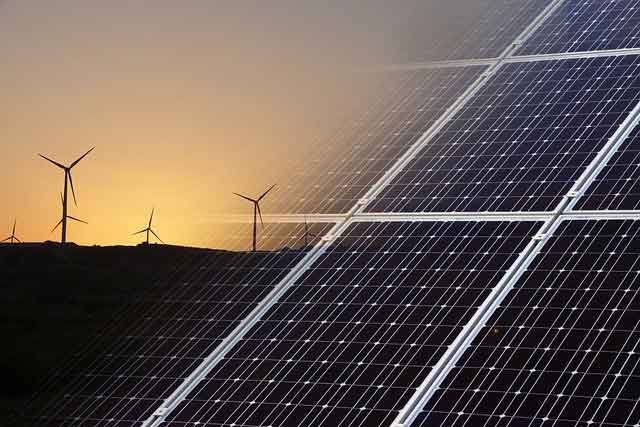
To Limit Climate Change, Scientists Try To Improve Solar And Wind Power
Wisconsin Solar and Wind Energy advances as rooftop solar, utility-scale farms, and NREL perovskite solar…
View more
Sign Up for Electricity Forum’s Newsletter
Stay informed with our FREE Newsletter — get the latest news, breakthrough technologies, and expert insights, delivered straight to your inbox.
Electricity Today T&D Magazine Subscribe for FREE

Stay informed with the latest T&D policies and technologies.
- Timely insights from industry experts
- Practical solutions T&D engineers
- Free access to every issue

