Electrically Smart Roads integrate solar road surfaces, inductive charging, IoT sensors, AI analytics, and V2X to power lighting, deicing, and monitoring, reducing grid dependence while enabling dynamic EV charging and real-time traffic management.
Key Points
Electrically smart roads generate power, sense conditions, and charge EVs using solar, IoT, AI, and dynamic infrastructure.
✅ Solar surfaces, verges, and gantries generate on-site electricity
✅ Inductive lanes enable dynamic EV charging at highway speeds
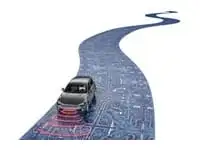
✅ Embedded IoT sensors and AI deliver real-time traffic insights
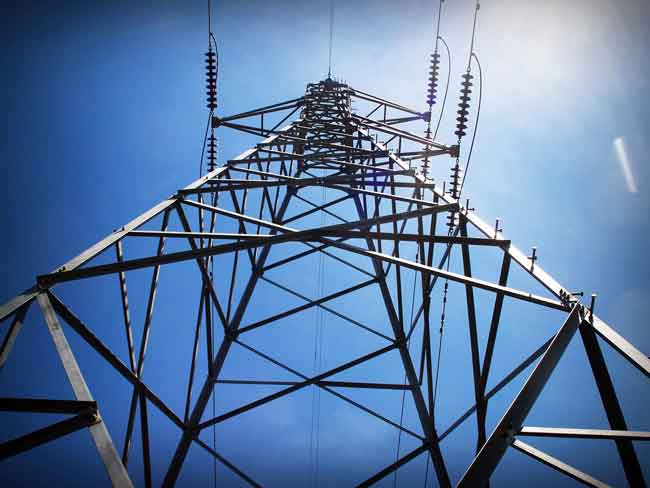
As more and more capabilities are added to roads instead of simply covering a country with extra roads, they are starting to make their own electricity, notably as solar road surface but then with added silent wind turbines, photovoltaic verges and barriers and more.
That toll gate, street light and traffic monitoring system all need electricity. Later, roads that deice and charge vehicles at speed will need huge amounts of electricity. For now, electricity for road systems is provided by very expensive infrastructure to the grid, and grid flexibility for EVs remains a concern, except for a few solar/ wind street lights in China and Korea for example. However, as more and more capabilities are added to roads instead of simply covering a country with extra roads, they are starting to make their own electricity, notably as solar road surface but then with added silent wind turbines, photovoltaic verges and barriers and more. There is also highly speculative work in the USA and UK on garnering power from road surface movement using piezoelectrics and electrodynamics and even its heat.
#google#
China plans to create an intelligent transport system by 2030. The country hopes to build smart roads that will not only be able to charge electric cars as they drive but also monitor temperature, traffic flow and weight load using artificial intelligence. Indeed, like France, the Netherlands and the USA, where U.S. EV charging capacity is under scrutiny, it already has trials of extended lengths of solar road which cost no more than regular roads. In an alternative approach, vehicles go under tunnels of solar panels that also support lighting, light-emitting signage and monitoring equipment using the electricity made where it is needed. See the IDTechEx Research report, Electrically Smart Roads 2018-2028 for more.
Raghu Das, CEO of IDTechEx says, "The spiral vertical axis wind turbines VAWT in Asia rarely rotate because they are too low but much higher versions are planned on large UK roadside vehicle charging centres that should work well. H shaped VAWT is also gaining traction - much slower and quieter than the propeller shape which vibrates and keeps you awake at night in an urban area.
The price gap between the ubiquitous polycrystalline silicon solar cell and the much more efficient single crystal silicon is narrowing. That means that road furniture such as bus shelters and smart gantries will likely go for more solar rather than adding wind power in many cases, a shift mirrored by connected solar tech in homes, because wind power needs a lot of maintenance and its price is not dropping as rapidly."
The IDTechEx Research report, Off Grid Electric Vehicle Charging: Zero Emission 2018-2028 analyses that aspect, while vehicle-to-grid strategies may complement grid resources. The prototype of a smart road is already in place on an expressway outside of Jinan, providing better traffic updates as well as more accurate mapping. Verizon's IoT division has launched a project around intelligent asphalt, which it thinks has the potential to significantly reduce fossil fuel emissions and save time by reducing up to 44% of traffic backups. It has partnered with Sacramento, California, to test this theory.
"By embedding sensors into the pavement as well as installing cameras on traffic lights, we will be able to study and analyze the flow of traffic. Then, we will take all of that data and use it to optimize the timing of lights so that traffic flows easier and travel times are shorter," explains Sean Harrington, vice president of Verizon Smart Communities.
Colorado's Department of Transportation has recently announced its intention to be the first state to pilot smart roads by striking a five-year deal with a smart road company to test the technology. Like planned auto-deicing roads elsewhere, the aim of this project is, first and foremost, to save lives. The technology will detect when a car suddenly leaves a road and send emergency assistance to the area. The IDTechEx Research report Electrically Smart Roads 2018-2028 describes how others work on real time structural monitoring of roads and embedded interactive lighting and road surface signage.
"Smart pavement can make that determination and send that information directly into a vehicle," Peter Kozinski, director of CDOT's RoadX division, tells the Denver Post. "Data is the new asphalt of transportation." Sensors, processors and other technology are embedded in the Colorado road to extend capability beyond accidents and reach into better road maintenance. Fast adoption relies on the ability to rapidly install sensor-laden pavement or lay concrete slabs. Attention therefore turns to fast adaptation of existing roads. Indeed, even for the heavy coil arrays used for dynamic vehicle charging, even as state power grids face new challenges, in Israel there are machines that can retrofit into the road surface at a remarkable two kilometres of cut and insert in a day.
"It's hard to imagine that these things are inexpensive, with all the electronics in them," Charles Schwartz, a professor of civil and environmental engineering at the University of Maryland, tells the Denver Post concerning the vehicle sensing project, "but CDOT is a fairly sophisticated agency, and this is an interesting pilot project. We can learn a lot, even if the test is only partially successful."
Related News