Germany Hydrogen Import Strategy outlines reliance on green hydrogen imports, expanded electrolysis capacity, IPCEI-funded pipelines, and industrial decarbonization for steel and chemicals to reach climate-neutral goals by 2045, meeting 2030 demand of 95-130 TWh.
Key Points
A plan to import 50-70% of hydrogen by 2030, backing green hydrogen, electrolysis, pipelines, and decarbonization.
✅ Imports cover 50-70% of 2030 hydrogen demand
✅ 10 GW electrolysis target with state aid and IPCEI
✅ 1,800 km H2 pipelines to link hubs by 2030
Germany will have to import up to 70% of its hydrogen demand in the future as Europe's largest economy aims to become climate-neutral by 2045, an updated government strategy published on Wednesday showed.
The German cabinet approved a new hydrogen strategy, setting guidelines for hydrogen production, transport infrastructure and market plans.
Germany is seeking to expand reliance on hydrogen as a future energy source to bolster energy resilience and cut greenhouse emissions for highly polluting industrial sectors that cannot be electrified such as steel and chemicals and cut dependency on imported fossil fuel.
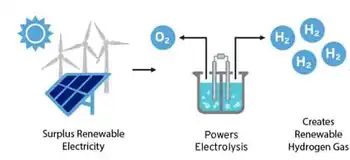
Produced using solar and wind power, green hydrogen is a pillar of Berlin's plan to build a sustainable electric planet and transition away from fossil fuels.
But even with doubling the country's domestic electrolysis capacity target for 2030 to at least 10 gigawatts (GW), Germany will need to import around 50% to 70% of its hydrogen demand, forecast at 95 to 130 TWh in 2030, the strategy showed.
"A domestic supply that fully covers demand does not make economic sense or serve the transformation processes resulting from the energy transition and the broader global energy transition overall," the document said.
The strategy underscores the importance of diversifying future hydrogen sources, including potential partners such as Canada's clean hydrogen sector, but the government is working on a separate strategy for hydrogen imports whose exact date is not clear, a spokesperson for the economy ministry said.
"Instead of relying on domestic potential for the production of green hydrogen, the federal government's strategy is primarily aimed at imports by ship," Simone Peter, the head of Germany's renewable energy association, said.
Under the strategy, state aid is expected to be approved for around 2.5 GW of electrolysis projects in Germany this year and the government will earmark 700 million euros ($775 million) for hydrogen research to optimise production methods, research minister Bettina Stark-Watzinger said.
But Germany's limited renewable energy space will make it heavily dependent on imported hydrogen from emerging export hubs such as Abu Dhabi hydrogen exports gaining scale, experts say.
"Germany is a densely populated country. We simply need space for wind and photovoltaic to be able to produce the hydrogen," Philipp Heilmaier, an energy transition researcher at Germany energy agency, told Reuters.
The strategy allows the usage of hydrogen produced through fossil energy sources preferably if the carbon is split off, but said direct government subsidies would be limited to green hydrogen.
Funds for launching a hydrogen network with more than 1,800 km of pipelines in Germany are expected to flow by 2027/2028 through the bloc's Important Projects of Common European Interest (IPCEI) financing scheme, as the EU plans to double electricity use by 2050 could raise future demand, with the goal of connecting all major generation, import and storage centres to customers by 2030.
Transport Minister Volker Wissing said his ministry was working on plans for a network of hydrogen filling stations and for renewable fuel subsidies.
Environmental groups said the strategy lacked binding sustainability criteria and restriction on using hydrogen for sectors that cannot be electrified instead of using it for private heating or in cars, calling for a plan to eventually phase-out blue hydrogen which is produced from natural gas.
Germany has already signed several hydrogen cooperation agreements with countries such as clean energy partnership with Canada and Norway, United Arab Emirates and Australia.
Related News