Hydrogen Energy Transition advances renewable energy integration via electrolysis, carbon capture and storage, and gas hybrids to decarbonize industry, steel, and transport, enable grid storage, replace ammonia feedstocks, and export clean power across continents.
Key Points
Scaling clean hydrogen with renewables and CCS to cut emissions in power and industry, and enable clean transport.
✅ Electrolysis and CCS provide low-emission hydrogen at scale.
✅ Balances renewables with storage and flexible gas assets.
✅ Decarbonizes steel, ammonia, heavy transport, and exports.
I want you to imagine a highway exclusively devoted to delivering the world’s energy. Each lane is restricted to trucks that carry one of the world’s seven large-scale sources of primary energy: coal, oil, natural gas, nuclear, hydro, solar and wind.
Our current energy security comes at a price, as Europe's power crisis shows, the carbon dioxide emissions from the trucks in the three busiest lanes: the ones for coal, oil and natural gas.
We can’t just put up roadblocks overnight to stop these trucks; they are carrying the overwhelming majority of the world’s energy supply.
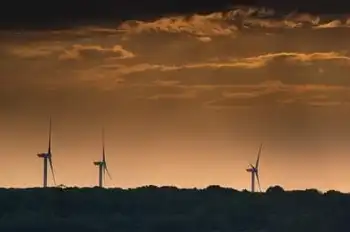
But what if we expand clean electricity production carried by the trucks in the solar and wind lanes — three or four times over — into an economically efficient clean energy future?
Think electric cars instead of petrol cars. Think electric factories instead of oil-burning factories. Cleaner and cheaper to run. A technology-driven orderly transition. Problems wrought by technology, solved by technology.
Read more: How to transition from coal: 4 lessons for Australia from around the world
Make no mistake, this will be the biggest engineering challenge ever undertaken. The energy system is huge, and even with an internationally committed and focused effort the transition will take many decades.
It will also require respectful planning and retraining to ensure affected individuals and communities, who have fuelled our energy progress for generations, are supported throughout the transition.
As Tony, a worker from a Gippsland coal-fired power station, noted from the audience on this week’s Q+A program:
The workforce is highly innovative, we are up for the challenge, we will adapt to whatever is put in front of us and we have proven that in the past.
This is a reminder that if governments, industry, communities and individuals share a vision, a positive transition can be achieved.
The stunning technology advances I have witnessed in the past ten years, such as the UK's green industrial revolution shaping the next waves of reactors, make me optimistic.
Renewable energy is booming worldwide, and is now being delivered at a markedly lower cost than ever before.
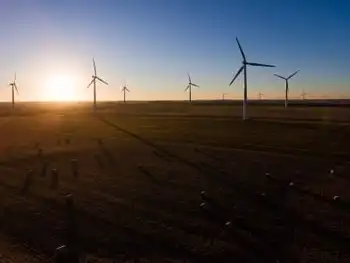
In Australia, the cost of producing electricity from wind and solar is now around A$50 per megawatt-hour.
Even when the variability is firmed with grid-scale storage solutions, the price of solar and wind electricity is lower than existing gas-fired electricity generation and similar to new-build coal-fired electricity generation.
This has resulted in substantial solar and wind electricity uptake in Australia and, most importantly, projections of a 33% cut in emissions in the electricity sector by 2030, when compared to 2005 levels.
And this pricing trend will only continue, with a recent United Nations report noting that, in the last decade alone, the cost of solar electricity fell by 80%, and is set to drop even further.
So we’re on our way. We can do this. Time and again we have demonstrated that no challenge to humanity is beyond humanity.
Ultimately, we will need to complement solar and wind with a range of technologies such as high levels of storage, including gravity energy storage approaches, long-distance transmission, and much better efficiency in the way we use energy.
But while these technologies are being scaled up, we need an energy companion today that can react rapidly to changes in solar and wind output. An energy companion that is itself relatively low in emissions, and that only operates when needed.
In the short term, as Prime Minister Scott Morrison and energy minister Angus Taylor have previously stated, natural gas will play that critical role.
In fact, natural gas is already making it possible for nations to transition to a reliable, and relatively low-emissions, electricity supply.
Look at Britain, where coal-fired electricity generation has plummeted from 75% in 1990 to just 2% in 2019.
Driving this has been an increase in solar, wind, and hydro electricity, up from 2% to 27%. At the same time, and this is key to the delivery of a reliable electricity supply, electricity from natural gas increased from virtually zero in 1990 to more than 38% in 2019.
I am aware that building new natural gas generators may be seen as problematic, but for now let’s assume that with solar, wind and natural gas, we will achieve a reliable, low-emissions electricity supply.
Is this enough? Not really.
We still need a high-density source of transportable fuel for long-distance, heavy-duty trucks.
We still need an alternative chemical feedstock to make the ammonia used to produce fertilisers.
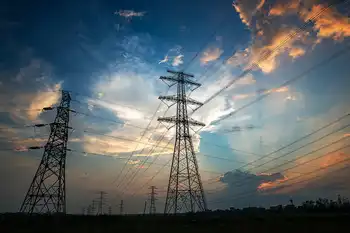
We still need a means to carry clean energy from one continent to another.
Enter the hero: hydrogen.
Hydrogen could fill the gaps in our energy needs. Julian Smith/AAP Image
Hydrogen is abundant. In fact, it’s the most abundant element in the Universe. The only problem is that there is nowhere on Earth that you can drill a well and find hydrogen gas.
Don’t panic. Fortunately, hydrogen is bound up in other substances. One we all know: water, the H in H₂O.
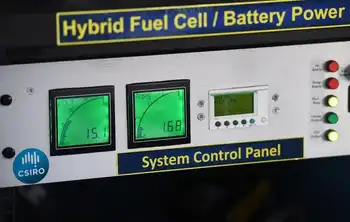
We have two viable ways to extract hydrogen, with near-zero emissions.
First, we can split water in a process called electrolysis, using renewable electricity or heat and power from nuclear beyond electricity options.
Second, we can use coal and natural gas to split the water, and capture and permanently bury the carbon dioxide emitted along the way.
I know some may be sceptical, because carbon capture and permanent storage has not been commercially viable in the electricity generation industry.
But the process for hydrogen production is significantly more cost-effective, for two crucial reasons.
First, since carbon dioxide is left behind as a residual part of the hydrogen production process, there is no additional step, and little added cost, for its extraction.
And second, because the process operates at much higher pressure, the extraction of the carbon dioxide is more energy-efficient and it is easier to store.
Returning to the electrolysis production route, we must also recognise that if hydrogen is produced exclusively from solar and wind electricity, we will exacerbate the load on the renewable lanes of our energy highway.
Think for a moment of the vast amounts of steel, aluminium and concrete needed to support, build and service solar and wind structures. And the copper and rare earth metals needed for the wires and motors. And the lithium, nickel, cobalt, manganese and other battery materials needed to stabilise the system.
It would be prudent, therefore, to safeguard against any potential resource limitations with another energy source.
Well, by producing hydrogen from natural gas or coal, using carbon capture and permanent storage, we can add back two more lanes to our energy highway, ensuring we have four primary energy sources to meet the needs of the future: solar, wind, hydrogen from natural gas, and hydrogen from coal.
Read more: 145 years after Jules Verne dreamed up a hydrogen future, it has arrived
Furthermore, once extracted, hydrogen provides unique solutions to the remaining challenges we face in our future electric planet.
First, in the transport sector, Australia’s largest end-user of energy.
Because hydrogen fuel carries much more energy than the equivalent weight of batteries, it provides a viable, longer-range alternative for powering long-haul buses, B-double trucks, trains that travel from mines in central Australia to coastal ports, and ships that carry passengers and goods around the world.
Second, in industry, where hydrogen can help solve some of the largest emissions challenges.
Take steel manufacturing. In today’s world, the use of coal in steel manufacturing is responsible for a staggering 7% of carbon dioxide emissions.
Persisting with this form of steel production will result in this percentage growing frustratingly higher as we make progress decarbonising other sectors of the economy.
Fortunately, clean hydrogen can not only provide the energy that is needed to heat the blast furnaces, it can also replace the carbon in coal used to reduce iron oxide to the pure iron from which steel is made. And with hydrogen as the reducing agent the only byproduct is water vapour.
This would have a revolutionary impact on cutting global emissions.
Third, hydrogen can store energy, as with power-to-gas in pipelines solutions not only for a rainy day, but also to ship sunshine from our shores, where it is abundant, to countries where it is needed.
Let me illustrate this point. In December last year, I was privileged to witness the launch of the world’s first liquefied hydrogen carrier ship in Japan.
As the vessel slipped into the water I saw it not only as the launch of the first ship of its type to ever be built, but as the launch of a new era in which clean energy will be routinely transported between the continents. Shipping sunshine.
And, finally, because hydrogen operates in a similar way to natural gas, our natural gas generators can be reconfigured in the future as hydrogen-ready power plants that run on hydrogen — neatly turning a potential legacy into an added bonus.
Hydrogen-powered economy
We truly are at the dawn of a new, thriving industry.
There’s a nearly A$2 trillion global market for hydrogen come 2050, assuming that we can drive the price of producing hydrogen to substantially lower than A$2 per kilogram.
In Australia, we’ve got the available land, the natural resources, the technology smarts, the global networks, and the industry expertise.
And we now have the commitment, with the National Hydrogen Strategy unanimously adopted at a meeting by the Commonwealth, state and territory governments late last year.
Indeed, as I reflect upon my term as Chief Scientist, in this my last year, chairing the development of this strategy has been one of my proudest achievements.
The full results will not be seen overnight, but it has sown the seeds, and if we continue to tend to them, they will grow into a whole new realm of practical applications and unimagined possibilities.
Related News