Outlook from solar companies disappoints investors

By Reuters


Substation Relay Protection Training

Our customized live online or in‑person group training can be delivered to your staff at your location.

  • Live Online
  • 12 hours Instructor-led
  • Group Training Available
Regular Price:
$699
Coupon Price:
$599
Reserve Your Seat Today
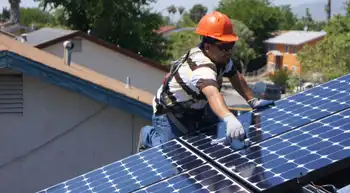
U.S. solar companies SunPower Corp and Akeena Solar Inc posted results that topped Wall Street estimates, but offered little hope the market for the renewable energy source would rebound this year.

The two companies said the solar sector was seeing a slow improvement, but also admitted the industry has yet to overcome the oversupply problems that have driven prices for panels down by about 50 percent in the past 12 months.

"The industry is seeing a much more balanced picture in demand and supply," said SunPower's chief executive, Tom Werner, in an interview.

SunPower, which posted lower net income and trimmed its full-year earnings forecast to the low end of its previous range, said the financing environment for solar projects was improving, and the average selling price fell less than 10 percent during the third quarter.

The company's forecast narrowed in part because some of its large-scale projects have moved into the early part of 2010, Werner said in an interview.

"The good news there is that we're still sold out and we go in with a very strong pipeline into 2010," Werner said, adding that the company is "better positioned" for the first quarter of 2010 than it was for the first quarter in 2009.

Werner also told reporters during a conference call he saw residential demand strengthening in all markets, but still expected average selling prices of panels to weaken in the fourth quarter.

SunPower shares tumbled 13 percent to $29.05 following the results in extended trade after closing at $33.30 on the Nasdaq.

Demand for systems that turn sunlight into electricity has taken a hit because of the global financial crisis and an oversupply of cells and modules caused by a cutback in Spanish subsidies.

Investors are also now fretting over how much and when Germany's government will cut aid to its solar industry, the world's top market.

Werner said SunPower has always prepared for a decline in solar aid in Germany but noted that Germany is a "great market" even with a change in the country's subsidy.

MEMC Electronic Materials Inc, which produces silicon wafers that are a key component in solar cells, swung to a larger-than-expected quarterly loss but said it saw sequential increase in demand.

MEMC said it expected nearly flat revenues during the fourth quarter as compared to the third — an outlook executives at the company said was conservative given the uncertainty over pricing.

The company's shares fell nearly 2 percent in after-market trading on the New York Stock Exchange.

MEMC also announced it plans to acquire privately held SunEdison, which designs, installs and finances solar systems for commercial customers.

Smaller solar power systems maker Akeena Solar Inc posted a narrower-than-expected third-quarter loss as it took advantage of lower panel prices and cheaper installation costs.

But shares of the company closed down nearly 2 percent after it said that installation results in the fourth quarter would likely be similar to those in the third quarter.

Akeena said net sales for the quarter fell 27 percent to $7.7 million, reflecting decline in commercial revenue due to the tight credit market and overall economic conditions.

Related News

NT Power Penalized $75,000 for Delayed Disconnection Notices

NT Power OEB Compliance Penalty highlights a $75,000 fine for improper disconnection notices, 14-day rule violations, process oversight failures, refunds, LEAP support, and corrective training to strengthen consumer protection and regulatory adherence in Ontario areas.


Key Points

A $75,000 OEB fine to NT Power for improper disconnection notices; refunds, LEAP support, and improved compliance.

✅ $75k administrative monetary penalty; $25k LEAP donation; refunds

✅ 870 notices misdated; 14-day rule training implemented

✅ 10 disconnects reconnected; $100 goodwill credits


The Ontario Energy Board recently ruled against Newmarket-Tay Power Distribution Ltd. (NT Power), fining them $75,000 for failing to issue timely disconnection notices to 870 customers between April and August 2022. These notices did not comply with the Ontario Energy Board's distribution system code, similar to standards reaffirmed in the OEB decision on Hydro One rates earlier this year, which mandates a minimum 14-day notice period before disconnection.

Out of the affected customers, ten had their electricity services disconnected, and six were additionally charged reconnection fees. However, NT Power has since reconnected all disconnected customers and refunded the reconnection fees, as confirmed by the Ontario Energy Board.

In response to these issues, NT Power has voluntarily accepted an assurance of compliance. This agreement stipulates that NT Power will pay a $75,000 administrative monetary penalty. Furthermore, they will make an additional payment of $25,000 to the Salvation Army's Northridge Community Church, which administers the Low-income Energy Assistance Program (LEAP) within NT Power's service area, aligning with broader efforts to reduce costs for industry highlighted by Canadian Manufacturers & Exporters recently, according to the association.

This is not the first time NT Power has faced compliance issues in this regard. The utility company admitted that this incident marks the second instance in three years where they failed to adhere to their disconnection-related obligations as outlined in the code, and sector governance debates, including the Manitoba Hydro board debate, underscore how oversight remains a national focus.

In a statement to NewmarketToday, NT Power acknowledged a similar issue three years ago when they were alerted to problems with their disconnection process. They promptly made adjustments to align their in-house procedures with the requirements of the Ontario Energy Board. Unfortunately, they neglected to implement a secondary check, leading to disconnect notices being dated a few days too early.

Alex Braletic, NT Power's Vice President of Engineering and Operation, clarified that no customers were actually disconnected prematurely, and debates over paying for electricity in India illustrate how enforcement challenges differ globally, but the issued letters contained inaccuracies. He added that NT Power has since instituted additional verification procedures to prevent such errors from occurring again.

The Ontario Energy Board emphasized that NT Power has assured them that corrective measures have been taken to ensure that their staff involved in the disconnection process receive proper training and management oversight, and recent market reactions such as Hydro One shares falling after leadership changes underscore the importance of strong governance to guarantee compliance with regulatory requirements.

Brian Hewson, Vice President of Consumer Protection and Industry Performance at the Ontario Energy Board, stated, referencing earlier Ontario rate reductions for businesses that complemented consumer protections, "As a result of the actions we have taken and NT Power’s assurance that it is aware of its obligations and has taken steps to improve its processes, consumers will be better protected."

Braletic encouraged NT Power's customers who are facing difficulties paying their electricity bills to reach out to their customer service department or visit their website. He emphasized that various programs and services are available to provide relief for bills, and amid ongoing Toronto Hydro impersonation scams customers should contact NT Power directly. NT Power is committed to collaborating with customers proactively and connecting them with assistance to avoid serving them with disconnection notices.

Furthermore, NT Power plans to send a letter to the ten affected customers and provide each of them with a $100 bill credit as a goodwill gesture.


Related News

View more

Sub-Saharan Africa has a huge electricity problem - but with challenge comes opportunity

Sub-Saharan Africa Energy Access faces critical deficits; SDG7, clean energy finance, off-grid solar, and microgrids drive electrification for health, education, and economy amid World Bank and IEA efforts to expand reliable, affordable power.


Key Points

Reliable, affordable power in sub-Saharan Africa via renewables, off-grid solar, and SDG7-led electrification.

✅ SDG7 targets universal, modern energy access by 2030

✅ Off-grid solar and microgrids boost rural electrification

✅ Health, education, and business depend on reliable power


Sub-Saharan Africa has an electricity problem. While the world as a whole has made great strides when it comes to providing access to electricity and moving toward universal electricity access worldwide (the world average is now 90 per cent with access, up from 83 per cent in 2010), southern and western African states still lag far behind.

According to Tracking SDG7: The Energy Progress Report, produced by a consortium of organisations including the World Bank, the International Energy Agency and the World Health Organization, 759 million people were without electricity in 2019 and threequarters of them were based in sub-Saharan Africa. At just seven per cent, South Sudan had the lowest access figures; Chad, Burundi and Malawi were only marginally higher. What’s more, due to a combination of factors, the situation is getting worse. In total, the region’s access deficit increased from 556 million people in 2010 to 570 million people in 2019.

These days, being without electricity has an impact on every sphere of life. The Covid-19 pandemic only served to put this into sharper relief. Intermittent electricity meant vaccination doses that rely on cold storage were impossible to deliver and, as more than 70 per cent of the health facilities in sub-Saharan Africa have no access to reliable electricity, the problem was vast. But even without a global pandemic, having no power stymies opportunity in every field, from education to economics.

French photojournalist Pascal Maitre, who has spent much of his career writing about sub-Saharan Africa, wanted to document the problems faced by people in areas with no electricity. He thought particularly carefully about the location for his project. ‘First, I was thinking I could take images in the Democratic Republic of the Congo,’ he says. ‘But then I thought that if you chose a place that has war, it’s logical that electricity won’t really work. So, instead, I wanted to find a place that is quite stable. I decided to go to Benin, where they have a democracy. It is a good example of a country that’s not in really bad shape but where they still have this problem. Also, I didn’t want to go to a place that is very remote, where it is normal not to have good service. So I decided to go to a place around 50 kilometres from the capital that you can get to by road.’

Maitre visited several villages in the region, as well as making trips to Chad and Senegal, and encountered the full range of limitations engendered by the power shortage. From teachers struggling to conduct lessons in the dark to midwives forced to work with only the weak light from a phone, the situation was clearly unacceptable. ‘People were very, very, very upset,’ he says. ‘I conducted a lot of interviews in different villages and lack of electricity touches education, economy, business, security and also emigration, because people have to move to big cities or maybe to Europe to get jobs.’

Where once the situation might have been accepted as the norm, people today are fully aware of the ways in which they are held back by the lack of power. As Maitre remembers: ‘A guy said to me one day, “Do you think it is normal that last time my wife delivered a baby, the midwife had to hold her phone between her teeth in order to see what she was doing?” You feel very frustrated.’ He adds that the fact that most people now have mobile phones only highlights the hardship. ‘Before, maybe it was not so frustrating. But now, most of these people have cellphones. The cellphone company puts antennae everywhere so the phones work, but people cannot recharge their phones. They have to go to the market, where someone will come with a generator to recharge.’

Governments and global organisations are very aware of the problem across the world as a whole. Sustainable Development Goal 7 (SDG7) – one of the 17 goals set out in 2015 by the United Nations General Assembly – was designed to ensure universal access to affordable, reliable, sustainable and modern energy by 2030, underscoring the push for clean, affordable and sustainable electricity for all by 2030. As part of this goal, international financial flows to developing countries in support of clean energy reached US$17 billion in 2018. As a result, some areas have seen huge improvement. According to the Energy Progress Report, in Latin America and the Caribbean, and in Eastern and South-Eastern Asia, the advance of electrification has been enough to approach universal access. By 2019, in Western Asia and North Africa, and Central and South Asia, 94 and 95 per cent of the population respectively had access to electricity.

But these statistics only serve to emphasise just how bad the situation is in sub-Saharan Africa, where electricity systems are unlikely to go green this decade according to several analyses. As the report states: ‘While renewable energy has demonstrated remarkable resilience during the pandemic, the unfortunate fact is that gains in energy access throughout Africa are being reversed: the number of people lacking access to electricity is set to increase in 2020, making basic electricity services unaffordable for up to 30 million people who had previously enjoyed access.’

The small silver lining is that if the situation is dealt with properly, the region could build a renewable-energy system from the ground up, rather than having to undergo the costly and complex transitions underway in developed countries. In rural areas, small-scale or off-grid renewable systems (mostly solar) are expected to play an important role, as highlighted by a recent IRENA report on decarbonisation, in increasing access. In fact, solar panels are already used in many areas. In 2019, 105 million people had access to off-grid solar solutions, up from 85 million in 2016, and almost half lived in sub-Saharan Africa, with 17 million in Kenya and eight million in Ethiopia.

Rachel Kyte is currently serving as the 14th dean of the Fletcher School at Tufts University in the USA, but her CV is long. She was previously CEO of the UN-affiliated Sustainable Energy for All (SeforALL), as well as the World Bank Group vice president and special envoy for climate change, leading the run-up to the Paris Agreement. According to her, a focus on renewables is absolutely essential, both for wider efforts to tackle climate change, with some advocating a fossil fuel lockdown to drive a climate revolution, but also for the people of sub-Saharan Africa. ‘The fossil fuel industry has said it will just extend the centralised fossil-fuel power systems that we have today to reach these people,’ she says.


Related News

View more

US January power generation jumps 9.3% on year: EIA

US January power generation climbed to 373.2 TWh, EIA data shows, with coal edging natural gas, record wind output, record nuclear generation, rising hydro, and stable utility-scale solar amid higher Henry Hub prices.


Key Points

US January power generation hit 373.2 TWh; coal led gas, wind and nuclear set records, with solar edging higher.

✅ Coal 31.8% share; gas 29.4%; coal output 118.7 TWh, gas 109.6 TWh.

✅ Wind hit record 26.8 TWh; nuclear record 74.6 TWh.

✅ Total generation 373.2 TWh, highest January since 2014.


The US generated 373.2 TWh of power in January, up 7.9% from 345.9 TWh in December and 9.3% higher than the same month in 2017, Energy Information Administration data shows.

The monthly total was the highest amount in January since 377.3 TWh was generated in January 2014.

Coal generation totaled 118.7 TWh in January, up 11.4% from 106.58 TWh in December and up 2.8% from the year-ago month, consistent with projections of a coal-fired generation increase for the first time since 2014. It was also the highest amount generated in January since 132.4 TWh in 2015.

For the second straight month, more power was generated from coal than natural gas, as 109.6 TWh came from gas, up 3.3% from 106.14 TWh in December and up 19.9% on the year.

However, the 118.7 TWh generated from coal was down 9.6% from the five-year average for the month, due to the higher usage of gas and renewables and a rising share of non-fossil generation in the overall mix.

#google#

Coal made up 31.8% of the total US power generation in January, up from 30.8% in December but down from 33.8% in January 2017.

Gas` generation share was at 29.4% in the latest month, with momentum from record gas-fired electricity earlier in the period, down from 30.7% in December but up from 26.8% in the year-ago month.

In January, the NYMEX Henry Hub gas futures price averaged $3.16/MMBtu, up 13.9% from $2.78/MMBtu averaged in December but down 4% from $3.29/MMBtu averaged in the year-ago month.


WIND, NUCLEAR GENERATION AT RECORD HIGHS

Wind generation was at a record-high 26.8 TWh in January, up 29.3% from 22.8 TWh in December and the highest amount on record, according to EIA data going back to January 2001. Wind generated 7.2% of the nation`s power in January, as an EIA summer outlook anticipates larger wind and solar contributions, up from 6.6% in December and 6.1% in the year-ago month.

Utility-scale solar generated 3.3 TWh in January, up 1.3% from 3.1 TWh in December and up 51.6% on the year. In January, utility-scale solar generation made up 0.9% of US power generation, during a period when solar and wind supplied 10% of US electricity in early 2018, flat from December but up from 0.6% in January 2017.

Nuclear generation was also at a record-high 74.6 TWh in January, up 1.3% month on month and the highest monthly total since the EIA started tracking it in January 2001, eclipsing the previous record of 74.3 TWh set in July 2008. Nuclear generation made up 20% of the US power in January, down from 21.3% in December and 21.4% in the year-ago month.

Hydro power totaled 25.4 TWh in January, making up 6.8% of US power generation during the month, up from 6.5% in December but down from 8.2% in January 2017.


Related News

View more

Hydro One delivery rates go up

Hydro One Rate Hike reflects Ontario Energy Board approval for higher delivery charges, impacting seasonal customers more than residential classes, funding infrastructure upgrades like wood pole and transformer replacements across Ontario's medium-density service areas.


Key Points

The Hydro One rate hike is an OEB-approved delivery charge increase to fund upgrades, with impacts on seasonal users.

✅ OEB-approved delivery rate increases retroactive to 2018

✅ Seasonal customers see larger monthly bill impacts than residential

✅ Funds pole, transformer replacements and tree trimming work


Hydro One seasonal customers will face bigger increases in their bills than the utility's residential customers as a result of an Ontario Energy Board approval of a rate hike, a topic drawing attention from a utilities watchdog in other provinces as well.

Hydro One received permission to increase its delivery charge, as large projects like the Meaford hydro generation proposal are considered across Ontario, retroactive to last year.

It says it needs the money to maintain and upgrade its infrastructure, including efforts to adapt to climate change, much of which was installed in the 1950s.

The utility is notifying customers that new statements reflect higher delivery rates which were not charged in 2018 and the first half of this year, due to delay in receiving the OEB's permission, similar to delays that can follow an energy board recommendation in other jurisdictions.

The amount that customers' bills will increase by depends not only on how much electricity they use, but also on which rate class they belong to, as well as policy decisions affecting remote connections such as the First Nations electricity line in northern Ontario.

For seasonal customers such as summer cottage owners, the impact on a typical user's bill will be 2.9 per cent more per month for 2018, and 1.7 per cent per month for 2019.

There will be further increases of 1.0 per cent, 1.4 per cent and 1.1 per cent per month in 2020, 2021 and 2022 respectively. 

Typical residential customers will experience smaller increases or rate freezes over the same period.

In the residential medium density class, the rate changes are a 2.0 per cent increase for last year, a decrease of 0.5 per cent this year, and an increase of 0.5 per cent in 2021. There will be no increases in 2020 and 2022.


Seasonal Rate Class — Estimated bill impact per month

2018 - 2.9 %

2019 - 1.7%

2020 - 1.0%

2021 - 1.4%

2022 - 1.1%


Residential Medium Density Rate Class — Estimated bill impact per month

2018 - 2.0%

2019 - -0.5% decrease

2020 - 0.0%

2021 - 0.5%

2022 - 0.0%

A Hydro One spokesperson told tbnewswatch.com that over the next three years, the utility's upgrading plan includes reliability investments such as replacing more than 24,000 wood poles across the province as well as numerous transformers.

In the Thunder Bay area, the spokesperson said, some of the revenue generated by the higher delivery rates will cover the cost of replacing more than 180 poles and trimming hazardous trees around 3,200 kilometres of overhead power lines while sharing electrical safety tips with customers.


Related News

View more

Which of the cleaner states imports dirty electricity?

Hourly Electricity Emissions Tracking maps grid balancing areas, embodied emissions, and imports/exports, revealing carbon intensity shifts across PJM, ERCOT, and California ISO, and clarifying renewable energy versus coal impacts on health and climate.


Key Points

An hourly method tracing generation, flows, and embodied emissions to quantify carbon intensity across US balancing areas.

✅ Hourly traces of imports/exports and generation mix

✅ Consumption-based carbon intensity by balancing area

✅ Policy insights for renewables, coal, health costs


In the United States, electricity generation accounts for nearly 30% of our carbon emissions. Some states have responded to that by setting aggressive renewable energy standards; others are hoping to see coal propped up even as its economics get worse. Complicating matters further is the fact that many regional grids are integrated, and as America goes electric the stakes grow, meaning power generated in one location may be exported and used in a different state entirely.

Tracking these electricity exports is critical for understanding how to lower our national carbon emissions. In addition, power from a dirty source like coal has health and environment impacts where it's produced, and the costs of these aren't always paid by the parties using the electricity. Unfortunately, getting reliable figures on how electricity is produced and where it's used is challenging, even for consumers trying to find where their electricity comes from in the first place, leaving some of the best estimates with a time resolution of only a month.

Now, three Stanford researchers—Jacques A. de Chalendar, John Taggart, and Sally M. Benson—have greatly improved on that standard, and they have managed to track power generation and use on an hourly basis. The researchers found that, of the 66 grid balancing areas within the United States, only three have carbon emissions equivalent to our national average, and they have found that imports and exports of electricity have both seasonal and daily changes. de Chalendar et al. discovered that the net results can be substantial, with imported electricity increasing California's emissions/power by 20%.

Hour by hour
To figure out the US energy trading landscape, the researchers obtained 2016 data for grid features called balancing areas. The continental US has 66 of these, providing much better spatial resolution on the data than the larger grid subdivisions. This doesn't cover everything—several balancing areas in Canada and Mexico are tied in to the US grid—and some of these balancing areas are much larger than others. The PJM grid, serving Pennsylvania, New Jersey, and Maryland, for example, is more than twice as large as Texas' ERCOT, in a state that produces and consumes the most electricity in the US.

Despite these limitations, it's possible to get hourly figures on how much electricity was generated, what was used to produce it, and whether it was used locally or exported to another balancing area. Information on the generating sources allowed the researchers to attach an emissions figure to each unit of electricity produced. Coal, for example, produces double the emissions of natural gas, which in turn produces more than an order of magnitude more carbon dioxide than the manufacturing of solar, wind, or hydro facilities. These figures were turned into what the authors call "embodied emissions" that can be traced to where they're eventually used.

Similar figures were also generated for sulfur dioxide and nitrogen oxides. Released by the burning of fossil fuels, these can both influence the global climate and produce local health problems.

Huge variation
The results were striking. "The consumption-based carbon intensity of electricity varies by almost an order of magnitude across the different regions in the US electricity system," the authors conclude. The low is the Bonneville Power grid region, which is largely supplied by hydropower; it has typical emissions below 100kg of carbon dioxide per megawatt-hour. The highest emissions come in the Ohio Valley Electric region, where emissions clear 900kg/MW-hr. Only three regional grids match the overall grid emissions intensity, although that includes the very large PJM (where capacity auction payouts recently fell), ERCOT, and Southern Co balancing areas.

Most of the low-emissions power that's exported comes from the Pacific Northwest's abundant hydropower, while the Rocky Mountains area exports electricity with the highest associated emissions. That leads to some striking asymmetries. Local generation in the hydro-rich Idaho Power Company has embodied emissions of only 71kg/MW-hr, while its imports, coming primarily from Rocky Mountain states, have a carbon content of 625kg/MW-hr.

The reliance on hydropower also makes the asymmetry seasonal. Local generation is highest in the spring as snow melts, but imports become a larger source outside this time of year. As solar and wind can also have pronounced seasonal shifts, similar changes will likely be seen as these become larger contributors to many of these regional grids. Similar things occur daily, as both demand and solar production (and, to a lesser extent, wind) have distinct daily profiles.

The Golden State
California's CISO provides another instructive case. Imports represent less than 30% of its total electric use in 2016, yet California electricity imports provided 40% of its embodied emissions. Some of these, however, come internally from California, provided by the Los Angeles Department of Water and Power. The state itself, however, has only had limited tracking of imported emissions, lumping many of its sources as "other," and has been exporting its energy policies to Western states in ways that shape regional markets.

Overall, the 2016 inventory provides a narrow picture of the US grid, as plenty of trends are rapidly changing our country's emissions profile, including the rise of renewables and the widespread adoption of efficiency measures and other utility trends in 2017 that continue to evolve. The method developed here can, however, allow for annual updates, providing us with a much better picture of trends. That could be quite valuable to track things like how the rapid rise in solar power is altering the daily production of clean power.

More significantly, it provides a basis for more informed policymaking. States that wish to promote low-emissions power can use the information here to either alter the source of their imports or to encourage the sites where they're produced to adopt more renewable power. And those states that are exporting electricity produced primarily through fossil fuels could ensure that the locations where the power is used pay a price that includes the health costs of its production.


Related News

View more

Toronto Cleans Up After Severe Flooding

Toronto Flood Cleanup details the citywide response to storm damage after heavy rain, stressing drainage system upgrades, emergency services, transit disruptions, infrastructure repair, financial aid, insurance claims, and climate resilience planning for future weather.


Key Points

Toronto Flood Cleanup is the city's flood response, restoring infrastructure, aiding residents, and upgrading drainage.

✅ Emergency services and public works lead debris removal.

✅ Repairs to roads, bridges, transit, and utilities underway.

✅ Aid, insurance claims, and drainage upgrades prioritized.


Toronto is grappling with significant cleanup efforts following severe storms that unleashed heavy rains and caused widespread flooding across the city. The storms, which hit the area over the past week, have left a trail of damage and disruption, prompting both immediate response measures and longer-term recovery plans.

The intense rainfall began with a powerful storm system that moved through southern Ontario, with Sudbury Hydro crews working to reconnect service as the system pressed toward the GTA, delivering an unprecedented volume of water in a short period. The resulting downpours overwhelmed the city's drainage systems, leading to severe flooding in multiple neighborhoods. Streets, basements, and parks were inundated, with many areas experiencing water levels not seen in recent memory.

Emergency services were quickly mobilized to address the immediate impact of the floods. Toronto’s Fire Services, along with other first responders and skilled utility teams, as Ontario recently sent 200 workers to Florida to help restore power, were deployed to assist residents affected by the rising waters. Rescue operations were carried out to help people trapped in their homes or vehicles, and temporary shelters were set up for those displaced by the flooding.

The storm's impact was felt across various sectors of the city. Public transportation services were disrupted, as strong gusts led to significant power outages in parts of the region, with numerous subway stations and bus routes affected by the high water levels. Major roads were closed due to flooding, causing significant traffic delays and affecting daily commutes for many residents. Local businesses also faced challenges, with some forced to close their doors as a result of the water damage.

The city's infrastructure bore the brunt of the storm's fury. Several key infrastructure components, including roads, bridges, and utilities, suffered damage. The city's water treatment plants and sewage systems were stressed by the volume of water, raising concerns about potential contamination and the need for extensive maintenance and repair work.

In the wake of the flooding, the Toronto Municipal Government has launched a comprehensive cleanup and recovery effort. The city's Public Works Department is spearheading the operation, focusing on clearing debris, repairing damaged infrastructure, and restoring essential services, as Hydro One crews restore power to hundreds of thousands across Ontario. Teams of workers are diligently addressing the damage to roads and bridges, ensuring that they are safe for use and functioning properly.

Efforts are also underway to assist residents and businesses affected by the flooding. Financial aid and support programs are being implemented to help those who have suffered property damage or loss, including customers affected by Toronto power outages as repairs continue. The city is working closely with insurance companies to facilitate claims and provide relief to those in need.

In addition to the immediate cleanup, there is a heightened focus on evaluating and improving the city's flood management systems. The recent storms have highlighted vulnerabilities in Toronto’s infrastructure, prompting calls for enhanced flood prevention measures. City officials and urban planners are assessing the current drainage systems and exploring ways to bolster their capacity to handle future extreme weather events.

The storms have also sparked discussions about the broader implications of climate change and its impact on urban areas. Experts suggest that increasingly severe weather events, including heavy rainfall and flooding, may become more common, as seen with Houston's extended power outage after severe storms, as global temperatures rise. This has led to a call for more resilient and adaptable infrastructure to better withstand such events.

Community organizations and volunteers have played a vital role in the recovery process. Local groups have come together to support their neighbors, providing assistance with cleanup efforts, distributing supplies, and offering emotional support to those affected by the disaster. Their contributions underscore the importance of community solidarity in times of crisis.

As Toronto works towards recovery, there is a clear recognition of the need for a comprehensive strategy to address both the immediate and long-term challenges posed by severe weather events. The city’s response will involve not only repairing the damage caused by this storm but also investing in infrastructure improvements, drawing lessons from London power outage disruption cases to harden critical systems, and adopting measures to mitigate the impact of future floods.

In summary, the severe storms that recently struck Toronto have led to widespread flooding and significant disruption across the city. The immediate response has involved extensive cleanup efforts, damage assessment, and support for affected residents and businesses. Looking ahead, Toronto faces the challenge of enhancing its flood management systems and preparing for the potential impacts of climate change. The collective efforts of emergency services, city officials, and community members will be crucial in ensuring a swift recovery and building resilience against future storms.


Related News

View more

Sign Up for Electricity Forum’s Newsletter

Stay informed with our FREE Newsletter — get the latest news, breakthrough technologies, and expert insights, delivered straight to your inbox.

Electricity Today T&D Magazine Subscribe for FREE

Stay informed with the latest T&D policies and technologies.
  • Timely insights from industry experts
  • Practical solutions T&D engineers
  • Free access to every issue

Live Online & In-person Group Training

Advantages To Instructor-Led Training – Instructor-Led Course, Customized Training, Multiple Locations, Economical, CEU Credits, Course Discounts.

Request For Quotation

Whether you would prefer Live Online or In-Person instruction, our electrical training courses can be tailored to meet your company's specific requirements and delivered to your employees in one location or at various locations.