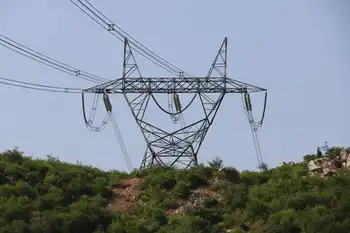
AMSC Receives for Follow-up Order for Chinese Wind Turbines

By Business Wire


Substation Relay Protection Training

Our customized live online or in‑person group training can be delivered to your staff at your location.

  • Live Online
  • 12 hours Instructor-led
  • Group Training Available
Regular Price:
$699
Coupon Price:
$599
Reserve Your Seat Today
American Superconductor Corporation, a leading energy technologies company, announced at the HUSUMwind 2007 trade show in Germany that it has received a follow-on order for approximately $20 million in wind turbine electrical systems from Beijing-based Sinovel Wind Corporation Limited.

The order follows a $70 million order received from Sinovel Wind in July 2007 and additional D-VAR orders for grid interconnection of domestic and international wind farms.

“AMSC’s wind power business continues to expand globally, with China serving as our largest market,” said Greg Yurek, founder and chief executive officer of AMSC. “As Sinovel Wind continues its rapid production ramp, we are also working closely with two additional customers in China to help them initiate production of wind turbines in order to meet China’s growing demand for zero-emission, wind generated electricity. We see strong potential to add a fourth Chinese customer this fiscal year and are working with other potential customers to expand our reach into other countries.”

The Global Wind Energy Council estimates that approximately 1,347 MW of wind generated electrical capacity was installed in all of China in 2006 and expects 8,000 MW of additional capacity to be added from 2007 through 2010. Worldwide wind power capacity is expected to more than double from 74 gigawatts (GW) at the end of 2006 to nearly 150 GW by the end of 2010.

AMSC now has wind power customers in Australia, Canada, China, the Czech Republic, Ireland, Japan, New Zealand, South Korea, the U.K. and the U.S.

“The global wind industry is expected to continue to grow approximately 20 percent annually through 2010 as countries around the world rely increasingly on wind power to help meet their growing demands for renewable sources of electricity,” said Yurek. “We expect to see continued growth in sales of our existing product line for the wind industry and to expand our offerings beyond power electronics going forward.”

Related News

Paris Finalises Energy Roadmap for 2025–2035 with Imminent Decree

France 2025–2035 Energy Roadmap accelerates carbon neutrality via renewables expansion, energy efficiency, EV adoption, heat pumps, hydrogen, CCS, nuclear buildout, and wind and solar targets, cutting fossil fuels and emissions across transport, housing, industry.


Key Points

A national plan to cut fossil use and emissions, boost renewables, and scale efficiency and clean technologies.

✅ Cuts fossil share to 30% by 2035 with efficiency gains

✅ Scales solar PV and wind; revives nuclear with EPR 2

✅ Electrifies transport and industry with EVs, hydrogen, CCS


Paris is on the verge of finalising its energy roadmap for the period 2025–2035, with an imminent decree expected to be published by the end of the first quarter of 2025. This roadmap is part of France's broader strategy to achieve carbon neutrality by 2050, aligning with wider moves toward clean electricity regulations in other jurisdictions.

Key Objectives of the Roadmap

The energy roadmap outlines ambitious targets for reducing greenhouse gas emissions across various sectors, including transport, housing, food, and energy. The primary goals are:

  • Reducing Fossil Fuel Dependency: Building on the EU's plan to dump Russian energy, the share of fossil fuels in final energy consumption is to fall from 60% in 2022 to 42% in 2030 and 30% in 2035.

  • Enhancing Energy Efficiency: A target of a 28.6% reduction in energy consumption between 2012 and 2030 is set, focusing on conservation and energy efficiency measures.

  • Expanding Decarbonised Energy Production: The roadmap aims to accelerate the development of renewable energies and the revival.

Sector-Specific Targets

  • Transport: The government aims to cut emissions by 31, focusing on the growth of electric vehicles, increasing public transport, and expanding charging infrastructure.

  • Housing: Emissions from buildings are to be reduced by 44%, with plans to replace 75% of oil-fired and install 1 million heat pumps.

  • Agriculture and Food: The roadmap includes measures to reduce emissions from agriculture by 9%, promoting organic farming and reducing the use of nitrogen fertilizers.

  • Industry: A 37% reduction in emissions is targeted through the use of electricity, biomass, hydrogen, and CO₂ capture and storage technologies informed by energy technology pathways outlined in ETP 2017.

Renewable Energy Targets

The roadmap sets ambitious targets for renewable energy production that align with Europe's ongoing electricity market reform efforts:

  • Photovoltaic Power: A sixfold increase in photovoltaic power between 2022

  • Offshore Wind Power: Reaching 18 gigawatts up from 0.6 GW

  • Onshore Wind Power: Doubling capacity from 21 GW to 45 GW over the same period.

  • Nuclear Power: The commissioning of the evolutionary power and the construction of six EPR 2 reactors, underpinned by France's deal on electricity prices with EDF to support long-term investment, with the potential for eight more.
     

Implementation and Governance

The final version of the roadmap will be adopted by decree, alongside a proposed electricity pricing scheme to address EU concerns, rather than being enshrined in law as required by the Energy Code. The government had previously abandoned the energy-climate planning. The decree is expected to be published at the end of the Multiannual Energy Program (PPE) and in the second half of the third National Low-Carbon Strategy (SNBC).

Paris's finalisation of its energy roadmap for 2025–2035 marks a significant step towards achieving carbon neutrality by 2050. The ambitious targets set across various sectors reflect a comprehensive approach to reducing greenhouse gas emissions and transitioning to a more sustainable energy system amid the ongoing EU electricity reform debate shaping market rules. The imminent decree will provide the legal framework necessary to implement these plans and drive the necessary changes across the country.


Related News

View more

Manitoba Hydro's burgeoning debt surpasses $19 billion

Manitoba Hydro Debt Load surges past $19.2B as the Crown corporation faces shrinking net income, restructuring costs, and PUB rate decisions, driven by Bipole III, Keeyask construction, aging infrastructure, and rising interest rate risks.


Key Points

Manitoba Hydro Debt Load refers to the utility's escalating borrowings exceeding $19B, pressuring rates and finances.

✅ Debt rose to $19.2B; projected near $25B within five years.

✅ Major drivers: Bipole III, Keeyask, aging assets, restructuring.

✅ Rate hikes sought; PUB approved 3.6% vs 7.9% request.


Manitoba Hydro's debt load now exceeds $19 billion as the provincial Crown corporation grapples with a shrinking net income amid ongoing efforts to slay costs.

The utility's annual report, to be released publicly on Tuesday, also shows its total consolidated net income slumped from $71 million in 2016-2017 to $37 million in the last fiscal year, mirroring a Hydro One profit drop as electricity revenue fell.

It said efforts to restructure the utility and reduce costs are partly to blame for the $34 million drop in year-over-year income.

These earnings come nowhere close, however, to alleviating Hydro's long-term debt problem, a dynamic also seen in a BC Hydro deferred costs report about customer exposure. The figure is pegged at $19.2 billion this fiscal year, up from $16.1 billion the previous year and $14.2 billion in 2016.

The utility projects its debt will grow to about $25 billion in the next five years. Its largest expenses include finishing the Bipole III line, working on the Keeyask Generating System that is halfway done and rebuilding aging wood poles and substations, the report said.

"This level of debt increases the potential financial exposure from risks facing the corporation and is a concern for both

the corporation and our customers who may be exposed to higher rate increases in the event of rising interest rates, a prolonged drought or a major system failure," outgoing president and CEO Kelvin Shepherd wrote.

The income drop is primarily a result of the $50 million spent in the form of restructuring charges associated with the utility's efforts to streamline the organization and drive down costs, amid NDP criticism of Hydro changes related to government policy.

Those efforts included the implementation of buyouts for employees through what the utility dubbed its "voluntary departure program."

Among the changes, Manitoba Hydro reduced its workforce by 800 employees, which is expected to save the utility over $90 million per year. It also reduced its management positions by 26 per cent, a Monday news release said, while Hydro One leadership upheaval in Ontario drove its shares down during comparable governance turmoil.

To improve its financial situation, Hydro has applied for rate increases, even as the Consumers Coalition pushes to have the proposal rejected. The Public Utilities Board offered a 3.6 per cent average rate hike, instead of the 7.9 per cent jump the utility asked for.

In May, when the PUB rendered its decision, it made several recommendations as an alternative to raising rates, including receiving a share of carbon tax revenue and asking the government to help pay for Bipole III.

Hydro is projecting a net income of $70 million for 2018-2019, which includes the impact of the recent rate increase. That total reflects an approximately 20 per cent reduction in net income from 2017-18 after restructuring costs are calculated.


Related News

View more

UK's Energy Transition Stalled by Supply Delays

UK Clean Energy Supply Chain Delays are slowing decarbonization as transformer lead times, grid infrastructure bottlenecks, and battery storage contractors raise costs and risk 2030 targets despite manufacturing expansions by Siemens Energy and GE Vernova.


Key Points

Labor and equipment bottlenecks delay transformers and grid upgrades, risking the UK's 2030 clean power target.

✅ Transformer lead times doubled or tripled, raising project costs

✅ Grid infrastructure and battery storage contractors in short supply

✅ Firms expand capacity cautiously amid uncertain demand signals


The United Kingdom's ambitious plans to transition to clean energy are encountering significant obstacles due to prolonged delays in obtaining essential equipment such as transformers and other electrical components. These supply chain challenges are impeding the nation's progress toward decarbonizing its power sector by 2030, even as wind leads the power mix in key periods.

Supply Chain Challenges

The global surge in demand for renewable energy infrastructure, including large-scale storage solutions, has led to extended lead times for critical components. For example, Statera Energy's storage plant in Thurrock experienced a 16-month delay for transformers from Siemens Energy. Such delays threaten the UK's goal to decarbonize power supplies by 2030.

Economic Implications

These supply chain constraints have doubled or tripled lead times over the past decade, resulting in increased costs and straining the energy transition as wind became the main source of UK electricity in a recent milestone. Despite efforts to expand manufacturing capacity by companies like GE Vernova, Hitachi Energy, and Siemens Energy, the sector remains cautious about overinvesting without predictable demand, and setbacks at Hinkley Point C have reinforced concerns about delivery risks.

Workforce and Manufacturing Capacity

Additionally, there is a limited number of companies capable of constructing and maintaining battery sites, adding to the challenges. These issues underscore the necessity for new factories and a trained workforce to support the electrification plans and meet the 2030 targets.

Government Initiatives

In response to these challenges, the UK government is exploring various strategies to bolster domestic manufacturing capabilities and streamline supply chains while supporting grid reform efforts underway to improve system resilience. Investments in infrastructure and workforce development are being considered to mitigate the impact of global supply chain disruptions and advance the UK's green industrial revolution for next-generation reactors.

The UK's energy transition is at a critical juncture, with supply chain delays posing substantial risks to achieving decarbonization goals, including the planned end of coal power after 142 years for the UK. Addressing these challenges will require coordinated efforts between the government, industry stakeholders, and international partners to ensure a sustainable and timely shift to clean energy.


Related News

View more

U.S. Residents Averaged Fewer Power Outages in 2022

2022 U.S. Power Outage Statistics show lower SAIDI as fewer major events hit, with SAIFI trends, electric reliability, outage duration and frequency shaped by hurricanes, winter storms, vegetation, and utility practices across states.


Key Points

They report SAIDI and SAIFI for 2022, showing outage duration, frequency, and impacts of major weather events.

✅ 2022 SAIDI averaged 5.6 hours; SAIFI averaged 1.4 interruptions.

✅ Fewer major events lowered outage duration versus 2021.

✅ Hurricanes and winter storms drove long outages in several states.


In 2022, U.S. electricity consumers on average experienced about 5.5 hours of power disruptions, a decrease from nearly two hours compared to 2021. This information comes from the latest Annual Electric Power Industry Report. The reduction in yearly power interruptions primarily resulted from fewer significant events in 2022 compared to the previous year, and utility disaster planning continues to support grid resilience as severe weather persists.

Since 2013, excluding major events, the annual average duration of power interruptions has consistently hovered around two hours. Factors contributing to major power disruptions include weather-related incidents, vegetation interference near power lines, and specific utility practices, while pandemic-related grid operations influenced workforce planning more than outage frequency. To assess the reliability of U.S. electric utilities, two key indexes are utilized:

  • The System Average Interruption Duration Index (SAIDI) calculates the total length (in hours) an average customer endures non-brief power interruptions over a year.
  • The System Average Interruption Frequency Index (SAIFI) tracks the number of times interruptions occur.

The influence of major events on electrical reliability is gauged by comparing affected states' SAIDI and SAIFI values against the U.S. average, which was 5.6 hours of outages and 1.4 outages per customer in 2022. The year witnessed 18 weather-related disasters in the U.S., each resulting in over $1 billion in damages, and COVID-19 grid assessments indicated the electricity system was largely safe from pandemic impacts. Noteworthy major events include:

  • Hurricane Ian in September 2022, leaving over 2.6 million Floridian customers without electricity, with restoration in some areas taking weeks rather than days.
  • Hurricane Nicole in November 2022, causing over 300,000 Florida customers to lose power.
  • Winter Storm Elliott in December 2022, affecting over 1.5 million customers in multiple states including Texas where utilities struggled after Hurricane Harvey to restore service, and Florida, and bringing up to four feet of snow in parts of New York.

In 2022, states like Florida, West Virginia, Maine, Vermont, and New Hampshire experienced the most prolonged power interruptions, with New Hampshire averaging 10.3 hours and Florida 19.1 hours, and FPL's Irma storm response illustrates how restoration can take days or weeks in severe cases. Conversely, the District of Columbia, Delaware, Rhode Island, Nebraska, and Iowa had the shortest total interruptions, with the District of Columbia averaging just 34 minutes and Iowa 85 minutes.

The frequency of outages, unlike their duration, is more often linked to non-major events. Across the nation, Alaska recorded the highest number of power disruptions per customer (averaging 3.5), followed by several heavily forested states like Tennessee and Maine. Power outages due to falling tree branches are common, particularly during winter storms that burden tree limbs and power lines, as seen in a North Seattle outage affecting 13,000 customers. The District of Columbia stood out with the shortest and fewest outages per customer.


Related News

View more

In North Carolina, unpaid electric and water bills are driving families and cities to the financial brink

North Carolina Utility Arrears Crisis strains households and municipal budgets as COVID-19 cuts jobs; unpaid utility bills mount, shutoffs loom, and emergency aid, unemployment benefits, and CARES Act relief lag behind rising arrears across cities.


Key Points

A COVID-19 driven spike in unpaid utility bills, threatening households and municipal budgets as federal aid lapses.

✅ 1 million families behind on power, water, sewage bills

✅ $218M arrears accrued April to June, double last year

✅ Municipal utilities face shutoffs, budget shortfalls


As many as 1 million families in North Carolina have fallen behind on their electric, water and sewage bills, a sign of energy insecurity threatening residents and their cities with severe financial hardship unless federal lawmakers act to approve more emergency aid.

The trouble stems from the widespread economic havoc wrought by the coronavirus, which has left millions of workers out of a job and struggling to cover their monthly costs as some states moved to suspend utility shut-offs to provide relief. Together, they’ve been late or missed a total of $218 million in utility payments between April 1 and the end of June, according to data released recently by the state, nearly double the amount in arrears at this time last year.

In some cases, cities that own or operate their own utilities have been forced to absorb these losses, as some utilities reconnected customers to prevent harm, creating a dire situation in which the government’s attempt to save people from the financial brink instead has pushed municipal coffers to their own breaking point.

In Elizabeth City, N.C., for example, about 2,500 residents haven’t paid their electric bills on time, according to Richard Olson, the city manager. The late payments at one point proved so problematic that Olson said he calculated Elizabeth City wouldn’t have enough money to pay for its expenses in July. In response, city leaders requested and obtained a waiver from a statewide order, similar to New York’s disconnection moratorium, issued in March, that protects people from being penalized for their past-due utility bills.

The predicament has presented unique budget challenges throughout North Carolina, while illustrating the consequences of a cash crunch plaguing the entire country, where proposals such as a Texas electricity market bailout surfaced following severe grid stress. State and federal leaders have extended a range of coronavirus relief programs since March to try to help people through the pandemic. But the money is limited and restricted — and it’s not clear whether more help from Congress is on the way — creating a crisis in which the nation’s economic woes are outpacing some of the aid programs adopted to combat them.

“We are entering a phase where the utilities [may] be able to shut off power, but what was propping up people’s economic lives, the unemployment benefits and Cares Act support, won’t be there,” said Paul Meyer, the executive director of the North Carolina League of Municipalities.

White House, GOP in disarray over coronavirus spending plan as deadline nears on expiring emergency aid

The future of that safety-net support — and other federal aid — hangs in the balance as lawmakers returned to work this week in their final sprint ahead of the August recess. The White House and congressional leaders are split over the contours of the next coronavirus relief package, including the need to extend more aid to cities and states as some utilities have waived fees to help customers, and reauthorize an extra $600 in weekly unemployment payments that were approved as part of the Cares Act in March.

Outside Washington, workers, businesses and government officials nationwide have pleaded with federal lawmakers to renew or expand those programs. Last week, Roy Cooper, the Democratic governor of North Carolina, urged Congress to act swiftly and adopt a wide array of new federal spending, including proposals for DOE nuclear cleanup funding, stressing in a letter that the “actions you take in the next few weeks are vital to our ability to emerge from this crisis. ”


Related News

View more

Can California Manage its Solar Boom?

California Duck Curve highlights midday solar oversupply and steep evening peak demand, stressing grid stability. Solutions include battery storage, demand response, diverse renewables like wind, geothermal, nuclear, and regional integration to reduce curtailment.


Key Points

A mismatch between midday solar surplus and evening demand spikes, straining the grid without storage and flexibility.

✅ Midday solar oversupply forces curtailment and wasted clean energy.

✅ Evening ramps require fast, fossil peaker plants to stabilize load.

✅ Batteries, demand response, regional trading flatten the curve.


California's remarkable success in adopting solar power, including a near-100% renewable milestone, has created a unique challenge: managing the infamous "duck curve." This distinctive curve illustrates a growing mismatch between solar electricity generation and the state's energy demands, creating potential problems for grid stability and ultimately threatening to slow California's progress in the fight against climate change.


The Shape of the Problem

The duck curve arises from a combination of high solar energy production during midday hours and surging energy demand in the late afternoon and evening when solar power declines. During peak solar hours, the grid often has an overabundance of electricity, and curtailments are increasing as a result, while as the sun sets, demand surges when people return home and businesses ramp up operations. California's energy grid operators must scramble to make up this difference, often relying on fast-acting but less environmentally friendly power sources.


The Consequences of the Duck Curve

The increasing severity of the duck curve has several potential consequences for California:

  • Grid Strain: The rapid ramp-up of power sources to meet evening demand puts significant strain on the electrical grid. This can lead to higher operational costs and potentially increase the risk of blackouts during peak demand times.
  • Curtailed Energy: To avoid overloading the grid, operators may sometimes have to curtail excess solar energy during midday, as rising curtailment reports indicate, essentially wasting clean electricity that could have been used to displace fossil fuel generation.
  • Obstacle to More Solar: The duck curve can make it harder to add new solar capacity, as seen in Alberta's solar expansion challenges, for fear of further destabilizing the grid and increasing the need for fossil fuel-based peaking plants.


Addressing the Challenge

California is actively seeking solutions to mitigate the duck curve, aligning with national decarbonization pathways that emphasize practicality. Potential strategies include:

  • Energy Storage: Deploying large-scale battery storage can help soak up excess solar electricity during the day and release it later when demand peaks, smoothing out the duck curve.
  • Demand Flexibility: Encouraging consumers to shift their energy use to off-peak hours through incentives and smart grid technologies can help reduce late-afternoon surges in demand.
  • Diverse Power Sources: While solar is crucial, a balanced mix of energy sources, including geothermal, wind, and nuclear, can improve grid stability and reduce reliance on rapid-response fossil fuel plants.
  • Regional Cooperation: Integrating California's grid with neighboring states can aid in balancing energy supply and demand across a wider geographical area.


The Ongoing Solar Debate

The duck curve has become a central point of debate about the future of California's energy landscape. While acknowledging the challenge, solar advocates argue for continued expansion, backed by measures like a bill to require solar on new buildings, emphasizing the urgent need to transition away from fossil fuels. Grid operators and some utility companies call for a more cautious approach, emphasizing grid reliability and potential costs if the problem isn't effectively managed.


Balancing California's Needs and its Green Ambitions

Finding the right path forward is essential; it will determine whether California can continue to lead the way in solar energy adoption while ensuring a reliable and affordable electricity supply. Successfully navigating the duck curve will require innovation, collaboration, and a strong commitment to building a sustainable energy system, as wildfire smoke impacts on solar continue to challenge generation predictability.


Related News

View more

Sign Up for Electricity Forum’s Newsletter

Stay informed with our FREE Newsletter — get the latest news, breakthrough technologies, and expert insights, delivered straight to your inbox.

Electricity Today T&D Magazine Subscribe for FREE

Stay informed with the latest T&D policies and technologies.
  • Timely insights from industry experts
  • Practical solutions T&D engineers
  • Free access to every issue

Download the 2025 Electrical Training Catalog

Explore 50+ live, expert-led electrical training courses –

  • Interactive
  • Flexible
  • CEU-cerified