Utilities team up to sell 'green power' in South Carolina

By Knight Ridder Tribune


CSA Z462 Arc Flash Training - Electrical Safety Essentials

Our customized live online or in‑person group training can be delivered to your staff at your location.

  • Live Online
  • 6 hours Instructor-led
  • Group Training Available
Regular Price:
$249
Coupon Price:
$199
Reserve Your Seat Today
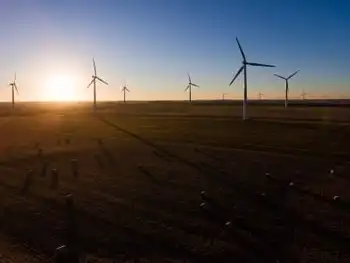
Scana Corp., Duke Energy Corp. and Progress Energy Inc. will start selling "green power" to their South Carolina customers early next year through a nonprofit group established by the state, four years after North Carolina launched a similar program.

The three utilities will market the renewable energy to the 1.3 million homes and businesses that they serve in the state, while the newly formed organization, dubbed Palmetto Clean Energy, or PaCE, will buy the power from small Southeastern companies that generate electricity with wind turbines, solar panels and landfill gas.

"We're going to be, I guess you'd call it a pass-through agency," said Tim Petty, a spokesman for Charlotte-based Duke Energy, which serves about 520,000 homes and businesses in South Carolina. The power will be sold in "blocks" of 100 kilowatt-hours, roughly enough to run a refrigerator for a month.

Though state officials are still determining the cost of the power, the average homeowner will pay between $40 and $50 to go entirely green, according to Dukes Scott, executive director of the state Office of Regulatory Staff, which set up the PaCE program. "It's not only for the utilities to kind of test the water without taking on big capital costs, but it allows ORS to kind of test the water a d see what's out there in terms of green production," Scott said.

The program is modeled after an arrangement launched in North Carolina in 2003. Almost 12,000 homes and businesses in the Tar Heel State buy enough green power to equal the carbon reduction realized by planting 4.2 million trees.

Santee Cooper, the state-owned utility based in Moncks Corner, has been selling renewable energy since 2001. But South Carolinians have been slow to turn green, and only a few thousand customers have paid premiums for the cleaner energy. South Carolina residents have long been able to offset their energy use by buying a like amount of renewable electricity to be fed onto the grid elsewhere in the country.

About 16 companies nationwide sell green power "tags," or credits, for between $5 and $75 per megawatt-hour. The firms use the money to erect wind turbines and solar panels or subsidize utilities that build green power plants.

Related News

Electricity and water do mix: How electric ships are clearing the air on the B.C. coast

Hybrid Electric Ships leverage marine batteries, LNG engines, and clean propulsion to cut emissions in shipping. From ferries to cargo vessels, electrification and sustainability meet IMO regulations, Corvus Energy systems, and dockside fast charging.


Key Points

Hybrid electric ships use batteries with diesel or LNG engines to cut fuel and emissions and meet stricter IMO rules.

✅ LNG or diesel gensets recharge marine battery packs.

✅ Cuts CO2, NOx, and particulate emissions in port and at sea.

✅ Complies with IMO standards; enables quiet, efficient operations.


The river is running strong and currents are swirling as the 150-metre-long Seaspan Reliant slides gently into place against its steel loading ramp on the shores of B.C.'s silty Fraser River.

The crew hustles to tie up the ship, and then begins offloading dozens of transport trucks that have been brought over from Vancouver Island.

While it looks like many vessels working the B.C. coast, below decks, the ship is very different. The Reliant is a hybrid, partly powered by electricity, and joins BC Ferries' hybrid ships in the region, the seagoing equivalent of a Toyota Prius.

Down below decks, Sean Puchalski walks past a whirring internal combustion motor that can run on either diesel or natural gas. He opens the door to a gleaming white room full of electrical cables and equipment racks along the walls.

"As with many modes of transportation, we're seeing electrification, from electric planes to ferries," said Puchalski, who works with Corvus Energy, a Richmond, B.C. company that builds large battery systems for the marine industry.

In this case, the batteries are recharged by large engines burning natural gas.

"It's definitely the way of the future," said Puchalski.

The 10-year-old company's battery system is now in use on 200 vessels around the world. Business has spiked recently, driven by the need to reduce emissions, and by landmark projects such as battery-electric high-speed ferries taking shape in the U.S.

"When you're building a new vessel, you want it to last for, say, 30 years. You don't want to adopt a technology that's on the margins in terms of obsolescence," said Puchalski. "You want to build it to be future-proof."


Dirty ships

For years, the shipping industry has been criticized for being slow to clean up its act. Most ships use heavy fuel oil, a cheap, viscous form of petroleum that produces immense exhaust. According to the European Commission, shipping currently pumps out about 940 million tonnes of CO2 each year, nearly three per cent of the global total.

That share is expected to climb even higher as other sectors reduce emissions.

When it comes to electric ships, Scandinavia is leading the world. Several of the region's car and passenger ferries are completely battery powered — recharged at the dock by relatively clean hydro power, and projects such as Kootenay Lake's electric-ready ferry show similar progress in Canada.


Tougher regulations and retailer pressure

The push for cleaner alternatives is being partly driven by worldwide regulations, with international shipping regulators bringing in tougher emission standards after a decade of talk and study, while financing initiatives are helping B.C. electric ferries scale up.

At the same time, pressure is building from customers, such as Mountain Equipment Co-op, which closely tracks its environmental footprint. Kevin Lee, who heads MEC's supply chain, said large companies are realizing they are accountable for their contributions to climate change, from the factory to the retail floor.

"You're hearing more companies build it into their DNA in terms of how they do business, and that's cool to see," said Lee. "It's not just MEC anymore trying to do this, there's a lot more partners out there."

In the global race to cut emissions, all kinds of options are on the table for ships, including giant kites being tested to harvest wind power at sea, and ports piloting hydrogen-powered cranes to cut dockside emissions.

Modern versions of sailing ships are also being examined to haul cargo with minimal fuel consumption.

But in practical terms, hybrids and, in the future, pure electrics are likely to play a larger role in keeping the propellers turning along Canada's coast, with neighboring fleets like Washington State Ferries' upgrade underscoring the shift.


Related News

View more

How Energy Use Has Evolved Throughout U.S. History

U.S. Energy Transition traces the shift from coal and oil to natural gas, nuclear power, and renewables like wind and solar, driven by efficiency, grid modernization, climate goals, and economic innovation.


Key Points

The U.S. Energy Transition is the shift from fossil fuels to cleaner power, driven by tech, policy, and markets.

✅ Shift from coal and oil to gas, nuclear, wind, and solar

✅ Enabled by grid modernization, storage, and efficiency

✅ Aims to cut emissions while ensuring reliability and affordability


The evolution of energy use in the United States is a dynamic narrative that reflects technological advancements, economic shifts, environmental awareness, and societal changes over time. From the nation's early reliance on wood and coal to the modern era dominated by oil, natural gas, and renewable sources, the story of energy consumption in the U.S. is a testament to innovation and adaptation.

Early Energy Sources: Wood and Coal

In the early days of U.S. history, energy needs were primarily met through renewable resources such as wood for heating and cooking. As industrialization took hold in the 19th century, coal emerged as a dominant energy source, fueling steam engines and powering factories, railways, and urban growth. The widespread availability of coal spurred economic development and shaped the nation's infrastructure.

The Rise of Petroleum and Natural Gas

The discovery and commercialization of petroleum in the late 19th century transformed the energy landscape once again. Oil quickly became a cornerstone of the U.S. economy, powering transportation, industry, and residential heating, and informing debates about U.S. energy security in policy circles. Concurrently, natural gas emerged as a significant energy source, particularly for heating and electricity generation, as pipelines expanded across the country.

Electricity Revolution

The 20th century witnessed a revolution in electricity generation and consumption, and understanding where electricity comes from helps contextualize how systems evolved. The development of hydroelectric power, spurred by projects like the Hoover Dam and Tennessee Valley Authority, provided clean and renewable energy to millions of Americans. The widespread electrification of rural areas and the proliferation of appliances in homes and businesses transformed daily life and spurred economic growth.

Nuclear Power and Energy Diversification

In the mid-20th century, nuclear power emerged as a promising alternative to fossil fuels, promising abundant energy with minimal greenhouse gas emissions. Despite concerns about safety and waste disposal, nuclear power plants became a significant part of the U.S. energy mix, providing a stable base load of electricity, even as the aging U.S. power grid complicates integration of variable renewables.

Renewable Energy Revolution

In recent decades, the U.S. has seen a growing emphasis on renewable energy sources such as wind, solar, and geothermal power, yet market shocks and high fuel prices alone have not guaranteed a rapid green revolution, prompting broader policy and investment responses. Advances in technology, declining costs, and environmental concerns have driven investments in clean energy infrastructure and policies promoting renewable energy adoption. States like California and Texas lead the nation in wind and solar energy production, demonstrating the feasibility and benefits of transitioning to sustainable energy sources.

Energy Efficiency and Conservation

Alongside shifts in energy sources, improvements in energy efficiency and conservation have played a crucial role in reducing per capita energy consumption and greenhouse gas emissions. Energy-efficient appliances, building codes, and transportation innovations have helped mitigate the environmental impact of energy use while reducing costs for consumers and businesses, and weather and economic factors also influence demand; for example, U.S. power demand fell in 2023 on milder weather, underscoring the interplay between efficiency and usage.

Challenges and Opportunities

Looking ahead, the U.S. faces both challenges and opportunities in its energy future, as recent energy crisis effects ripple across electricity, gas, and EVs alike. Addressing climate change requires further investments in renewable energy, grid modernization, and energy storage technologies. Balancing energy security, affordability, and environmental sustainability remains a complex task that requires collaboration between government, industry, and society.

Conclusion

The evolution of energy use throughout U.S. history reflects a continuous quest for innovation, economic growth, and environmental stewardship. From wood and coal to nuclear power and renewables, each era has brought new challenges and opportunities in meeting the nation's energy needs. As the U.S. transitions towards a cleaner and more sustainable energy future, leveraging technological advancements and embracing policy solutions, amid debates over U.S. energy dominance, will be essential in shaping the next chapter of America's energy story.


Related News

View more

Oil crash only a foretaste of what awaits energy industry

Oil and Gas Profitability Decline reflects shale-driven oversupply, OPEC-Russia dynamics, LNG exports, renewables growth, and weak demand, signaling compressed margins for producers, stressed petrodollar budgets, and shifting energy markets post-Covid.


Key Points

A sustained squeeze on hydrocarbon margins from agile shale supply, weaker OPEC leverage, and expanding renewables.

✅ Shale responsiveness caps prices and erodes industry rents

✅ OPEC-Russia cuts face limited impact versus US supply

✅ Renewables and EVs slow long-term oil and gas demand


The oil-price crash of March 2020 will probably not last long. As in 2014, when the oil price dropped below $50 from $110 in a few weeks, this one will trigger a temporary collapse of the US shale industry. Unless the coronavirus outbreak causes Armageddon, cheap oil will also support policymakers’ efforts to help the global economy.

But there will be at least one important and lasting difference this time round — and it has major market and geopolitical implications.

The oil price crash is a foretaste of where the whole energy sector was going anyway — and that is down.

It may not look that way at first. Saudi Arabia will soon realise, as it did in 2015, that its lethal decision to pump more oil is not only killing US shale but its public finances as well. Riyadh will soon knock on Moscow’s door again. Once American shale supplies collapse, Russia will resume co-operation with Saudi Arabia.

With the world economy recovering from the Covid-19 crisis by then, and with electricity demand during COVID-19 shifting, moderate supply cuts by both countries will accelerate oil market recovery. In time, US shale producers will return too.

Yet this inevitable bounceback should not distract from two fundamental factors that were already remaking oil and gas markets. First, the shale revolution has fundamentally eroded industry profitability. Second, the renewables’ revolution will continue to depress growth in demand.

The combined result has put the profitability of the entire global hydrocarbon industry under pressure. That means fewer petrodollars to support oil-producing countries’ national budgets, including Canada's oil sector exposures. It also means less profitable oil companies, which traditionally make up a large segment of stock markets, an important component of so many western pension funds.

Start with the first factor to see why this is so. Historically, the geological advantages that made oil from countries such as Saudi Arabia so cheap to produce were unique. Because oil and gas were produced at costs far below the market price, the excess profits, or “rent”, enjoyed by the industry were very large.

Furthermore, collusion among low-cost producers has been a winning strategy. The loss of market share through output cuts was more than compensated by immediately higher prices. It was the raison d’être of Opec.

The US shale revolution changed all this, exposing the limits of U.S. energy dominance narratives. A large oil-producing region emerged with a remarkable ability to respond quickly to price changes and shrink its costs over time. Cutting back cheap Opec oil now only increases US supplies, with little effect on world prices.

That is why Russia refused to cut production this month. Even if its cuts did boost world prices — doubtful given the coronavirus outbreak’s huge shock to demand — that would slow the shrinkage of US shale that Moscow wants.

Shale has affected the natural gas industry even more. Exports of US liquefied natural gas now put an effective ceiling on global prices, and debates over a clean electricity push have intensified when gas prices spike.

On top of all this, there is also the renewables’ revolution, though a green revolution has not been guaranteed in the near term. Around the world, wind and solar have become ever-cheaper options to generate electricity. Storage costs have also dropped and network management improved. Even in the US, renewables are displacing coal and gas. Electrification of vehicle fleets will damp demand further, as U.S. electricity, gas, and EVs face evolving pressures.

Eliminating fossil fuel consumption completely would require sustained and costly government intervention, and reliability challenges such as coal and nuclear disruptions add to the complexity. That is far from certain. Meanwhile, though, market forces are depressing the sector’s usual profitability.

The end of oil and gas is not immediately around the corner. Still, the end of hydrocarbons as a lucrative industry is a distinct possibility. We are seeing that in dramatic form in the current oil price crash. But this collapse is merely a message from the future.


Related News

View more

New Mexico Could Reap $30 Billion Driving on Electricity

New Mexico EV Benefits highlight cheaper fuel, lower maintenance, cleaner air, and smarter charging, cutting utility bills, reducing NOx and carbon emissions, and leveraging incentives and renewable energy to accelerate EV adoption statewide.


Key Points

New Mexico EV Benefits are the cost, grid, and emissions gains from EV adoption and optimized off-peak charging.

✅ Electricity near $1.11 per gallon equivalent cuts fueling costs

✅ Fewer moving parts mean less maintenance and lifecycle costs

✅ Off-peak charging reduces utility bills and grid emissions


What would happen if New Mexicans ditched gasoline and started to drive on cleaner, cheaper electricity? A new report from MJ Bradley & Associates, commissioned by NRDC and Southwest Energy Efficiency Project, answers that question, demonstrating that New Mexico could realize $30 billion in avoided expenditures on gasoline and maintenance, reduced utility bills, and environmental benefits by 2050. The state is currently considering legislation to jump-start that transition by providing consumers incentives to support electric vehicle (EV) purchases and the installation of charging stations, drawing on examples like Nevada's clean-vehicle push to accelerate deployment, a policy that would require a few million dollars in lost tax revenue. The report shows an investment of this kind could yield tens of billions of dollars in net benefits.


$20 Billion in Driver Savings

EVs save families money because driving on electricity in New Mexico is the cost-equivalent of driving on $1.11 per gallon gasoline. Furthermore, EVs have fewer moving parts and less required maintenance—no oil changes, no transmissions, no mufflers, no timing belts, etc. That means that tackling the nation’s largest source of carbon pollution, transportation, could save New Mexicans over $20 billion by 2050 because EVs are cheaper to charge and maintain than gas powered cars, and an EV boom benefits all customers through lower rates.

Those are savings New Mexico can bank on because the price of electricity is significantly cheaper than the price of gasoline and also inherently more stable. Electricity is made from a diverse supply of domestic and increasingly clean resources, and 2021 electricity lessons continue to inform grid planning today. Unlike the volatile world oil market, New Mexico’s electric sector is regulated by the state’s utility commission. Adjusted for inflation, the price of electricity has been steady around the dollar-a-gallon equivalent mark in New Mexico for the last 20 years, while gas prices jump up or down radically and unpredictably.

$4.8 Billion in Reduced Electric Bills

While some warn that electric cars will challenge state power grids, New Mexico can charge millions of EVs without the need to make significant investments in the electric grid. This is because EVs can be charged when the grid is underutilized and renewable energy is abundant, like when people are sleeping overnight when wind energy generation often peaks. And the billions of dollars in new utility revenue from EV charging in excess of associated costs will be automatically returned to utility customers per an accounting mechanism that is already in state law that requires downward adjustment of rates when sales increase. Accordingly, widespread EV adoption could reduce every utility customer’s electric bill.

Thankfully, New Mexico’s electric industry is already acting to ensure utility customers in the state realize those benefits sooner rather than later. The state’s rural electric cooperatives have proposed an ambitious plan to leverage funds available as a result of the Volkswagen diesel scandal to build a state-wide public fast charging network that mirrors progress as Arizona goes EV across the Southwest. Additionally, New Mexico’s investor-owned utilities will soon propose transportation electrification investments as required by legislation NRDC supported last year that Governor Lujan Grisham signed into law.

$4.8 Billion in Societal Benefits from Reduced Pollution

The report estimates that widespread EV adoption would dramatically reduce emissions of greenhouse gases from passenger vehicles in New Mexico, and also cut emissions of NOx, a local pollutant that threatens the health off all New Mexicans, especially children and people with respiratory conditions. The report finds growing the state’s EV market to meet New Mexico’s long-term environmental goals would yield $4.8 billion in societal benefits.

The Bottom Line: New Mexico Should Act Now to Accelerate its EV Market

Adding it all up, that’s more than $30 billion in potential benefits to New Mexico by 2050. Here’s the catch: as of June 2019, there were only 2,500 EVs registered in New Mexico, which means the state needs to accelerate the EV market, as the American EV boom ramps up nationally, to capture those billions of dollars in potential benefits. Thankfully, with second generation, longer range, affordable EVs now available, the market is well positioned to expand rapidly as the state moves to adopt Clean Car Standards that will ensure EVs are available for purchase in the state.

Getting it right

New Mexico has enormous amounts to gain from a small investment in incentives that support EV adoption now. For that investment to pay off, it needs to send a clear and unambiguous signal. Unfortunately, the same legislation that would establish tax credits to increase consumer access to electric vehicles in New Mexico was recently amended so it would not be helpful for 80 percent of consumers who lease, instead of buying EVs. And it would penalize EV drivers at the same time—with a $100 annual increase in registration fees, even as Texas adds a $200 EV fee under a similar rationale, to make up for lost gas tax revenue. That’s significantly more than what drivers of new gasoline vehicles pay annually in gas taxes in the state. Consumer Reports recently analyzed the growing trend to unfairly penalize electric cars via disproportionately high registration fees. In doing so, it estimated that the “maximum justifiable fee” to replace gas tax revenue in New Mexico would be $53. Anything higher will only slow or stop benefits New Mexico can attain from moving to cleaner cars.

To be clear, everyone should pay their fair share to maintain the transportation system, but EVs are not the problem when it comes to lost gas tax revenue. We need a comprehensive solution that addresses the real sources of transportation revenue loss while not undermining efforts to reduce dependence on gasoline. Thankfully, that can be done. For more, see A Simple Way to Fix the Gas Tax Forever.


Related News

View more

UK low-carbon electricity generation stalls in 2019

UK low-carbon electricity 2019 saw stalled growth as renewables rose slightly, wind expanded, nuclear output fell, coal hit record lows, and net-zero targets demand faster deployment to cut CO2 intensity below 100gCO2/kWh.


Key Points

Low-carbon sources supplied 54% of UK power in 2019, up just 1TWh; wind grew, nuclear fell, and coal dropped to 2%.

✅ Wind up 8TWh; nuclear down 9TWh amid outages

✅ Fossil fuels 43% of generation; coal at 2%

✅ Net-zero needs 15TWh per year added to 2030


The amount of electricity generated by low-carbon sources in the UK stalled in 2019, Carbon Brief analysis shows.

Low-carbon electricity output from wind, solar, nuclear, hydro and biomass rose by just 1 terawatt hour (TWh, less than 1%) in 2019. It represents the smallest annual increase in a decade, where annual growth averaged 9TWh. This growth will need to double in the 2020s to meet UK climate targets while replacing old nuclear plants as they retire.

Some 54% of UK electricity generation in 2019 came from low-carbon sources, including 37% from renewables and 20% from wind alone, underscoring wind's leading role in the power mix during key periods. A record-low 43% was from fossil fuels, with 41% from gas and just 2% from coal, also a record low. In 2010, fossil fuels generated 75% of the total.

Carbon Brief’s analysis of UK electricity generation in 2019 is based on figures from BM Reports and the Department for Business, Energy and Industrial Strategy (BEIS). See the methodology at the end for more on how the analysis was conducted.

The numbers differ from those published earlier in January by National Grid, which were for electricity supplied in Great Britain only (England, Wales and Scotland, but excluding Northern Ireland), including via imports from other countries.

Low-carbon low
In 2019, the UK became the first major economy to target net-zero greenhouse gas emissions by 2050, increasing the ambition of its legally binding Climate Change Act.

To date, the country has cut its emissions by around two-fifths since 1990, with almost all of its recent progress coming from the electricity sector.

Emissions from electricity generation have fallen rapidly in the decade since 2010 as coal power has been almost phased out and even gas output has declined. Fossil fuels have been displaced by falling demand and by renewables, such as wind, solar and biomass.

But Carbon Brief’s annual analysis of UK electricity generation shows progress stalled in 2019, with the output from low-carbon sources barely increasing compared to a year earlier.

The chart below shows low-carbon generation in each year since 2010 (grey bars) and the estimated level in 2019 (red). The pale grey bars show the estimated future output of existing low-carbon sources after old nuclear plants retire and the pale red bars show the amount of new generation needed to keep electricity sector emissions to less than 100 grammes of CO2 per kilowatt hour (gCO2/kWh), the UK’s nominal target for the sector.

 Annual electricity generation in the UK by fuel, terawatt hours, 2010-2019. Top panel: fuel by fuel. Bottom panel: cumulative total generation from all sources. Source: BEIS energy trends, BM Reports and Carbon Brief analysis. Chart by Carbon Brief using Highcharts.
As the chart shows, the UK will require significantly more low-carbon electricity over the next decade as part of meeting its legally binding climate goals.

The nominal 100gCO2/kWh target for 2030 was set in the context of the UK’s less ambitious goal of cutting emissions to 80% below 1990 levels by 2050. Now that the country is aiming to cut emissions to net-zero by 2050, that 100gCO2/kWh indicator is likely to be the bare minimum.

Even so, it would require a rapid step up in the pace of low-carbon expansion, compared to the increases seen over the past decade. On average, low-carbon generation has risen by 9TWh each year in the decade since 2010 – including a rise of just 1TWh in 2019.

Given scheduled nuclear retirements and rising demand expected by the Committee on Climate Change (CCC) – with some electrification of transport and heating – low-carbon generation would need to increase by 15TWh each year until 2030, just to meet the benchmark of 100gCO2/kWh.

For context, the 3.2 gigawatt (GW) Hinkley C new nuclear plant being built in Somerset will generate around 25TWh once completed around 2026. The world’s largest offshore windfarm, the 1.2GW Hornsea One scheme off the Yorkshire coast, will generate around 5TWh each year.

The new Conservative government is targeting 40GW of offshore wind by 2030, up from today’s figure of around 8GW. If policies are put in place to meet this goal, then it could keep power sector emissions below 100gCO2/kWh, depending on the actual performance of the windfarms built.

However, new onshore wind and solar, further new nuclear or other low-carbon generation, such as gas with carbon capture and storage (CCS), is likely to be needed if demand is higher than expected, or if the 100gCO2/kWh benchmark is too weak in the context of net-zero by 2050.

The CCC says it is “likely” to “reflect the need for more rapid deployment” of low-carbon towards net-zero emissions in its advice on the sixth UK carbon budget for 2033-2037, due in September.

Trading places
Looking more closely at UK electricity generation in 2019, Carbon Brief’s analysis shows why there was so little growth for low-carbon sources compared to the previous year.

There was another increase for wind power in 2019 (up 8TWh, 14%), with record wind generation as several large new windfarms were completed including the 1.2GW Hornsea One project in October and the 0.6GW Beatrice offshore windfarm in Q2 of 2019. But this was offset by a decline for nuclear (down 9TWh, 14%), due to ongoing outages for reactors at Hunterston in Scotland and Dungeness in Kent.

(Analysis of data held by trade organisation RenewableUK suggests some 0.6GW of onshore wind capacity also started operating in 2019, including the 0.2GW Dorenell scheme in Moray, Scotland.)

As a result of these movements, the UK’s windfarms overtook nuclear for the first time ever in 2019, becoming the country’s second-largest source of electricity generation, and earlier, wind and solar together surpassed nuclear in the UK as momentum built. This is shown in the figure below, with wind (green line, top panel) trading places with nuclear (purple) and gas (dark blue) down around 25% since 2010 but remaining the single-largest source.

 Annual electricity generation in the UK by fuel, terawatt hours, 2010-2019. Top panel: fuel by fuel. Bottom panel: cumulative total generation from all sources. Source: BEIS energy trends, BM Reports and Carbon Brief analysis. Chart by Carbon Brief using Highcharts.
The UK’s currently suspended nuclear plants are due to return to service in January and March, according to operator EDF, the French state-backed utility firm. However, as noted above, most of the UK’s nuclear fleet is set to retire during the 2020s, with only Sizewell B in Suffolk due to still be operating by 2030. Hunterston is scheduled to retire by 2023 and Dungeness by 2028.

Set against these losses, the UK has a pipeline of offshore windfarms, secured via “contracts for difference” with the government, at a series of auctions. The most recent auction, in September 2019, saw prices below £40 per megawatt hour – similar to current wholesale electricity prices.

However, the capacity contracted so far is not sufficient to meet the government’s target of 40GW by 2030, meaning further auctions – or some other policy mechanism – will be required.

Coal zero
As well as the switch between wind and nuclear, 2019 also saw coal fall below solar for the first time across a full year, echoing the 2016 moment when wind outgenerated coal across the UK, after it suffered another 60% reduction in electricity output. Just six coal plants remain in the UK, with Aberthaw B in Wales and Fiddlers Ferry in Cheshire closing in March.

Coal accounted for just 2% of UK generation in 2019, a record-low coal share since centralised electricity supplies started to operate in 1882. The fuel met 40% of UK needs as recently as 2012, but has plummeted thanks to falling demand, rising renewables, cheaper gas and higher CO2 prices.

The reduction in average coal generation hides the fact that the fuel is now often not required at all to meet the UK’s electricity needs. The chart below shows the number of days each year when coal output was zero in 2019 (red line) and the two previous years (blue).

 Cumulative number of days when UK electricity generation from renewable sources has been higher than that from fossil fuels. Source: BEIS energy trends, BM Reports and Carbon Brief analysis. Chart by Carbon Brief using Highcharts.
The 83 days in 2019 with zero coal generation amount to nearly a quarter of the year and include the record-breaking 18-day stretch without the fuel.

Great Britain has been running for a record TWO WEEKS without using coal to generate electricity – the first time this has happened since 1882.

The country’s grid has been coal-free for 45% of hours in 2019 so far.https://www.carbonbrief.org/countdown-to-2025-tracking-the-uk-coal-phase-out …

Coal generation was set for significant reductions around the world in 2019 – including a 20% reduction for the EU as a whole – according to analysis published by Carbon Brief in November.

Notably, overall UK electricity generation fell by another 9TWh in 2019 (3%), bringing the total decline to 58TWh since 2010. This is equivalent to more than twice the output from the Hinkley C scheme being built in Somerset. As Carbon Brief explained last year, falling demand has had a similar impact on electricity-sector CO2 emissions as the increase in output from renewables.

This is illustrated by the fact that the 9TWh reduction in overall generation translated into a 9TWh (6%) cut in fossil-fuel generation during 2019, with coal falling by 10TWh and gas rising marginally.

Increasingly renewable
As fossil-fuel output and overall generation have declined, the UK’s renewable sources of electricity have continued to increase. Their output has risen nearly five-fold in the past decade and their share of the UK total has increased from 7% in 2010 to 37% in 2019.

As a result, the UK’s increasingly renewable grid is seeing more minutes, hours and days during which the likes of wind, solar and biomass collectively outpace all fossil fuels put together, and on some days wind is the main source as well.

The chart below shows the number of days during each year when renewables generated more electricity than fossil fuels in 2019 (red line) and each of the previous four years (blue lines). In total, nearly two-fifths of days in 2019 crossed this threshold.

 Cumulative number of days when the UK has not generated any electricity from coal. Source: BEIS energy trends, BM Reports and Carbon Brief analysis. Chart by Carbon Brief using Highcharts.
There were also four months in 2019 when renewables generated more of the UK’s electricity than fossil fuels: March, August, September and December. The first ever such month came in September 2018 and more are certain to follow.

National Grid, which manages Great Britain’s high-voltage electricity transmission network, is aiming to be able to run the system without fossil fuels by 2025, at least for short periods. At present, it sometimes has to ask windfarm operators to switch off and gas plants to start running in order to keep the electricity grid stable.

Note that biomass accounted for 11% of UK electricity generation in 2019, nearly a third of the total from all renewables. Some two-thirds of the biomass output is from “plant biomass”, primarily wood pellets burnt at Lynemouth in Northumberland and the Drax plant in Yorkshire. The remainder was from an array of smaller sites based on landfill gas, sewage gas or anaerobic digestion.

The CCC says the UK should “move away” from large-scale biomass power plants, once existing subsidy contracts for Drax and Lynemouth expire in 2027.

Using biomass to generate electricity is not zero-carbon and in some circumstances could lead to higher emissions than from fossil fuels. Moreover, there are more valuable uses for the world’s limited supply of biomass feedstock, the CCC says, including carbon sequestration and hard-to-abate sectors with few alternatives.

Methodology
The figures in the article are from Carbon Brief analysis of data from BEIS Energy Trends chapter 5 and chapter 6, as well as from BM Reports. The figures from BM Reports are for electricity supplied to the grid in Great Britain only and are adjusted to include Northern Ireland.

In Carbon Brief’s analysis, the BM Reports numbers are also adjusted to account for electricity used by power plants on site and for generation by plants not connected to the high-voltage national grid. This includes many onshore windfarms, as well as industrial gas combined heat and power plants and those burning landfill gas, waste or sewage gas.

By design, the Carbon Brief analysis is intended to align as closely as possible to the official government figures on electricity generated in the UK, reported in BEIS Energy Trends table 5.1.

Briefly, the raw data for each fuel is in most cases adjusted with a multiplier, derived from the ratio between the reported BEIS numbers and unadjusted figures for previous quarters.

Carbon Brief’s method of analysis has been verified against published BEIS figures using “hindcasting”. This shows the estimates for total electricity generation from fossil fuels or renewables to have been within ±3% of the BEIS number in each quarter since Q4 2017. (Data before then is not sufficient to carry out the Carbon Brief analysis.)

For example, in the second quarter of 2019, a Carbon Brief hindcast estimates gas generation at 33.1TWh, whereas the published BEIS figure was 34.0TWh. Similarly, it produces an estimate of 27.4TWh for renewables, against a BEIS figure of 27.1TWh.

National Grid recently shared its own analysis for electricity in Great Britain during 2019 via its energy dashboard, which differs from Carbon Brief’s figures.


Related News

View more

First US coal plant in years opens where no options exist

Alaska Coal-Fired CHP Plant opens near Usibelli mine, supplying electricity and district heat to UAF; remote location without gas pipelines, low wind and solar potential, and high heating demand shaped fuel choice.


Key Points

A 17 MW coal CHP at UAF producing power and campus heat, chosen for remoteness and lack of gas pipelines.

✅ 17 MW generator supplying electricity and district heat

✅ Near Usibelli mine; limited pipeline access shapes fuel

✅ Alternative options like LNG, wind, solar not cost-effective


One way to boost coal in the US: Find a spot near a mine with no access to oil or natural gas pipelines, where it’s not particularly windy and it’s dark much of the year.

That’s how the first coal-fired plant to open in the U.S. since 2015 bucked the trend in an industry that’s seen scores of facilities close in recent years. A 17-megawatt generator, built for $245 million, is set to open in April at the University of Alaska Fairbanks, just 100 miles from the state’s only coal mine.

“Geography really drove what options are available to us,” said Kari Burrell, the university’s vice chancellor for administrative services, in an interview. “We are not saying this is ideal by any means.”

The new plant is arriving as coal fuels about 25 percent of electrical generation in the U.S., down from 45 percent a decade earlier, even as some forecasts point to a near-term increase in coal-fired generation in 2021. A near-record 18 coal plants closed in 2018, and 14 more are expected to follow this year, according to BloombergNEF.

The biggest bright spot for U.S. coal miners recently has been exports to overseas power plants. At home, one of the few growth areas has been in pizza ovens.

There are a handful of other U.S. coal power projects that have been proposed, including plans to build an 850 megawatt facility in Georgia and an 895 megawatt plant in Kansas, even as a Minnesota utility reports declining coal returns across parts of its portfolio. But Ashley Burke, a spokeswoman for the National Mining Association, said she’s unaware of any U.S. plants actively under development besides the one in Alaska.


Future of power

“The future of power in the U.S. does not include coal,” Tessie Petion, an analyst for HSBC Holdings Plc, said in a research note, a view echoed by regions such as Alberta retiring coal power early in their transition.

Fairbanks sits on the banks of the Chena River, amid the vast subarctic forests in the heart of Alaska. The oil and gas fields of the state’s North slope are 500 miles north. The nearest major port is in Anchorage, 350 miles south.

The university’s new plant is a combined heat and power generator, which will create steam both to generate electricity and heat campus buildings. Before opting for coal, the school looked into using liquid natural gas, wind and solar, bio-mass and a host of other options, as new projects in Southeast Alaska seek lower electricity costs across the region. None of them penciled out, said Mike Ruckhaus, a senior project manager at the university.

The project, financed with university and state-municipal bonds, replaces a coal plant that went into service in 1964. University spokeswoman Marmian Grimes said it’s worth noting that the new plant will emit fewer emissions.

The coal will come from Usibelli Coal Mine Inc., a family-owned business that produces between 1.2 and 2 million tons per year from a mine along the Alaska railroad, according to the company’s website.

While any new plant is good news for coal miners, Clarksons Platou Securities Inc. analyst Jeremy Sussman said this one is "an isolated situation."

“We think the best producers can hope for domestically is a slow down in plant closures,” he said, even as jurisdictions like Alberta close their last coal plant entirely.


Related News

View more

Sign Up for Electricity Forum’s Newsletter

Stay informed with our FREE Newsletter — get the latest news, breakthrough technologies, and expert insights, delivered straight to your inbox.

Electricity Today T&D Magazine Subscribe for FREE

Stay informed with the latest T&D policies and technologies.
  • Timely insights from industry experts
  • Practical solutions T&D engineers
  • Free access to every issue

Live Online & In-person Group Training

Advantages To Instructor-Led Training – Instructor-Led Course, Customized Training, Multiple Locations, Economical, CEU Credits, Course Discounts.

Request For Quotation

Whether you would prefer Live Online or In-Person instruction, our electrical training courses can be tailored to meet your company's specific requirements and delivered to your employees in one location or at various locations.