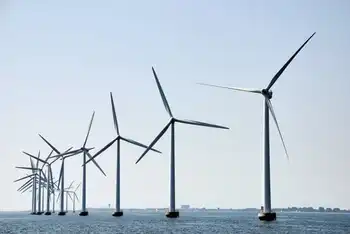
CSU says its wind farm could be running in 2010

By Associated Press


Substation Relay Protection Training

Our customized live online or in‑person group training can be delivered to your staff at your location.

  • Live Online
  • 12 hours Instructor-led
  • Group Training Available
Regular Price:
$699
Coupon Price:
$599
Reserve Your Seat Today
Colorado State University says a wind farm capable of powering its entire campus could be up and running in 2010.

CSU said it's ready to apply for permits to build the wind farm on a Larimer County ranch owned by the university near the Wyoming border.

The university first announced plans for the wind farm in March 2007.

The operation would have at least 25 turbines. The electricity would not be fed directly to the campus but rather would flow into the broader power grid that the campus and other users draw from.

Bill Farland, CSU's vice president for research, says he's optimistic the wind farm can get approval, be constructed and be producing power within two years.

Related News

Explainer: Why nuclear-powered France faces power outage risks

France Nuclear Power Outages threaten the grid as EDF reactors undergo stress corrosion inspections, maintenance delays, and staff shortages, driving electricity imports, peak-demand curtailment plans, and potential rolling blackouts during a cold snap across Europe.


Key Points

EDF maintenance and stress corrosion cut reactor output, forcing imports and blackouts as cold weather lifts demand.

✅ EDF inspects stress corrosion cracks in reactor piping

✅ Maintenance backlogs and skilled labor shortages slow repairs

✅ Government plans demand cuts, imports, and rolling blackouts


France is bracing for possible power outages in the coming days as falling temperatures push up demand while state-controlled nuclear group EDF struggles to bring more production on line.


WHY CAN'T FRANCE MEET DEMAND?
France is one of the most nuclear-powered countries in the world, with a significant role of nuclear power in its energy mix, typically producing over 70% of its electricity with its fleet of 56 reactors and providing about 15% of Europe's total power through exports.

However, EDF (EDF.PA) has had to take a record number of its ageing reactors offline for maintenance this year just as Europe is struggling to cope with cuts in Russian natural gas supplies used for generating electricity, with electricity prices surging across the continent this year.

That has left France's nuclear output at a 30-year low, and mirrors how Europe is losing nuclear power more broadly, forcing France to import electricity and prepare plans for possible blackouts as a cold snap fuels demand for heating.


WHAT ARE EDF'S MAINTENANCE PROBLEMS?
While EDF normally has a number of its reactors offline for maintenance, it has had far more than usual this year due to what is known as stress corrosion on pipes in some reactors, and during heatwaves river temperature limits have constrained output further.

At the request of France's nuclear safety watchdog, EDF is in the process of inspecting and making repairs across its fleet since detecting cracks in the welding connecting pipes in one reactor at the end of last year.

Years of under-investment in the nuclear sector mean that there is precious little spare capacity to meet demand while reactors are offline for maintenance, and environmental constraints such as limits on energy output during high river temperatures reduce flexibility.

France also lacks specialised welders and other workers in sufficient numbers to be able to make repairs fast enough to get reactors back online.


WHAT IS BEING DONE?
In the very short term, after a summer when power markets hit records as plants buckled in heat, there is little that can be done to get more reactors online faster, leaving the government to plan for voluntary cuts at peak demand periods and limited forced blackouts.

In the very short term, there is little that can be done to get more reactors online faster, leaving the government to plan for voluntary cuts at peak demand periods and limited forced blackouts.

Meanwhile, EDF and others in the French nuclear industry are on a recruitment drive for the next generation of welders, pipe-fitters and boiler makers, going so far as to set up a new school to train them.

President Emmanuel Macron wants a new push in nuclear energy, even as a nuclear power dispute with Germany persists, and has committed to building six new reactors at a cost his government estimates at nearly 52 billion euros ($55 billion).

As a first step, the government is in the process of buying out EDF's minority shareholders and fully nationalising the debt-laden group, which it says is necessary to make the long-term investments in new reactors.


Related News

View more

Warning: Manitoba Hydro can't service new 'energy intensive' customers

Manitoba Hydro capacity constraints challenge clean energy growth as industrial demand, hydrogen projects, EV batteries, and electrification strain the grid; limited surplus, renewables, storage, and transmission bottlenecks hinder new high-load connections.


Key Points

Limited surplus power blocks new energy-intensive loads until added generation and transmission expand Manitoba's grid.

✅ No firm commitments for new energy-intensive industrial customers

✅ Single large load could consume remaining surplus capacity

✅ New renewables need transmission; gas, nuclear face trade-offs


Manitoba Hydro lacks the capacity to provide electricity to any new "energy intensive" industrial customers, the Crown corporation warns in a confidential briefing note that undercuts the idea this province can lure large businesses with an ample supply of clean, green energy, as the need for new power generation looms for the utility.

On July 28, provincial economic development officials unveiled an "energy roadmap" that said Manitoba Hydro must double or triple its generating capacity, as electrical demand could double over the next two decades in order to meet industrial and consumer demand for electricity produced without burning fossil fuels.

Those officials said 18 potential new customers with high energy needs were looking at setting up operations in Manitoba — and warned the province must be careful to choose businesses that provide the greatest economic benefit as well as the lowest environmental impact.

In a briefing note dated Sept. 13, obtained by CBC News, Manitoba Hydro warns it doesn't have enough excess power to hook up any of these new heavy electricity-using customers to the provincial power grid.

There are actually 57 proposals to use large volumes of electricity, Hydro says in the note, including eight projects already in the detailed study phase and nine where the proponents are working on construction agreements.

"Manitoba Hydro is unable to offer firm commitments to prospective customers that may align with Manitoba's energy roadmap and/or provincial economic development objectives," Hydro warns in the note, explaining it is legally obliged to serve all existing customers who need more electricity.

"As such, Manitoba Hydro cannot reserve electric supply for particular projects."

Hydro says in the note its "near-term surplus electricity supply" is so limited amid a Western Canada drought that "a single energy-intensive connection may consume all remaining electrical capacity."

Adding more electrical generating capacity won't be easy, even with new turbine investments underway, and will not happen in time to meet demands from customers looking to set up shop in the province, Hydro warns.

The Crown corporation goes on to say it's grappling with numerous requests from existing and prospective energy-intensive customers, mainly for producing hydrogen, manufacturing electric vehicle batteries and switching from fossil fuels to electricity, such as to use electricity for heat in buildings.

In a statement, Hydro said it wants to ensure Manitobans know the corporation is not running out of power — just the ability to meet the needs of large new customers, and continues to provide clean energy to neighboring provinces today.

"The size of loads looking to come to Manitoba are significantly larger than we typically see, and until additional supply is available, that limits our ability to connect them," Hydro spokesperson Bruce Owen said in a statement.

Adding wind power or battery storage, for example, would require the construction of more transmission lines, and deals such as SaskPower's purchase depend on that interprovincial infrastructure as well.

Natural gas plants are relatively inexpensive to build but do not align with efforts to reduce carbon emissions. Nuclear power plants require at least a decade of lead time to build, and tend to generate local opposition.

Hydro has also ruled out building another hydroelectric dam on the Nelson River, where the Conawapa project was put on hold in 2014.


Related News

View more

UK low-carbon electricity generation stalls in 2019

UK low-carbon electricity 2019 saw stalled growth as renewables rose slightly, wind expanded, nuclear output fell, coal hit record lows, and net-zero targets demand faster deployment to cut CO2 intensity below 100gCO2/kWh.


Key Points

Low-carbon sources supplied 54% of UK power in 2019, up just 1TWh; wind grew, nuclear fell, and coal dropped to 2%.

✅ Wind up 8TWh; nuclear down 9TWh amid outages

✅ Fossil fuels 43% of generation; coal at 2%

✅ Net-zero needs 15TWh per year added to 2030


The amount of electricity generated by low-carbon sources in the UK stalled in 2019, Carbon Brief analysis shows.

Low-carbon electricity output from wind, solar, nuclear, hydro and biomass rose by just 1 terawatt hour (TWh, less than 1%) in 2019. It represents the smallest annual increase in a decade, where annual growth averaged 9TWh. This growth will need to double in the 2020s to meet UK climate targets while replacing old nuclear plants as they retire.

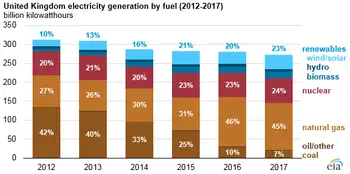
Some 54% of UK electricity generation in 2019 came from low-carbon sources, including 37% from renewables and 20% from wind alone, underscoring wind's leading role in the power mix during key periods. A record-low 43% was from fossil fuels, with 41% from gas and just 2% from coal, also a record low. In 2010, fossil fuels generated 75% of the total.

Carbon Brief’s analysis of UK electricity generation in 2019 is based on figures from BM Reports and the Department for Business, Energy and Industrial Strategy (BEIS). See the methodology at the end for more on how the analysis was conducted.

The numbers differ from those published earlier in January by National Grid, which were for electricity supplied in Great Britain only (England, Wales and Scotland, but excluding Northern Ireland), including via imports from other countries.

Low-carbon low
In 2019, the UK became the first major economy to target net-zero greenhouse gas emissions by 2050, increasing the ambition of its legally binding Climate Change Act.

To date, the country has cut its emissions by around two-fifths since 1990, with almost all of its recent progress coming from the electricity sector.

Emissions from electricity generation have fallen rapidly in the decade since 2010 as coal power has been almost phased out and even gas output has declined. Fossil fuels have been displaced by falling demand and by renewables, such as wind, solar and biomass.

But Carbon Brief’s annual analysis of UK electricity generation shows progress stalled in 2019, with the output from low-carbon sources barely increasing compared to a year earlier.

The chart below shows low-carbon generation in each year since 2010 (grey bars) and the estimated level in 2019 (red). The pale grey bars show the estimated future output of existing low-carbon sources after old nuclear plants retire and the pale red bars show the amount of new generation needed to keep electricity sector emissions to less than 100 grammes of CO2 per kilowatt hour (gCO2/kWh), the UK’s nominal target for the sector.

 Annual electricity generation in the UK by fuel, terawatt hours, 2010-2019. Top panel: fuel by fuel. Bottom panel: cumulative total generation from all sources. Source: BEIS energy trends, BM Reports and Carbon Brief analysis. Chart by Carbon Brief using Highcharts.
As the chart shows, the UK will require significantly more low-carbon electricity over the next decade as part of meeting its legally binding climate goals.

The nominal 100gCO2/kWh target for 2030 was set in the context of the UK’s less ambitious goal of cutting emissions to 80% below 1990 levels by 2050. Now that the country is aiming to cut emissions to net-zero by 2050, that 100gCO2/kWh indicator is likely to be the bare minimum.

Even so, it would require a rapid step up in the pace of low-carbon expansion, compared to the increases seen over the past decade. On average, low-carbon generation has risen by 9TWh each year in the decade since 2010 – including a rise of just 1TWh in 2019.

Given scheduled nuclear retirements and rising demand expected by the Committee on Climate Change (CCC) – with some electrification of transport and heating – low-carbon generation would need to increase by 15TWh each year until 2030, just to meet the benchmark of 100gCO2/kWh.

For context, the 3.2 gigawatt (GW) Hinkley C new nuclear plant being built in Somerset will generate around 25TWh once completed around 2026. The world’s largest offshore windfarm, the 1.2GW Hornsea One scheme off the Yorkshire coast, will generate around 5TWh each year.

The new Conservative government is targeting 40GW of offshore wind by 2030, up from today’s figure of around 8GW. If policies are put in place to meet this goal, then it could keep power sector emissions below 100gCO2/kWh, depending on the actual performance of the windfarms built.

However, new onshore wind and solar, further new nuclear or other low-carbon generation, such as gas with carbon capture and storage (CCS), is likely to be needed if demand is higher than expected, or if the 100gCO2/kWh benchmark is too weak in the context of net-zero by 2050.

The CCC says it is “likely” to “reflect the need for more rapid deployment” of low-carbon towards net-zero emissions in its advice on the sixth UK carbon budget for 2033-2037, due in September.

Trading places
Looking more closely at UK electricity generation in 2019, Carbon Brief’s analysis shows why there was so little growth for low-carbon sources compared to the previous year.

There was another increase for wind power in 2019 (up 8TWh, 14%), with record wind generation as several large new windfarms were completed including the 1.2GW Hornsea One project in October and the 0.6GW Beatrice offshore windfarm in Q2 of 2019. But this was offset by a decline for nuclear (down 9TWh, 14%), due to ongoing outages for reactors at Hunterston in Scotland and Dungeness in Kent.

(Analysis of data held by trade organisation RenewableUK suggests some 0.6GW of onshore wind capacity also started operating in 2019, including the 0.2GW Dorenell scheme in Moray, Scotland.)

As a result of these movements, the UK’s windfarms overtook nuclear for the first time ever in 2019, becoming the country’s second-largest source of electricity generation, and earlier, wind and solar together surpassed nuclear in the UK as momentum built. This is shown in the figure below, with wind (green line, top panel) trading places with nuclear (purple) and gas (dark blue) down around 25% since 2010 but remaining the single-largest source.

 Annual electricity generation in the UK by fuel, terawatt hours, 2010-2019. Top panel: fuel by fuel. Bottom panel: cumulative total generation from all sources. Source: BEIS energy trends, BM Reports and Carbon Brief analysis. Chart by Carbon Brief using Highcharts.
The UK’s currently suspended nuclear plants are due to return to service in January and March, according to operator EDF, the French state-backed utility firm. However, as noted above, most of the UK’s nuclear fleet is set to retire during the 2020s, with only Sizewell B in Suffolk due to still be operating by 2030. Hunterston is scheduled to retire by 2023 and Dungeness by 2028.

Set against these losses, the UK has a pipeline of offshore windfarms, secured via “contracts for difference” with the government, at a series of auctions. The most recent auction, in September 2019, saw prices below £40 per megawatt hour – similar to current wholesale electricity prices.

However, the capacity contracted so far is not sufficient to meet the government’s target of 40GW by 2030, meaning further auctions – or some other policy mechanism – will be required.

Coal zero
As well as the switch between wind and nuclear, 2019 also saw coal fall below solar for the first time across a full year, echoing the 2016 moment when wind outgenerated coal across the UK, after it suffered another 60% reduction in electricity output. Just six coal plants remain in the UK, with Aberthaw B in Wales and Fiddlers Ferry in Cheshire closing in March.

Coal accounted for just 2% of UK generation in 2019, a record-low coal share since centralised electricity supplies started to operate in 1882. The fuel met 40% of UK needs as recently as 2012, but has plummeted thanks to falling demand, rising renewables, cheaper gas and higher CO2 prices.

The reduction in average coal generation hides the fact that the fuel is now often not required at all to meet the UK’s electricity needs. The chart below shows the number of days each year when coal output was zero in 2019 (red line) and the two previous years (blue).

 Cumulative number of days when UK electricity generation from renewable sources has been higher than that from fossil fuels. Source: BEIS energy trends, BM Reports and Carbon Brief analysis. Chart by Carbon Brief using Highcharts.
The 83 days in 2019 with zero coal generation amount to nearly a quarter of the year and include the record-breaking 18-day stretch without the fuel.

Great Britain has been running for a record TWO WEEKS without using coal to generate electricity – the first time this has happened since 1882.

The country’s grid has been coal-free for 45% of hours in 2019 so far.https://www.carbonbrief.org/countdown-to-2025-tracking-the-uk-coal-phase-out …

Coal generation was set for significant reductions around the world in 2019 – including a 20% reduction for the EU as a whole – according to analysis published by Carbon Brief in November.

Notably, overall UK electricity generation fell by another 9TWh in 2019 (3%), bringing the total decline to 58TWh since 2010. This is equivalent to more than twice the output from the Hinkley C scheme being built in Somerset. As Carbon Brief explained last year, falling demand has had a similar impact on electricity-sector CO2 emissions as the increase in output from renewables.

This is illustrated by the fact that the 9TWh reduction in overall generation translated into a 9TWh (6%) cut in fossil-fuel generation during 2019, with coal falling by 10TWh and gas rising marginally.

Increasingly renewable
As fossil-fuel output and overall generation have declined, the UK’s renewable sources of electricity have continued to increase. Their output has risen nearly five-fold in the past decade and their share of the UK total has increased from 7% in 2010 to 37% in 2019.

As a result, the UK’s increasingly renewable grid is seeing more minutes, hours and days during which the likes of wind, solar and biomass collectively outpace all fossil fuels put together, and on some days wind is the main source as well.

The chart below shows the number of days during each year when renewables generated more electricity than fossil fuels in 2019 (red line) and each of the previous four years (blue lines). In total, nearly two-fifths of days in 2019 crossed this threshold.

 Cumulative number of days when the UK has not generated any electricity from coal. Source: BEIS energy trends, BM Reports and Carbon Brief analysis. Chart by Carbon Brief using Highcharts.
There were also four months in 2019 when renewables generated more of the UK’s electricity than fossil fuels: March, August, September and December. The first ever such month came in September 2018 and more are certain to follow.

National Grid, which manages Great Britain’s high-voltage electricity transmission network, is aiming to be able to run the system without fossil fuels by 2025, at least for short periods. At present, it sometimes has to ask windfarm operators to switch off and gas plants to start running in order to keep the electricity grid stable.

Note that biomass accounted for 11% of UK electricity generation in 2019, nearly a third of the total from all renewables. Some two-thirds of the biomass output is from “plant biomass”, primarily wood pellets burnt at Lynemouth in Northumberland and the Drax plant in Yorkshire. The remainder was from an array of smaller sites based on landfill gas, sewage gas or anaerobic digestion.

The CCC says the UK should “move away” from large-scale biomass power plants, once existing subsidy contracts for Drax and Lynemouth expire in 2027.

Using biomass to generate electricity is not zero-carbon and in some circumstances could lead to higher emissions than from fossil fuels. Moreover, there are more valuable uses for the world’s limited supply of biomass feedstock, the CCC says, including carbon sequestration and hard-to-abate sectors with few alternatives.

Methodology
The figures in the article are from Carbon Brief analysis of data from BEIS Energy Trends chapter 5 and chapter 6, as well as from BM Reports. The figures from BM Reports are for electricity supplied to the grid in Great Britain only and are adjusted to include Northern Ireland.

In Carbon Brief’s analysis, the BM Reports numbers are also adjusted to account for electricity used by power plants on site and for generation by plants not connected to the high-voltage national grid. This includes many onshore windfarms, as well as industrial gas combined heat and power plants and those burning landfill gas, waste or sewage gas.

By design, the Carbon Brief analysis is intended to align as closely as possible to the official government figures on electricity generated in the UK, reported in BEIS Energy Trends table 5.1.

Briefly, the raw data for each fuel is in most cases adjusted with a multiplier, derived from the ratio between the reported BEIS numbers and unadjusted figures for previous quarters.

Carbon Brief’s method of analysis has been verified against published BEIS figures using “hindcasting”. This shows the estimates for total electricity generation from fossil fuels or renewables to have been within ±3% of the BEIS number in each quarter since Q4 2017. (Data before then is not sufficient to carry out the Carbon Brief analysis.)

For example, in the second quarter of 2019, a Carbon Brief hindcast estimates gas generation at 33.1TWh, whereas the published BEIS figure was 34.0TWh. Similarly, it produces an estimate of 27.4TWh for renewables, against a BEIS figure of 27.1TWh.

National Grid recently shared its own analysis for electricity in Great Britain during 2019 via its energy dashboard, which differs from Carbon Brief’s figures.


Related News

View more

Here are 3 ways to find out where your electricity comes from

US energy mix shows how the electric grid blends renewables, fossil fuels, nuclear, and hydro, varying by ISO/RTO markets, utilities, and state policies, affecting carbon emissions, pricing, reliability, and access.


Key Points

The US energy mix is the grid's source breakdown by region: fossil fuels, renewables, nuclear, and hydro.

✅ Check ISO or RTO dashboards for real-time generation by fuel source.

✅ Utilities may offer green power plans or RECs at modest premiums.

✅ Energy mix shifts with policy, pricing, and grid reliability needs.


There are few resources more important than energy. Sure, you may die if you don't eat for days. But your phone will die if you go too long without charging it. Energy feeds tech, the internet, city infrastructure, refrigerators, lights, and has evolved throughout U.S. history in profound ways. You get the idea. Yet unlike our other common needs, such as food, energy sources aren't exactly front of mind for most people. 

"I think a lot of people don't put a lot of bandwidth into thinking about this part of their lives," said Richard McMahon, the SVP of energy supply and finance at Edison Electric Institute, a trade group that represents investor-owned electric companies in the US. 

It makes sense. For most Americans, electricity is always there, and in many locations, there's not much of a choice involved, even as electricity demand is flat across the U.S. today. You sign up with a utility when you move into a new residence and pay your bills when they're due. 

But there's an important reality that indifference eschews: In 2018, a third of the energy-related carbon-dioxide emissions in the US came from the electric power sector, according to the US Energy Information Administration (EIA). 

A good chunk of that is from the residential sector, which consistently uses more energy than commercial customers, per EIA data.

Just as many people exercise choice when they eat, you typically also have a choice when it comes to your energy supply. That's not to say your current offering isn't what you want, or that switching will be easy or affordable, but "if you're a customer and want power with a certain attribute," McMahon said, "you can pretty much get it wherever you are." 

But first, you need to know the energy mix you have right now. As it turns out, it's not so straightforward. At all.

This brief guide may help. 

For some utility providers, you can find out if it publishes the energy mix online. Dominion Energy, which serves Idaho, North Carolina, Ohio, South Carolina, Utah, Virginia, West Virginia, and Wyoming, provides this information in a colored graphic. 

"Once you figure out who your utility is you can figure out what mix of resources they use," said Heidi Ratz, an electricity markets researcher at the World Resources Institute.

But not all utilities publish this information.

It has to do with their role in the grid and reflects utility industry trends in structure and markets. Some utility companies are vertically integrated; they generate power through nuclear plants or wind farms and distribute those electrons directly to their customers. Other utilities just distribute the power that different companies produce. 

Consider Consolidated Edison, or Con Ed, which distributes energy to parts of New York City. While reporting this story, Business Insider could not find information about the utility's energy mix online. When reached for comment, a spokesperson said, "we're indifferent to where it comes from."

That's because, in New York, distribution utilities like Con Ed often buy energy through a wholesale marketplace.

Take a look at this map. If you live in one of the colored regions, your electricity is sold on a wholesale market regulated by an organization called a regional transmission organization (RTO) or independent system operator (ISO). Distribution utilities like Con Ed often buy their energy through these markets, based on availability and cost, while raising questions about future utility revenue models as prices shift. 

Still, it's pretty easy to figure out where your energy comes from. Just look up the ISO or RTO website (such as NYISO or CAISO). Usually, these organizations will provide energy supply information in near-real time. 

That's exactly what Con Edison (which buys energy on the NYISO marketplace) suggested. As of Friday morning, roughly 40% of the energy on the market place was natural gas or other fossil fuels, 34% was nuclear, and about 22% was hydro. 

If you live in another region governed by an ISO or RTO, such as in most of California, you can do the same thing. Like NYISO, CAISO has a dashboard that shows (again, as of Friday morning) about 36% of the energy on the market comes from natural gas and more than 20% comes from renewables. 

In the map linked above, you'll notice that some of the ISOs and RTOs like MISO encompass enormous regions. That means that even if you figure out where the energy in your market comes from, it's not going to be geographically specific. But there are a couple of ways to drill down even further. 

The Environmental Protection Agency has a straightforward tool called Power Profiler. You can enter your zip code to see the fuel mix in your area. But it's not perfect. The data are from 2016 and, in some regions of the country like the upper Midwest, they aren't much more localized, and some import dirty electricity due to regional trading. 

The World Resources Institute also has a tool that allows you to see the electricity mix by state, based on 2017 data from EIA. These numbers represent power generation, not the electricity actually flowing into your sockets, but they offer a rough idea of what energy resources are operating in your state. 

One option is to check with your utility to see if it has a "green power" offering. Over 600 utilities across the country have one, according to the Climate Reality Project, though they often come at a slightly higher cost. It's typically on the scale of just a few more cents per kilowatt-hour. 

There are also independent, consumer-facing companies like Arcadia and Green Mountain Energy that allow you to source renewable energy, by virtually connecting you to community solar projects or purchasing Renewable Energy Certificates, or RECs, on your behalf, as America goes electric and more options emerge. 

"RECs measure an investment in a clean energy resource," Ratz said, in an email. "The goal of putting that resource on the grid is to push out the need for dirtier resources."

The good news: Even if you do nothing, your energy mix will get cleaner. Coal production has fallen to lows not seen since the 1980s, amid disruptions in coal and nuclear sectors that affect reliability and costs, while renewable electricity generation has doubled since 2008. So whether you like it or not, you'll be roped into the clean energy boom one way or another. 


Related News

View more

Biden Imposes Higher Tariffs on Chinese Electric Cars and Solar Cells

U.S. Tariffs on Chinese EVs and Solar Cells target trade imbalances, subsidies, and intellectual property risks, bolstering domestic manufacturing, supply chains, and national security across clean energy, automotive technology, and renewable markets.


Key Points

Policy measures raising duties on Chinese EVs and solar cells to protect U.S. industry, IP, and national security.

✅ Raises duties to counter subsidies and IP risks

✅ Supports domestic EV and solar manufacturing jobs

✅ May reshape supply chains, prices, and trade flows


In a significant move aimed at bolstering domestic industries and addressing trade imbalances, the Biden administration has announced higher tariffs on Chinese-made electric cars and solar cells. This decision marks a strategic shift in U.S. trade policy, with market observers noting EV tariffs alongside industrial and financial implications across sectors today.

Tariffs on Electric Cars

The imposition of tariffs on Chinese electric cars comes amidst growing competition in the global electric vehicle (EV) market. U.S. automakers and policymakers have raised concerns about unfair trade practices, subsidies, and market access barriers faced by American EV manufacturers in China amid escalating trade tensions with key partners. The tariffs aim to level the playing field and protect U.S. interests in the burgeoning electric vehicle sector.

Impact on Solar Cells

Similarly, higher tariffs on Chinese solar cells address concerns regarding intellectual property theft, subsidies, and market distortions in the solar energy industry, where tariff threats have influenced investment signals across North American markets.

The U.S. solar sector, a key player in renewable energy development, has called for measures to safeguard fair competition and promote domestic manufacturing of solar technologies.

Economic and Political Implications

The tariff hikes underscore broader economic tensions between the United States and China, spanning trade, technology, and geopolitical issues. While aimed at protecting American industries, these tariffs could lead to retaliatory measures from China and impact global supply chains, particularly in renewable energy and automotive sectors, as North American electricity exports at risk add to uncertainty across markets.

Industry and Market Responses

Industry stakeholders have responded with mixed reactions to the tariff announcements. U.S. automakers and solar manufacturers supportive of the tariffs argue they will help level the playing field and encourage domestic production. However, critics warn of potential energy price spikes for consumers, supply chain disruptions, and unintended consequences for global clean energy goals.

Strategic Considerations

The Biden administration's tariff policy reflects a broader strategy to promote economic resilience, innovation, and national security in critical industries, even as cross-border electricity exports become flashpoints in trade policy debates today.

Efforts to strengthen domestic supply chains, invest in renewable energy infrastructure, and foster international partnerships remain central to U.S. economic competitiveness and climate objectives.

Future Outlook

Looking ahead, navigating U.S.-China trade relations will continue to be a complex challenge for policymakers. Balancing economic interests, diplomatic engagements, and environmental priorities, alongside regional public support for tariffs, will shape future trade policy decisions affecting electric vehicles, renewable energy, and technology sectors globally.

Conclusion

The Biden administration's decision to impose higher tariffs on Chinese electric cars and solar cells represents a strategic response to economic and geopolitical dynamics reshaping global markets. While aimed at protecting American industries and promoting fair trade practices, the tariffs signal a commitment to fostering competitiveness, innovation, and sustainability in critical sectors of the economy. As these measures unfold, stakeholders will monitor their impact on industry dynamics, supply chain resilience, and international trade relations in the evolving landscape of global commerce.


Related News

View more

Europe Stores Electricity in Natural Gas Pipes

Power-to-gas converts surplus renewable electricity into green hydrogen or synthetic methane via electrolysis and methanation, enabling seasonal energy storage, grid balancing, hydrogen injection into gas pipelines, and decarbonization of heat, transport, and industry.


Key Points

Power-to-gas turns excess renewable power into hydrogen or methane for storage, grid support, and clean fuel.

✅ Enables hydrogen injection into existing natural gas networks

✅ Balances grids and provides seasonal energy storage capacity

✅ Supplies low-carbon fuels for industry, heat, and heavy transport


Last month Denmark’s biggest energy firm, Ørsted, said wind farms it is proposing for the North Sea will convert some of their excess power into gas. Electricity flowing in from offshore will feed on-shore electrolysis plants that split water to produce clean-burning hydrogen, with oxygen as a by-product. That would supply a new set of customers who need energy, but not as electricity. And it would take some strain off of Europe’s power grid as it grapples with an ever-increasing share of hard-to-handle EU wind and solar output on the grid.

Turning clean electricity into energetic gases such as hydrogen or methane is an old idea that is making a comeback as renewable power generation surges and crowds out gas in Europe. That is because gases can be stockpiled within the natural gas distribution system to cover times of weak winds and sunlight. They can also provide concentrated energy to replace fossil fuels for vehicles and industries. Although many U.S. energy experts argue that this “power-to-gas” vision may be prohibitively expensive, some of Europe’s biggest industrial firms are buying in to the idea.

European power equipment manufacturers, anticipating a wave of renewable hydrogen projects such as Ørsted’s, vowed in January that, as countries push for hydrogen-ready power plants across Europe, all of their gas-fired turbines will be certified by next year to run on up to 20 percent hydrogen, which burns faster than methane-rich natural gas. The natural gas distributors, meanwhile, have said they will use hydrogen to help them fully de-carbonize Europe’s gas supplies by 2050.

Converting power to gas is picking up steam in Europe because the region has more consistent and aggressive climate policies and evolving electricity pricing frameworks that support integration. Most U.S. states have goals to clean up some fraction of their electricity supply; coal- and gas-fired plants contribute a little more than a quarter of U.S. greenhouse gas emissions. In contrast, European countries are counting on carbon reductions of 80 percent or more by midcentury—reductions that will require an economywide switch to low-carbon energy.

Cleaning up energy by stripping the carbon out of fossil fuels is costly. So is building massive new grid infrastructure, including transmission lines and huge batteries, amid persistent grid expansion woes in parts of Europe. Power-to-gas may be the cheapest way forward, complementing Germany’s net-zero roadmap to cut electricity costs by a third. “In order to reach the targets for climate protection, we need even more renewable energy. Green hydrogen is perceived as one of the most promising ways to make the energy transition happen,” says Armin Schnettler, head of energy and electronics research at Munich-based electric equipment giant Siemens.

Europe already has more than 45 demonstration projects to improve power-to-gas technologies and their integration with power grids and gas networks. The principal focus has been to make the electrolyzers that convert electricity to hydrogen more efficient, longer-lasting and cheaper to produce.

The projects are also scaling up the various technologies. Early installations converted a few hundred kilowatts of electricity, but manufacturers such as Siemens are now building equipment that can convert 10 megawatts, which would yield enough hydrogen each year to heat around 3,000 homes or fuel 100 buses, according to financial consultancy Ernst & Young.

The improvements have been most dramatic for proton-exchange membrane electrolyzers, which are akin to the fuel cells used in hydrogen vehicles (but optimized to produce hydrogen rather than consume it). The price of proton-exchange electrolyzers has dropped by roughly 40 percent during the past decade, according to a study published in February in Nature Energy. They are also five times more compact than older alkaline electrolysis plants, enabling onsite hydrogen production near gas consumers, and they can vary their power consumption within seconds to operate on fluctuating wind and solar generation.

Many European pilot projects are demonstrating “methanation” equipment that converts hydrogen to methane, too, which can be used as a drop-in replacement for natural gas. Europe’s electrolyzer plants, however, are showing that methanation is not as critical to the power-to-gas vision as advocates long believed. Many electrolyzers are injecting their hydrogen directly into natural gas pipelines—something that U.S. gas firms forbid—and they are doing so without impacting either the gas infrastructure or natural gas consumers.

Europe’s first large-scale hydrogen injection began in eastern Germany in 2013 at a two-megawatt electrolyzer installed by Essen-based power firm E.ON. Germany has since ratcheted up the amount of hydrogen it allows in natural gas lines from an initial 2 percent by volume to 10 percent, in a market where renewables now outpace coal and nuclear in Germany, and other European states have followed suit with their own hydrogen allowances. Christopher Hebling, head of hydrogen technologies at the Freiburg-based Fraunhofer Institute for Solar Energy Systems, predicts that such limits will rise to the 20-percent level anticipated by Europe’s turbine manufacturers.

Moving renewable hydrogen and methane via natural gas pipelines promises to cut the cost of switching to renewable energy. For example, gas networks have storage caverns whose reserves could be tapped to run gas-fired electric generation power plants during periods of low wind and solar output. Hebling notes that Germany’s gas network can store 240 terawatt-hours of energy—roughly 25 times more energy than global power grids can presently store by pumping water uphill to refill hydropower reservoirs. Repurposing gas infrastructure to help the power system could save European consumers 138 billion euros ($156 billion) by 2050, according to Dutch energy consultancy Navigant (formerly Ecofys).

For all the pilot plants and promise, renewable hydrogen presently supplies a tiny fraction of Europe’s gas. And, globally, around 4 percent of hydrogen is supplied via electrolysis, with the bulk refined from fossil fuels, according to the International Renewable Energy Agency.

Power-to-gas is catching up, however. According to the February Nature Energy study, renewable hydrogen already pays for itself in some niche applications, and further electrolyzer improvements will progressively extend its market. “If costs continue to decline as they have done in recent years, power-to-gas will become competitive at large scale within the next decade,” says study co-author Gunther Glenk, an economist at the Technical University of Munich.

Glenk says power-to-gas could scale up faster if governments guaranteed premium prices for renewable hydrogen and methane, as they did to mainstream solar and wind power.

Tim Calver, an energy storage researcher turned consultant and Ernst & Young’s executive director in London, agrees that European governments need to step up their support for power-to-gas projects and markets. Calver calls the scale of funding to date, “not proportionate to the challenge that we face on long-term decarbonization and the potential role of hydrogen.”


Related News

View more

Sign Up for Electricity Forum’s Newsletter

Stay informed with our FREE Newsletter — get the latest news, breakthrough technologies, and expert insights, delivered straight to your inbox.

Electricity Today T&D Magazine Subscribe for FREE

Stay informed with the latest T&D policies and technologies.
  • Timely insights from industry experts
  • Practical solutions T&D engineers
  • Free access to every issue

Download the 2025 Electrical Training Catalog

Explore 50+ live, expert-led electrical training courses –

  • Interactive
  • Flexible
  • CEU-cerified