Polycrystalline Tin Selenide Thermoelectrics enable waste heat recovery with ZT 3.1, matching single crystals while cutting costs, powering greener car engines, industrial furnaces, and thermoelectric generators via p-type and emerging n-type designs.
Key Points
Low-cost tin selenide devices that turn waste heat into power, achieving ZT 3.1 and enabling p-type and n-type modules.
✅ Oxygen removal prevents heat-leaking tin oxide grain skins.
✅ Polycrystalline ingots match single-crystal ZT 3.1 at lower cost.
✅ N-type tin selenide in development to pair with p-type.
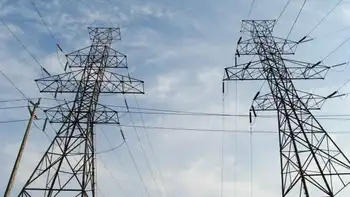
So-called thermoelectric generators turn waste heat into electricity without producing greenhouse gas emissions, providing what seems like a free lunch. But despite helping power the Mars rovers, the high cost of these devices has prevented their widespread use. Now, researchers have found a way to make cheap thermoelectrics that work just as well as the pricey kind. The work could pave the way for a new generation of greener car engines, industrial furnaces, and other energy-generating devices.
“This looks like a very smart way to realize high performance,” says Li-Dong Zhao, a materials scientist at Beihang University who was not involved with the work. He notes there are still a few more steps to take before these materials can become high-performing thermoelectric generators. However, he says, “I think this will be used in the not too far future.”
Thermoelectrics are semiconductor devices placed on a hot surface, like a gas-powered car engine or on heat-generating electronics using thin-film converters to capture waste heat. That gives them a hot side and a cool side, away from the hot surface. They work by using the heat to push electrical charges from one to the other, a process of turning thermal energy into electricity that depends on the temperature gradient. If a device allows the hot side to warm up the cool side, the electricity stops flowing. A device’s success at preventing this, as well as its ability to conduct electrons, feeds into a score known as the figure of merit, or ZT.
Over the past 2 decades, researchers have produced thermoelectric materials with increasing ZTs, while related advances such as nighttime solar cells have broadened thermal-to-electric concepts. The record came in 2014 when Mercouri Kanatzidis, a materials scientist at Northwestern University, and his colleagues came up with a single crystal of tin selenide with a ZT of 3.1. Yet the material was difficult to make and too fragile to work with. “For practical applications, it’s a non-starter,” Kanatzidis says.
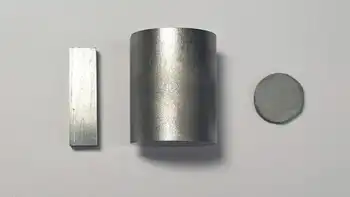
So, his team decided to make its thermoelectrics from readily available tin and selenium powders, an approach that, once processed, makes grains of polycrystalline tin selenide instead of the single crystals. The polycrystalline grains are cheap and can be heated and compressed into ingots that are 3 to 5 centimeters long, which can be made into devices. The polycrystalline ingots are also more robust, and Kanatzidis expected the boundaries between the individual grains to slow the passage of heat. But when his team tested the polycrystalline materials, the thermal conductivity shot up, dropping their ZT scores as low as 1.2.
In 2016, the Northwestern team discovered the source of the problem: an ultrathin skin of tin oxide was forming around individual grains of polycrystalline tin selenide before they were pressed into ingots. And that skin acted as an express lane for the heat to travel from grain to grain through the material. So, in their current study, Kanatzidis and his colleagues came up with a way to use heat to drive any oxygen away from the powdery precursors, leaving pristine polycrystalline tin selenide, whereas other devices can generate electricity from thin air using ambient moisture.
The result, which they report today in Nature Materials, was not only a thermal conductivity below that of single-crystal tin selenide but also a ZT of 3.1, a development that echoes nighttime renewable devices showing electricity from cold conditions. “This opens the door for new devices to be built from polycrystalline tin selenide pellets and their applications to be explored,” Kanatzidis says.
Getting through that door will still take some time. The polycrystalline tin selenide the team makes is spiked with sodium atoms, creating what is known as a “p-type” material that conducts positive charges. To make working devices, researchers also need an “n-type” version to conduct negative charges.
Zhao’s team recently reported making an n-type single-crystal tin selenide by spiking it with bromine atoms. And Kanatzidis says his team is now working on making an n-type polycrystalline version. Once n-type and p-type tin selenide devices are paired, researchers should have a clear path to making a new generation of ultra-efficient thermoelectric generators. Those could be installed everywhere from automobile exhaust pipes to water heaters and industrial furnaces to scavenge energy from some of the 65% of fossil fuel energy that winds up as waste heat.
Related News