Ontario tables legislation to lower electricity rates


lower Ontario electricity rates

Substation Relay Protection Training

Our customized live online or in‑person group training can be delivered to your staff at your location.

  • Live Online
  • 12 hours Instructor-led
  • Group Training Available
Regular Price:
$699
Coupon Price:
$599
Reserve Your Seat Today

Ontario Clean Energy Adjustment lowers hydro bills by shifting global adjustment costs, cutting time-of-use rates, and using OPG debt financing; ratepayers get inflation-capped increases for four years, then repay costs over 20 years.


Key Points

A 20-year line item repaying debt used to lower rates for 10 years by shifting global adjustment costs off hydro bills.

✅ 17% average bill cut takes effect after royal assent

✅ OPG-managed entity assumes debt for 10 years

✅ 20-year surcharge repays up to $28B plus interest


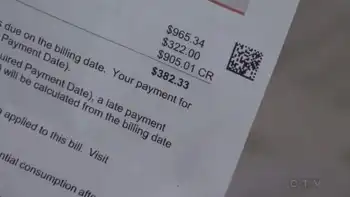
Ontarians will see lowered hydro bills for the next 10 years, but will then pay higher costs for the following 20 years, under new legislation tabled Thursday.

Ten weeks after announcing its plan to lower hydro bills, the Liberal government introduced legislation to lower time-of-use rates, take the cost of low-income and rural support programs off bills, and introduce new social programs.

It will lower time-of-use rates by removing from bills a portion of the global adjustment, a charge consumers pay for above-market rates to power producers. For the next 10 years, a new entity overseen by Ontario Power Generation will take on debt to pay that difference.

Then, the cost of paying back that debt with interest -- which the government says will be up to $28 billion -- will go back onto ratepayers' bills for the next 20 years as a "Clean Energy Adjustment."

An average 17-per-cent cut to bills will take effect 15 days after the hydro legislation receives royal assent, even as a Nov. 1 rate increase was set by the Ontario Energy Board, but there are just eight sitting days left before the Ontario legislature breaks for the summer. Energy Minister Glenn Thibeault insisted that leaves the opposition "plenty" of time for review and debate.

Premier Kathleen Wynne promised to cut hydro bills and later defended a 25% rate cut after widespread anger over rising costs helped send her approval ratings to record lows.

Electricity bills in the province have roughly doubled in the last decade, due in part to green energy initiatives, and Thibeault said the goal of this plan is to better spread out those costs.

"Like the mortgage on your house, this regime will cost more as we refinance over a longer period of time, but this is a more equitable and fair approach when we consider the lifespan of the clean energy investments, and generating stations across our province," he said.

NDP critic Peter Tabuns called it a "get-through-the-election" next June plan.

"We're going to take on a huge debt so Kathleen Wynne can look good on the hustings in the next few months and for decades we're going to pay for it," he said.

The legislation also holds rate increases to inflation for the next four years. After that, they'll rise more quickly, as illustrated by a leaked cabinet document the Progressive Conservatives unveiled Thursday.

The Liberals dismissed the document as containing outdated projections, but confirmed that it went before cabinet at some point before the government decided to go ahead with the hydro plan.

From about 2027 onward -- when consumers would start paying off the debt associated with the hydro plan -- Ontario electricity consumers will be paying about 12 per cent more than they would without the Liberal government's plan to cut costs in the short term, even though a deal with Quebec was not expected to reduce hydro bills, the government document projected.

But that was just one of many projections, said Energy Minister Glenn Thibeault.

"We have been working on this plan for months, and as we worked on it the documents and calculations evolved," he said.

The government's long-term energy plan is set to be updated this spring, and Thibeault said it will provide a more accurate look at how the hydro plan will reduce rates, even as a recovery rate could lead to higher hydro bills in certain circumstances.

Progressive Conservative critic Todd Smith said the "Clean Energy Adjustment" is nothing more than a revamped debt retirement charge, which was on bills from 2002 to 2016 to pay down debt left over from the old Ontario Hydro, the province's giant electrical utility that was split into multiple agencies in 1999 under the previous Conservative government.

"The minister can call it whatever he wants but it's right there in the graph, that there is going to be a new charge on the line," Smith said. "It's the debt retirement charge on steroids."


Related News

Related News

UK low-carbon electricity generation stalls in 2019

UK low-carbon electricity 2019 saw stalled growth as renewables rose slightly, wind expanded, nuclear output fell, coal hit record lows, and net-zero targets demand faster deployment to cut CO2 intensity below 100gCO2/kWh.


Key Points

Low-carbon sources supplied 54% of UK power in 2019, up just 1TWh; wind grew, nuclear fell, and coal dropped to 2%.

✅ Wind up 8TWh; nuclear down 9TWh amid outages

✅ Fossil fuels 43% of generation; coal at 2%

✅ Net-zero needs 15TWh per year added to 2030


The amount of electricity generated by low-carbon sources in the UK stalled in 2019, Carbon Brief analysis shows.

Low-carbon electricity output from wind, solar, nuclear, hydro and biomass rose by just 1 terawatt hour (TWh, less than 1%) in 2019. It represents the smallest annual increase in a decade, where annual growth averaged 9TWh. This growth will need to double in the 2020s to meet UK climate targets while replacing old nuclear plants as they retire.

Some 54% of UK electricity generation in 2019 came from low-carbon sources, including 37% from renewables and 20% from wind alone, underscoring wind's leading role in the power mix during key periods. A record-low 43% was from fossil fuels, with 41% from gas and just 2% from coal, also a record low. In 2010, fossil fuels generated 75% of the total.

Carbon Brief’s analysis of UK electricity generation in 2019 is based on figures from BM Reports and the Department for Business, Energy and Industrial Strategy (BEIS). See the methodology at the end for more on how the analysis was conducted.

The numbers differ from those published earlier in January by National Grid, which were for electricity supplied in Great Britain only (England, Wales and Scotland, but excluding Northern Ireland), including via imports from other countries.

Low-carbon low
In 2019, the UK became the first major economy to target net-zero greenhouse gas emissions by 2050, increasing the ambition of its legally binding Climate Change Act.

To date, the country has cut its emissions by around two-fifths since 1990, with almost all of its recent progress coming from the electricity sector.

Emissions from electricity generation have fallen rapidly in the decade since 2010 as coal power has been almost phased out and even gas output has declined. Fossil fuels have been displaced by falling demand and by renewables, such as wind, solar and biomass.

But Carbon Brief’s annual analysis of UK electricity generation shows progress stalled in 2019, with the output from low-carbon sources barely increasing compared to a year earlier.

The chart below shows low-carbon generation in each year since 2010 (grey bars) and the estimated level in 2019 (red). The pale grey bars show the estimated future output of existing low-carbon sources after old nuclear plants retire and the pale red bars show the amount of new generation needed to keep electricity sector emissions to less than 100 grammes of CO2 per kilowatt hour (gCO2/kWh), the UK’s nominal target for the sector.

 Annual electricity generation in the UK by fuel, terawatt hours, 2010-2019. Top panel: fuel by fuel. Bottom panel: cumulative total generation from all sources. Source: BEIS energy trends, BM Reports and Carbon Brief analysis. Chart by Carbon Brief using Highcharts.
As the chart shows, the UK will require significantly more low-carbon electricity over the next decade as part of meeting its legally binding climate goals.

The nominal 100gCO2/kWh target for 2030 was set in the context of the UK’s less ambitious goal of cutting emissions to 80% below 1990 levels by 2050. Now that the country is aiming to cut emissions to net-zero by 2050, that 100gCO2/kWh indicator is likely to be the bare minimum.

Even so, it would require a rapid step up in the pace of low-carbon expansion, compared to the increases seen over the past decade. On average, low-carbon generation has risen by 9TWh each year in the decade since 2010 – including a rise of just 1TWh in 2019.

Given scheduled nuclear retirements and rising demand expected by the Committee on Climate Change (CCC) – with some electrification of transport and heating – low-carbon generation would need to increase by 15TWh each year until 2030, just to meet the benchmark of 100gCO2/kWh.

For context, the 3.2 gigawatt (GW) Hinkley C new nuclear plant being built in Somerset will generate around 25TWh once completed around 2026. The world’s largest offshore windfarm, the 1.2GW Hornsea One scheme off the Yorkshire coast, will generate around 5TWh each year.

The new Conservative government is targeting 40GW of offshore wind by 2030, up from today’s figure of around 8GW. If policies are put in place to meet this goal, then it could keep power sector emissions below 100gCO2/kWh, depending on the actual performance of the windfarms built.

However, new onshore wind and solar, further new nuclear or other low-carbon generation, such as gas with carbon capture and storage (CCS), is likely to be needed if demand is higher than expected, or if the 100gCO2/kWh benchmark is too weak in the context of net-zero by 2050.

The CCC says it is “likely” to “reflect the need for more rapid deployment” of low-carbon towards net-zero emissions in its advice on the sixth UK carbon budget for 2033-2037, due in September.

Trading places
Looking more closely at UK electricity generation in 2019, Carbon Brief’s analysis shows why there was so little growth for low-carbon sources compared to the previous year.

There was another increase for wind power in 2019 (up 8TWh, 14%), with record wind generation as several large new windfarms were completed including the 1.2GW Hornsea One project in October and the 0.6GW Beatrice offshore windfarm in Q2 of 2019. But this was offset by a decline for nuclear (down 9TWh, 14%), due to ongoing outages for reactors at Hunterston in Scotland and Dungeness in Kent.

(Analysis of data held by trade organisation RenewableUK suggests some 0.6GW of onshore wind capacity also started operating in 2019, including the 0.2GW Dorenell scheme in Moray, Scotland.)

As a result of these movements, the UK’s windfarms overtook nuclear for the first time ever in 2019, becoming the country’s second-largest source of electricity generation, and earlier, wind and solar together surpassed nuclear in the UK as momentum built. This is shown in the figure below, with wind (green line, top panel) trading places with nuclear (purple) and gas (dark blue) down around 25% since 2010 but remaining the single-largest source.

 Annual electricity generation in the UK by fuel, terawatt hours, 2010-2019. Top panel: fuel by fuel. Bottom panel: cumulative total generation from all sources. Source: BEIS energy trends, BM Reports and Carbon Brief analysis. Chart by Carbon Brief using Highcharts.
The UK’s currently suspended nuclear plants are due to return to service in January and March, according to operator EDF, the French state-backed utility firm. However, as noted above, most of the UK’s nuclear fleet is set to retire during the 2020s, with only Sizewell B in Suffolk due to still be operating by 2030. Hunterston is scheduled to retire by 2023 and Dungeness by 2028.

Set against these losses, the UK has a pipeline of offshore windfarms, secured via “contracts for difference” with the government, at a series of auctions. The most recent auction, in September 2019, saw prices below £40 per megawatt hour – similar to current wholesale electricity prices.

However, the capacity contracted so far is not sufficient to meet the government’s target of 40GW by 2030, meaning further auctions – or some other policy mechanism – will be required.

Coal zero
As well as the switch between wind and nuclear, 2019 also saw coal fall below solar for the first time across a full year, echoing the 2016 moment when wind outgenerated coal across the UK, after it suffered another 60% reduction in electricity output. Just six coal plants remain in the UK, with Aberthaw B in Wales and Fiddlers Ferry in Cheshire closing in March.

Coal accounted for just 2% of UK generation in 2019, a record-low coal share since centralised electricity supplies started to operate in 1882. The fuel met 40% of UK needs as recently as 2012, but has plummeted thanks to falling demand, rising renewables, cheaper gas and higher CO2 prices.

The reduction in average coal generation hides the fact that the fuel is now often not required at all to meet the UK’s electricity needs. The chart below shows the number of days each year when coal output was zero in 2019 (red line) and the two previous years (blue).

 Cumulative number of days when UK electricity generation from renewable sources has been higher than that from fossil fuels. Source: BEIS energy trends, BM Reports and Carbon Brief analysis. Chart by Carbon Brief using Highcharts.
The 83 days in 2019 with zero coal generation amount to nearly a quarter of the year and include the record-breaking 18-day stretch without the fuel.

Great Britain has been running for a record TWO WEEKS without using coal to generate electricity – the first time this has happened since 1882.

The country’s grid has been coal-free for 45% of hours in 2019 so far.https://www.carbonbrief.org/countdown-to-2025-tracking-the-uk-coal-phase-out …

Coal generation was set for significant reductions around the world in 2019 – including a 20% reduction for the EU as a whole – according to analysis published by Carbon Brief in November.

Notably, overall UK electricity generation fell by another 9TWh in 2019 (3%), bringing the total decline to 58TWh since 2010. This is equivalent to more than twice the output from the Hinkley C scheme being built in Somerset. As Carbon Brief explained last year, falling demand has had a similar impact on electricity-sector CO2 emissions as the increase in output from renewables.

This is illustrated by the fact that the 9TWh reduction in overall generation translated into a 9TWh (6%) cut in fossil-fuel generation during 2019, with coal falling by 10TWh and gas rising marginally.

Increasingly renewable
As fossil-fuel output and overall generation have declined, the UK’s renewable sources of electricity have continued to increase. Their output has risen nearly five-fold in the past decade and their share of the UK total has increased from 7% in 2010 to 37% in 2019.

As a result, the UK’s increasingly renewable grid is seeing more minutes, hours and days during which the likes of wind, solar and biomass collectively outpace all fossil fuels put together, and on some days wind is the main source as well.

The chart below shows the number of days during each year when renewables generated more electricity than fossil fuels in 2019 (red line) and each of the previous four years (blue lines). In total, nearly two-fifths of days in 2019 crossed this threshold.

 Cumulative number of days when the UK has not generated any electricity from coal. Source: BEIS energy trends, BM Reports and Carbon Brief analysis. Chart by Carbon Brief using Highcharts.
There were also four months in 2019 when renewables generated more of the UK’s electricity than fossil fuels: March, August, September and December. The first ever such month came in September 2018 and more are certain to follow.

National Grid, which manages Great Britain’s high-voltage electricity transmission network, is aiming to be able to run the system without fossil fuels by 2025, at least for short periods. At present, it sometimes has to ask windfarm operators to switch off and gas plants to start running in order to keep the electricity grid stable.

Note that biomass accounted for 11% of UK electricity generation in 2019, nearly a third of the total from all renewables. Some two-thirds of the biomass output is from “plant biomass”, primarily wood pellets burnt at Lynemouth in Northumberland and the Drax plant in Yorkshire. The remainder was from an array of smaller sites based on landfill gas, sewage gas or anaerobic digestion.

The CCC says the UK should “move away” from large-scale biomass power plants, once existing subsidy contracts for Drax and Lynemouth expire in 2027.

Using biomass to generate electricity is not zero-carbon and in some circumstances could lead to higher emissions than from fossil fuels. Moreover, there are more valuable uses for the world’s limited supply of biomass feedstock, the CCC says, including carbon sequestration and hard-to-abate sectors with few alternatives.

Methodology
The figures in the article are from Carbon Brief analysis of data from BEIS Energy Trends chapter 5 and chapter 6, as well as from BM Reports. The figures from BM Reports are for electricity supplied to the grid in Great Britain only and are adjusted to include Northern Ireland.

In Carbon Brief’s analysis, the BM Reports numbers are also adjusted to account for electricity used by power plants on site and for generation by plants not connected to the high-voltage national grid. This includes many onshore windfarms, as well as industrial gas combined heat and power plants and those burning landfill gas, waste or sewage gas.

By design, the Carbon Brief analysis is intended to align as closely as possible to the official government figures on electricity generated in the UK, reported in BEIS Energy Trends table 5.1.

Briefly, the raw data for each fuel is in most cases adjusted with a multiplier, derived from the ratio between the reported BEIS numbers and unadjusted figures for previous quarters.

Carbon Brief’s method of analysis has been verified against published BEIS figures using “hindcasting”. This shows the estimates for total electricity generation from fossil fuels or renewables to have been within ±3% of the BEIS number in each quarter since Q4 2017. (Data before then is not sufficient to carry out the Carbon Brief analysis.)

For example, in the second quarter of 2019, a Carbon Brief hindcast estimates gas generation at 33.1TWh, whereas the published BEIS figure was 34.0TWh. Similarly, it produces an estimate of 27.4TWh for renewables, against a BEIS figure of 27.1TWh.

National Grid recently shared its own analysis for electricity in Great Britain during 2019 via its energy dashboard, which differs from Carbon Brief’s figures.


Related News

View more

Minnesota Power energizes Great Northern Transmission Line

Great Northern Transmission Line delivers 250 MW of carbon-free hydropower from Manitoba Hydro, strengthening Midwest grid reliability, enabling wind storage balancing, and advancing Minnesota Power's EnergyForward strategy for cleaner, renewable energy across the region.


Key Points

A 500 kV cross-border line delivering 250 MW of carbon-free hydropower, strengthening reliability and enabling renewables.

✅ 500 kV, 224-mile line from Manitoba to Minnesota

✅ Delivers 250 MW hydropower via ALLETE-Minnesota Power

✅ Enables wind storage and grid balancing with Manitoba Hydro


Minnesota Power, a utility division of ALLETE Inc. (NYSE:ALE), has energized its Great Northern Transmission Line, bringing online an innovative delivery and storage system for renewable energy that spans two states and one Canadian province, similar to the Maritime Link project in Atlantic Canada.

The 500 kV line is now delivering 250 megawatts of carbon-free hydropower from Manitoba, Canada, to Minnesota Power customers.

Minnesota Power completed the Great Northern Transmission Line (GNTL) in February 2020, ahead of schedule and under budget. The 224-mile line runs from the Canadian border in Roseau County to a substation near Grand Rapids, Minnesota. It consists of 800 tower structures which were fabricated in the United States and used 10,000 tons of North American steel. About 2,200 miles of wire were required to install the line's conductors. The GNTL also is contributing significant property tax revenue to local communities along the route.

"This is such an incredible achievement for Minnesota Power, ALLETE, and our region, and is the culmination of a decade-long vision brought to life by our talented and dedicated employees," said ALLETE President and CEO Bethany Owen. "The GNTL will help Minnesota Power to provide our customers with 50 percent renewable energy less than a year from now. As part of our EnergyForward strategy, it also strengthens the grid across the Midwest and in Canada, enhancing reliability for all of our customers."

With the GNTL energized and connected to Manitoba Hydro's recently completed Manitoba-Minnesota Transmission Project at the border, the companies now have a unique "wind storage" mechanism that quickly balances energy supply and demand in Minnesota and Manitoba, and enables a larger role for renewables in the North American energy grid.

The GNTL and its delivery of carbon-free hydropower are important components of Minnesota Power's EnergyForward strategy to transition away from coal and add renewable power sources while maintaining reliable and affordable service for customers, echoing interties like the Maritime Link that facilitate regional power flows. It also is part of a broader ALLETE strategy to advance and invest in critical regional transmission and distribution infrastructure, such as the TransWest Express transmission project, to ensure grid integrity and enable cleaner energy to reduce carbon emissions.

"The seed for this renewable energy initiative was planted in 2008 when Minnesota Power proposed purchasing 250 megawatts of hydropower from Manitoba Hydro. Beyond the transmission line, it also included a creative asset swap to move wind power from North Dakota to Minnesota, innovative power purchase agreements, and a remarkable advocacy process to find an acceptable route for the GNTL," said ALLETE Executive Chairman Al Hodnik. "It marries wind and water in a unique connection that will help transform the energy landscape of North America and reduce carbon emissions related to the existential threat of climate change."

Minnesota Power and Manitoba Hydro, a provincial Crown Corporation, coordinated on the project from the beginning, navigating National Energy Board reviews along the way. It is based on the companies' shared values of integrity, environmental stewardship and community engagement.

"The completion of Minnesota Power's Great Northern Transmission Line and our Manitoba-Minnesota Transmission Project is a testament to the creativity, perseverance, cooperation and skills of hundreds of people over so many years on both sides of the border," said Jay Grewal, president and CEO of Manitoba Hydro. "Perhaps even more importantly, it is a testament to the wonderful, longstanding relationship between our two companies and two countries. It shows just how much we can accomplish when we all work together toward a common goal."

Minnesota Power engaged federal, state and local agencies; the sovereign Red Lake Nation and other tribes, reflecting First Nations involvement in major transmission planning; and landowners along the proposed routes beginning in 2012. Through 75 voluntary meetings and other outreach forums, a preferred route was selected with strong support from stakeholders that was approved by the Minnesota Public Utilities Commission in April 2016.

A four-year state and federal regulatory process culminated in late 2016 when the federal Department of Energy approved a Presidential Permit for the GNTL, similar to the New England Clean Power Link process, needed because of the international border crossing. Construction of the line began in early 2017.

"A robust stakeholder process is essential to the success of any project, but especially when building a project of this scope," Owen said. "We appreciated the early engagement and support from stakeholders, local communities and tribes, agencies and regulators through the many approval milestones to the completion of the GNTL."


Related News

View more

Toronto Prepares for a Surge in Electricity Demand as City Continues to Grow

Toronto Electricity Demand Growth underscores IESO projections of rising peak load by 2050, driven by population growth, electrification, new housing density, and tech economy, requiring grid modernization, transmission upgrades, demand response, and local renewable energy.


Key Points

It refers to the projected near-doubling of Toronto's peak load by 2050, driven by electrification and urban growth.

✅ IESO projects peak demand nearly doubling by 2050

✅ Drivers: population, densification, EVs, heat pumps

✅ Solutions: efficiency, transmission, storage, demand response


Toronto faces a significant challenge in meeting the growing electricity needs of its expanding population and ambitious development plans. According to a new report from Ontario's Independent Electricity System Operator (IESO), Toronto's peak electricity demand is expected to nearly double by 2050. This highlights the need for proactive steps to secure adequate electricity supply amidst the city's ongoing economic and population growth.


Key Factors Driving Demand

Several factors are contributing to the projected increase in electricity demand:

Population Growth: Toronto is one of the fastest-growing cities in North America, and this trend is expected to continue. More residents mean more need for housing, businesses, and other electricity-consuming infrastructure.

  • New Homes and Density: The city's housing strategy calls for 285,000 new homes within the next decade, including significant densification in existing neighbourhoods. High-rise buildings in urban centers are generally more energy-intensive than low-rise residential developments.
  • Economic Development: Toronto's robust economy, a hub for tech and innovation, attracts new businesses, including energy-intensive AI data centers that fuel further demand for electricity.
  • Electrification: The push to reduce carbon emissions is driving the electrification of transportation and home heating, further increasing pressure on Toronto's electricity grid.


Planning for the Future

Ontario and the City of Toronto recognize the urgency to secure stable and reliable electricity supplies to support continued growth and prosperity without sacrificing affordability, drawing lessons from British Columbia's clean energy shift to inform local approaches. Officials are collaborating to develop a long-term plan that focuses on:

  • Energy Efficiency: Efforts aim to reduce wasteful electricity usage through upgrades to existing buildings, promoting energy-efficient appliances, and implementing smart grid technologies. These will play a crucial role in curbing overall demand.
  • New Infrastructure: Significant investments in building new electricity generation, transmission lines, and substations, as well as regional macrogrids to enhance reliability, will be necessary to meet the projected demands of Toronto's future.
  • Demand Management: Programs incentivizing energy conservation during peak hours will help to avoid strain on the grid and reduce the need to build expensive power plants only used at peak demand times.


Challenges Ahead

The path ahead isn't without its hurdles.  Building new power infrastructure in a dense urban environment like Toronto can be time-consuming, expensive, and sometimes disruptive, especially as grids face harsh weather risks that complicate construction and operations. Residents and businesses might worry about potential rate increases required to fund these necessary investments.


Opportunity for Innovation

The IESO and the city view the situation as an opportunity to embrace innovative solutions. Exploring renewable energy sources within and near the city, developing local energy storage systems, and promoting distributed energy generation such as rooftop solar, where power is created near the point of use, are all vital strategies for meeting needs in a sustainable way.

Toronto's electricity future depends heavily on proactive planning and investment in modernizing its power infrastructure.  The decisions made now will determine whether the city can support economic growth, address climate goals and a net-zero grid by 2050 ambition, and ensure that lights stay on for all Torontonians as the city continues to expand.


Related News

View more

Consumer choice has suddenly revolutionized the electricity business in California. But utilities are striking back

California Community Choice Aggregators are reshaping electricity markets with renewable energy, solar and wind sourcing, competitive rates, and customer choice, challenging PG&E, SDG&E, and Southern California Edison while advancing California's clean power goals.


Key Points

Local governments that buy power, often cleaner and cheaper, while utilities handle delivery and billing.

✅ Offer higher renewable mix than utilities at competitive rates

✅ Utilities retain transmission and billing responsibilities

✅ Rapid expansion threatens IOU market share across California


Nearly 2 million electricity customers in California may not know it, but they’re part of a revolution. That many residents and businesses are getting their power not from traditional utilities, but via new government-affiliated entities known as community choice aggregators. The CCAs promise to deliver electricity more from renewable sources, such as solar and wind, even as California exports its energy policies across Western states, and for a lower price than the big utilities charge.

The customers may not be fully aware they’re served by a CCA because they’re still billed by their local utility. But with more than 1.8 million accounts now served by the new system and more being added every month, the changes in the state’s energy system already are massive.

Faced for the first time with real competition, the state’s big three utilities have suddenly become havens of innovation. They’re offering customers flexible options on the portion of their power coming from renewable energy, amid a broader review to revamp electricity rates aimed at cleaning the grid, and they’re on pace to increase the share of power they get from solar and wind power to the point where they are 10 years ahead of their deadline in meeting a state mandate.

#google#

But that may not stem the flight of customers. Some estimates project that by late this year, more than 3 million customers will be served by 20 CCAs, and that over a longer period, Pacific Gas & Electric, Southern California Edison, and San Diego Gas & Electric could lose 80% of their customers to the new providers.

Two big customer bases are currently in play: In Los Angeles and Ventura counties, a recently launched CCA called the Clean Power Alliance is hoping by the end of 2019 to serve nearly 1 million customers. Unincorporated portions of both counties and 29 municipalities have agreed in principle to join up.

Meanwhile, the city of San Diego is weighing two options to meet its goal of 100% clean power by 2035, as exit fees are being revised by the utilities commission: a plan to be submitted by SDG&E, or the creation of a CCA. A vote by the City Council is expected by the end of this year. A city CCA would cover 1.4 million San Diegans, accounting for half SDG&E’s customer demand, according to Cody Hooven, the city’s chief sustainability officer.

Don’t expect the big companies to give up their customers without a fight. Indeed, battle lines already are being drawn at the state Public Utilities Commission, where a recent CPUC ruling sided with a community energy program over SDG&E, and local communities.

“SDG&E is in an all-out campaign to prevent choice from happening, so that they maintain their monopoly,” says Nicole Capretz, who wrote San Diego’s climate action plan as a city employee and now serves as executive director of the Climate Action Campaign, which supports creation of the CCA.

California is one of seven states that have legalized the CCA concept, even as regulators weigh whether the state needs more power plants to ensure reliability. (The others are New York, New Jersey, Massachusetts, Ohio, Illinois and Rhode Island.) But the scale of its experiment is likely to be the largest in the country, because of the state’s size and the ambition of its clean-power goal, which is for 50% of its electricity to be generated from renewable sources by 2030.

California created its system via legislative action in 2002. Assembly Bill 117 enabled municipalities and regional governments to establish CCAs anywhere that municipal power agencies weren’t already operating. Electric customers in the CCA zones were automatically signed up, though they could opt out and stay with their existing power provider. The big utilities would retain responsibility for transmission and distribution lines.

The first CCA, Marin Clean Energy, began operating in 2010 and now serves 470,000 customers in Marin and three nearby counties.

The new entities were destined to come into conflict with the state’s three big investor-owned utilities. Their market share already has fallen to about 70%, from 78% as recently as 2010, and it seems destined to keep falling. In part that’s because the CCAs have so far held their promise: They’ve been delivering relatively clean power and charging less.

The high point of the utilities’ hostility to CCAs was the Proposition 16 campaign in 2009. The ballot measure was dubbed the “Taxpayers Right to Vote Act,” but was transparently an effort to smother CCAs in the cradle. PG&E drafted the measure, got it on the ballot, and contributed all of the $46.5 million spent in the unsuccessful campaign to pass it.

As recently as last year, PG&E and SDG&E were lobbying in the legislature for a bill that would place a moratorium on CCAs. The effort failed, and hasn’t been revived this year.

Rhetoric similar to that used by PG&E against Marin’s venture has surfaced in San Diego, where a local group dubbed “Clear the Air” is fighting the CCA concept by suggesting that it could be financially risky for local taxpayers and questioning whether it will be successful in providing cleaner electricity. Whether Clear the Air is truly independent of SDG&E’s parent, Sempra Energy, is questionable, as at least two of its co-chairs are veteran lobbyists for the company.

SDG&E spokeswoman Helen Gao says the utility supports “customers’ right to choose an energy provider that best meets their needs” and expects to maintain a “cooperative relationship” with any provider chosen by the city.


Related News

View more

Warren Buffett’s Secret To Cheap Electricity: Wind

Berkshire Hathaway Energy Wind Power drives cheap electricity rates in Iowa via utility-scale wind turbines, integrated transmission, battery storage, and grid management, delivering renewable energy, stable pricing, and long-term rate freezes through 2028.


Key Points

A vertically integrated wind utility lowering Iowa rates via owned generation, transmission, and advanced grid control.

✅ Owned wind assets meet Iowa residential demand

✅ Integrated transmission lowers costs and losses

✅ Rate freeze through 2028 sustains cheap power


In his latest letter to Berkshire Hathaway shareholders, Warren Buffett used the 20th anniversary of Berkshire Hathaway Energy to tout its cheap electricity bills for customers.

When Berkshire purchased the majority share of BHE in 2000, the cost of electricity for its residential customers in Iowa was 8.8 cents per kilowatt-hour (kWh) on average. Since then, these electricity rates have risen at a paltry <1% per year, with a freeze on rate hikes through 2028. As anyone who pays an electricity bill knows, that is an incredible deal.  

As Buffett himself notes with alacrity, “Last year, the rates [BHE’s competitor in Iowa] charged its residential customers were 61% higher than BHE’s. Recently, that utility received a rate increase that will widen the gap to 70%.”


The Winning Strategy

So, what’s Buffett’s secret to cheap electricity? Wind power.

“The extraordinary differential between our rates and theirs is largely the result of our huge accomplishments in converting wind into electricity,” Buffett explains. 

Wind turbines in Iowa that BHE owns and operates are expected to generate about 25.2 million megawatt-hours (MWh) of electricity for its customers, as projects like Building Energy operations begin to contribute. By Buffett’s estimations, that will be enough to power all of its residential customers’ electricity needs in Iowa.  


The company has plans to increase its renewable energy generation in other regions as well. This year, BHE Canada is expected to start construction on a 117.6MW wind farm in Alberta, Canada with its partner, Renewable Energy Systems, that will provide electricity to 79,000 homes in Canada’s oil country.

Observers note that Alberta is a powerhouse for both green energy and fossil fuels, underscoring the region's unique transition.

But I would argue that the secret to BHE’s success perhaps goes deeper than transitioning to sources of renewable energy. There are plenty of other utility companies that have adopted wind and solar power as an energy source. In the U.S., where renewable electricity surpassed coal in 2022, at least 50% of electricity customers have the option to buy renewable electricity from their power supplier, according to the Department of Energy. And some states, such as New York, have gone so far as to allow customers to pick from providers who generate their electricity.

What differentiates BHE from a lot of the competition in the utility space is that it owns the means to generate, store, transmit and supply renewable power to its customers across the U.S., U.K. and Canada, with lessons from the U.K. about wind power informing policy.

In its financial filings for 2019, the company reported that it owns 33,600MW of generation capacity and has 33,400 miles of transmission lines, as well as a 50% interest in Electric Transmission Texas (ETT) that has approximately 1,200 miles of transmission lines. This scale and integration enables BHE to be efficient in the distribution and sale of electricity, including selling renewable energy across regions.

BHE is certainly not alone in building renewable-energy fueled electricity dominions. Its largest competitor, NextEra, built 15GW of wind capacity and has started to expand its utility-scale solar installations. Duke Energy owns and operates 2,900 MW of renewable energy, including wind and solar. Exelon operates 40 wind turbine sites across the U.S. that generate 1,500 MW.


Integrated Utilities Power Ahead

It’s easy to see why utility companies see wind as a competitive source of electricity compared to fossil fuels. As I explained in my previous post, Trump’s Wrong About Wind, the cost of building and generating wind energy have fallen significantly over the past decade. Meanwhile, improvements in battery storage and power management through new technological advancements have made it more reliable (Warren Buffett bet on that one too).

But what is also striking is that integrated power and transmission enables these utility companies to make those decisions; both in terms of sourcing power from renewable energy, as well as the pricing of the final product. Until wind and solar power are widespread, these utility companies are going to have an edge of the more fragmented ends of the industry who can’t make these purchasing or pricing decisions independently. 

Warren Buffett very rarely misses a beat. He’s not the Oracle of Omaha for nothing. Berkshire Hathaway’s ownership of BHE has been immensely profitable for its shareholders. In the year ended December 31, 2019, BHE and its subsidiaries reported net income attributable to BHE shareholders of $2.95 billion.

There’s no question that renewable energy will transform the utility industry over the next decade. That change will be led by the likes of BHE, who have the power to invest, control and manage their own energy generation assets.


Related News

View more

Power bill cut for 22m Thailand houses

Thailand Covid-19 Electricity Bill Relief offers energy subsidies, tariff cuts, and free power for small meters, helping work-from-home users as authorities waive charges and discount kWh rates via EGAT, MEA, PEA for three months.


Key Points

Program waiving or cutting household electricity bills for 22 million homes in March-May, easing work-from-home costs.

? Free power for meters <= 5 amps; up to 10M homes

? Up to 800 kWh: pay February rate; above, 50% discount

? >3,000 kWh: 30% discount; program valid March-May


The Thailand cabinet has formally approved energy authorities' decision to either waive or cut electricity charges, similar to B.C. electricity relief measures, for 22 million households where people are working at home because of the coronavirus disease.

Energy Minister Sontirat Sontijirawong said after the cabinet meeting on Tuesday that the ministers acknowledged the step taken by from the Energy Regulatory Commission, the Electricity Generating Authority of Thailand, the Metropolitan Electricity Authority and the Provincial Electricity Authority and noted parallels with Ontario's COVID-19 hydro plan rolled out to support ratepayers.

The measure would be valid for three months, from March to May, and cover 22 million households. It would cost the state 23.68 billion baht in lost revenue, he said, a pattern also seen with Ontario rate reductions affecting provincial revenues.


"The measure reduces the electricity charges burden on households. It is the cost of living of the people who are working from home to support the government's control of Covid-19," Mr Sontirat said.

The business sector also wants similar assistance, echoing sentiments from Ontario manufacturers during recent price reduction efforts. He said their requests were being considered.

Free electricity is extended to households with a power meter of no more than 5 amps. Up to 10 million households are expected to benefit, although issues like electricity payment challenges in India highlight different market contexts.

For households with a power meter over 5 amps, if their consumption does not exceed 800 units (kilowat hours), they will pay as much as they did in their February bill. The amount over 800 units will be subject to a 50 per cent discount, while elsewhere B.C. commercial consumption has fallen sharply.

Large houses that consume more than 3,000 units will get a 30 per cent discount, at a time when BC Hydro demand is down 10%.


Related News

View more

Sign Up for Electricity Forum’s Newsletter

Stay informed with our FREE Newsletter — get the latest news, breakthrough technologies, and expert insights, delivered straight to your inbox.

Electricity Today T&D Magazine Subscribe for FREE

Stay informed with the latest T&D policies and technologies.
  • Timely insights from industry experts
  • Practical solutions T&D engineers
  • Free access to every issue

Download the 2025 Electrical Training Catalog

Explore 50+ live, expert-led electrical training courses –

  • Interactive
  • Flexible
  • CEU-cerified