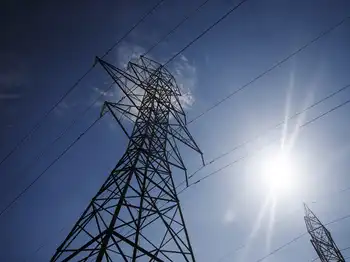
Durango pulls plug on green power to cut budget

By Associated Press


NFPA 70e Training - Arc Flash

Our customized live online or in‑person group training can be delivered to your staff at your location.

  • Live Online
  • 6 hours Instructor-led
  • Group Training Available
Regular Price:
$199
Coupon Price:
$149
Reserve Your Seat Today
The city of Durango is pulling the plug on green power because of problems with green — or money.

City Manager Ron LeBlanc recommended the city stop buying power from renewable energy sources when it became necessary to cut the 2009 budget by more than $500,000. The City Council approved the budget, including his recommendation, earlier this month.

The La Plata Electric Association charges 80 cents above standard rates per 100 kilowatt hours for electricity from solar and wind power. LeBlanc said that adds $45,000 to the city's annual electric bill.

The city buys about 6,800 blocks of green power monthly, which represents about 30 percent of all the electric cooperative's green power customer purchases.

"The budget caused us to rethink a lot of things that normally we just would've funded," LeBlanc said.

Mark Pearson of the environmental group San Juan Citizens' Alliance said was he was upset by the city's decision but also criticized the electric cooperative. He said both the city and utility could be doing more to encourage renewable energy use.

Mayor Renee Parsons voted for the new budget but said she wasn't happy that green power was cut entirely. She said she would rather see across-the-board budget cuts rather than individual items singled out.

Durango began buying green power in 2007 after the City Council signed the Mayors' Climate Protection Agreement to reduce greenhouse gases. The surcharge for electricity from renewable sources then was $2.50.

Mark Schwantes, the utility's director of corporate services, said the rate dropped to $1.25 shortly after the city signed on and then to 80 cents early this year.

Of the 80-cent surcharge, 40 cents is used to buy power generated from alternative sources such as wind and solar, Schwantes said.

La Plata Electric Association's parent company, Tri-State Generation and Transmission, purchases the power from third-parties, including PacifiCorp Power and Rocky Mountain Energy, both based in Salt Lake City.

Schwantes said the remaining 40 cents is invested in local alternative-energy projects in the utility's service area. The revenue also finances rebates for customers who install solar panels on their homes or businesses.

Last year, 12 Durango homeowners received $33,000 in rebates, capped at $3,000 each. Schwantes said the end of the city's participation could delay the payment of future rebates but will not jeopardize the program itself.

Related News

4 ways the energy crisis hits U.S. electricity, gas, EVs

U.S. Energy Crunch disrupts fuel and power markets, driving natural gas price spikes, coal resurgence, utility mix shifts, supply chain strains for EV batteries, and inflation pressures, complicating climate policy, OPEC outreach and LNG trade


Key Points

Supply-demand gaps raise fuel costs, revive coal, strain EV materials, and complicate U.S. climate policy and plans.

✅ Natural gas spikes shift generation from gas to coal

✅ Supply chain shortages hit nickel, silicon, and chips

✅ Policy tensions between price relief and decarbonization


A global energy crunch is creating pain for people struggling to fill their tanks and heat their homes, as well as roiling the utility industry’s plans to change its mix of generation and complicating the Biden administration’s plans to tackle climate change.

The ripple effects of a surge in natural gas prices include a spike in coal use and emissions that counter clean energy targets. High fossil fuel prices also are translating into high prices and a supply crunch for key minerals like silicon used in clean energy projects. On a call with investors yesterday, a Tesla Inc. executive said the company is having a hard time finding enough nickel for batteries.

The crisis could pose political problems for the Biden administration, which spent the last few months fending off criticism about rising fuel prices and inflation (Energywire, Oct. 14).

“Energy issues at this moment are as salient to the American public as they have been in quite some time,” said Christopher Borick, who directs the Muhlenberg College Institute of Public Opinion in Pennsylvania, where Biden stopped yesterday to pitch his infrastructure plan.

While gasoline prices have gotten headlines all summer, natural gas prices have risen faster than motor fuels, more than doubling from an average $1.92 per thousand cubic feet in September 2020 to $5.16 last month. By comparison, gasoline prices have risen about 55 percent in the last year, to $3.36 per gallon nationwide this week, according to AAA.

The roots of the problem go back to the beginning of the pandemic and the recession in 2020. Oil and gas prices fell so fast then that many producers, particularly in the U.S., simply stopped drilling.

Oil companies began predicting a few months later that the abrupt shutdown would eventually lead to shortages and price spikes when the economy recovered. Those predictions turned out to be accurate.

With the economy beginning to recover, demand for gas has gone up, but there’s not enough supply to go around.

While the U.S. energy crunch isn’t as severe as Europe’s energy crisis today, and analysts predict that gas prices will gradually fall next year, consumers could be in for a rough couple of months.

Here’s four ways the global energy crisis is impacting the United States, from the electricity sector to the political landscape:

What are the political repercussions?
For the Biden administration, the energy price hikes come amid fears of rising inflation and persistent supply bottlenecks at the nation’s ports as its climate ambitions face headwinds in Congress.

“The confluence of energy prices, logistical challenges and the need to move on climate have raised this to the top tier,” said Borick, who in the past has polled on energy and environmental issues in Pennsylvania.

Borick noted the administration is facing counterpressures: Even as it pushes to decarbonize the nation’s electric system, it wants to keep gas prices in check. High gasoline prices have been linked to declining political approval ratings, including for presidents, even if much of the price hikes are beyond their control.

White House press secretary Jen Psaki said earlier this month that the administration can take steps to address what it called “short-term supply issues,” but also needs to focus on the long term — and climate.

In hopes of capping prices, the White House has spoken with members of OPEC about increasing oil production — though OPEC has little control over natural gas prices. And earlier this month, the administration talked to U.S. oil and gas producers about helping to bring down prices.

That comes even as environmentalists have pushed Biden to ban federal fossil fuel leasing and drilling and stop new projects.

The moves to curb prices have prompted ridicule from Republicans, who have accused Biden of declaring war on U.S. energy by canceling the Keystone XL pipeline.

“The Biden administration won’t say it out loud, yet let’s admit it: There is a crisis,” Sen. John Barrasso (R-Wyo.) said this week on the Senate floor. “It is one that Joe Biden and his administration has created. It is a crisis of Joe Biden’s own making.”

The situation has also resurfaced comparisons to former President Carter, who struggled politically in the 1970s with gasoline shortages and other energy pressures. Some political scientists say, though, the comparison between the two isn’t apples to apples.

"In 1979, the crisis began with the Iranian Revolution, producing a supply shortage. In the USA, some states rationed the supply. That’s not occurring now. Oil prices were also regulated, another difference, “ said Terry Madonna, a senior fellow in residence for political affairs at Millersville University.

A Morning Consult poll released yesterday carried warning signs for Democrats with worries about the economy on the rise across the political spectrum.

Voters, however, were evenly split on how Biden is handling energy. Forty-two percent of respondents approve of Biden’s energy policy, compared with 45 percent who disapproved. The margin of error is 2 percentage points.

Will the electricity mix change?
Higher gas prices are giving coal a boost in some markets.

Atlanta-based Southern Co. told CNBC earlier this week, for instance, that coal was about 17 percent of the company’s power mix last year. That has changed in 2021.

“The unintended consequence of high gas prices is that coal becomes more economic, and so my sense is … our coal production has bumped up above 20 percent,” Southern CEO Tom Fanning said. “Now, how long that’ll persist, I don’t know.”

Fanning said “what we’re seeing right now, and the real challenge in America, is this notion of energy in transition.”

But the U.S. power sector has been evolving for years, with more renewables and less coal on the grid, and experts say the current energy crunch won’t change long-term utility trends in the industry.

“In general, I wouldn’t place too much emphasis on short-term fluctuations,” Jay Apt, a professor at Carnegie Mellon University, said in an email. “There is still a robust supply chain for most components needed for low-pollution power, including renewables.”

In fact, elevated fossil fuel prices, and high natural gas prices in particular, could accelerate the move toward wind, solar and batteries in some areas. That’s because power plants that run on coal and natural gas can be affected by rising and volatile fuel prices, as illustrated by the recent move in commodities globally. That means higher costs to run the facilities, even if power prices often climb along with gas prices.

“If I were a utility planner, this would cause me to double down on new generation from [wind] and solar and storage as opposed to building additional natural gas plants where, you know, I could be having these super high and volatile operating costs,” said Bri-Mathias Hodge, an associate professor in the Department of Electrical, Computer and Energy Engineering at the University of Colorado, Boulder.

Ed Hirs, an energy fellow at the University of Houston, said the current global situation doesn’t change the U.S. power sector’s overall move toward generation with lower operating costs.

For example, he said nuclear and coal plants can require hundreds of employees, and both have fuel costs. Hirs said a gas facility also needs fuel and may need dozens of employees. Wind and solar facilities often need a smaller number of workers and don’t require fuel in their operations, he noted.

“Eventually the cheap wins out,” Hirs said.

That isn’t even factoring in climate change — the reason world leaders are seeking to slash greenhouse gas emissions. Indeed, lowering emissions remains a priority among many states and big companies in the U.S.

Over the next 10 to 15 years, Hirs said, a key question will be whether battery technology can compete economically in terms of backing up renewables. He said a national carbon price, if enacted, would aid renewables and enhance returns on batteries.

“The real battle is going to be between natural gas and battery storage,” Hirs said.

Apt and M. Granger Morgan, who’s also a Carnegie Mellon professor, noted in a Hill piece last month that the U.S. gets about 40 percent of its power from carbon-free sources, including nuclear.

“Modelers and many power system operators agree that it is possible that renewables can cost-effectively make up roughly 80% of electricity generation,” the professors wrote, adding that other sources could include “storage and gas turbines powered with hydrogen, synfuels, or natural gas with carbon capture.”

What about EVs and renewables?
As for electric vehicles, executives with Tesla said on a call yesterday that supply-chain problems are the major brake on production for both vehicles and batteries.

Chief Financial Officer Zachary Kirkhorn said that the company’s factories aren’t running at full capacity because of an ongoing shortage of semiconductor chips. Customers are waiting longer for vehicles, he said, and wait lists are growing.

The challenges extend to raw materials. In batteries, Kirkhorn said, the company is having trouble finding enough nickel, and in vehicles, it is scrounging for aluminum. He said the problem is "not small," and that prices may rise as supply contracts come up for renewal.

The supply problems are creating "cost headwinds," he said, and so are rising labor costs. Tesla is not immune from the worker shortages that are plaguing the entire U.S. economy.

The production woes aren’t limited to Tesla: Automakers around the world have have had their output crimped by the chip shortage that accompanied the economic rebound after pandemic lockdowns. Unlike many other automakers, Tesla hasn’t been forced to pause its factory lines.

Tesla said it is poised to greatly expand its production of batteries for the electric grid — with a caveat.

Last month, Tesla broke ground on a new California factory to make Megapack, its 3 megawatt-per-hour lithium-ion batteries for use by power companies. That future factory’s capacity, 40 gigawatt per hour a year, is vastly more than the 3 GWh it made in the last calendar year.

However, today’s supply-chain problems are braking the making of both Megapack and Powerwall, Tesla’s battery for homes, Kirkhorn said. He added that production will increase "as soon as parts allow us."

Other advocates for EVs and renewable power expressed little concern about the supply crunch’s meaning for their industries, noting that higher prices alone don’t automatically trigger a broader green revolution on their own.

Those problems likely wouldn’t change the immediate course of the energy transition, researchers said.

"Short-term trends, week to week or even month to month, don’t matter much for investors or policy makers," wrote John Graham, a former budget official with the Bush administration and professor at Indiana University’s O’Neill School of Public and Environmental Affairs, in an email to E&E News.

The crunch may give policymakers a glimpse of the future, however, according to one minerals analyst.

"This isn’t going to be an outlier. I think increasingly you’re going to see pockets of the world start to feel these strains," said Andrew Miller, product director at Benchmark Mineral Intelligence, which focuses its research on battery minerals and battery supply chains.

The U.S. and its allies are only now beginning to develop their own supply chains for batteries and other key clean energy technologies, he noted. "The issue you’re facing, and this is one coming over time, is to have the platform in place. You have to have the supply chain of raw materials," he said.

"I think you’re going to see the most turbulence over the coming decade. … It’s not going to be a smooth transition,” added Miller.

How long will gas prices stay high?
The gap between natural gas demand and supply has led to severe price spikes in Europe, where utilities and other gas buyers have to compete against China for cargoes of liquefied natural gas, according to a research note from IHS Markit Ltd.

Here in the U.S., the causes are the same, but the results aren’t as extreme. Less than 10 percent of domestic gas production is exported as LNG, so American customers don’t have to compete as much against overseas buyers.

Instead, gas-hungry sectors of the economy have run into another problem, IHS analyst Matthew Palmer said in an interview. Gas producers have been cautious about increasing their output, largely because of pressure from investors to limit their spending.

“That theme has really put a governor on production,” he said.

The disconnect will likely mean higher home gas bills and higher electric prices this winter, although deep freeze events or warm weather could disrupt the trend, he said. The U.S. Energy Information Administration is predicting that average heating bills for homes that use gas furnaces will rise 30 percent this winter.

This comes as U.S. gas supply remains high, according to a biennial assessment from the Potential Gas Committee, a group of volunteer geoscientists, engineers and other experts.

Including reserves, future gas supply in the U.S. stands at a record 3,863 trillion cubic feet, up 25 tcf from levels reported in 2019, the group said Tuesday at an event co-hosted with the American Gas Association.

Of that total, so-called technically recoverable resources — or those in the ground but not yet recovered — are 3,368 tcf, the PGC said, down less than 0.2 percent from the last assessment.

The amount of technically recoverable gas went relatively unchanged from year-end 2018 for several reasons, including a lack of company activity in exploration efforts last year due to COVID, said Alexei Milkov, the group’s executive director.

Another factor is that basins mature and shale plays “cannot increase in resources forever,” said Milkov, also a professor of geology and geological engineering at the Colorado School of Mines.

Still, Milkov added, “We cannot tell you right now if we are on a new plateau, or if we are going to start seeing more growth in gas resources again, right, because it’s a complex issue.”

The EIA predicts that gas production will increase and prices will begin to drop in 2022.

David Flaherty, CEO of the Republican polling firm Magellan Strategies in Colorado, said prices could particularly hit seniors. But he said he expected the energy crunch to ease in the U.S. well before the election.

“By early summer, this is likely to be behind us,” he said.


Related News

View more

Ontario prepares to extend disconnect moratoriums for residential electricity customers

Ontario Electricity Relief outlines an extended disconnect moratorium, potential time-of-use price changes, and Ontario Energy Board oversight to support residential customers facing COVID-19 hardship and bill payment challenges during the emergency in Ontario.


Key Points

Plan to extend disconnect moratorium and weigh time-of-use price relief for residential customers during COVID-19.

✅ Extends winter disconnect ban by 3 months

✅ Considers time-of-use price adjustments

✅ Requires Ontario Energy Board approval


The Ontario government is preparing to announce electricity relief for residential electricity users struggling because of the COVID-19 emergency, according to sources.

Sources close to those discussions say a decision has been made to lengthen the existing five-month disconnect moratorium by an additional three months.

Separately, Hydro One's relief fund has offered support to its customers during the pandemic.

News releases about the moratorium extension are currently being drafted and are expected to be released shortly, as the pandemic has reduced electricity usage across Ontario.

Electricity utilities in Ontario are currently prohibited from disconnecting residential customers for non-payment during the winter ban period from November 15 to April 30.

The province is also looking at providing further relief by adjusting time-of-use prices, such as off-peak electricity rates, which are designed to encourage shifting of energy use away from periods of high total consumption to periods of low demand.

For businesses, the province has provided stable electricity pricing to support industrial and commercial operations.

But that would require Ontario Energy Board approval and no decision has been finalized, our sources advise.


Related News

View more

Wind and solar make more electricity than nuclear for first time in UK

UK Renewables Surpass Nuclear Milestone as wind farms and solar panels outpace atomic output, cutting greenhouse gas emissions. BEIS data show low-carbon power generation rising while onshore wind subsidies and auction timelines face policy debate.


Key Points

It is the quarter when UK wind and solar generated more electricity than nuclear, signaling cleaner, low-carbon growth.

✅ BEIS reports wind and solar at 18.33 TWh vs nuclear 16.69 TWh

✅ Energy sector emissions fell 8% as coal use dropped

✅ Calls grow to reopen onshore wind support via CFD auctions


Wind farms and solar panels, with wind leading the power mix during key periods, produced more electricity than the UK’s eight nuclear power stations for the first time at the end of last year, official figures show.

Britain’s greenhouse gas emissions also continued to fall, dropping 3% in 2017, as coal use fell and the use of renewables climbed, though low-carbon generation stalled in 2019 according to later data.

Energy experienced the biggest drop in emissions of any UK sector, of 8%, while pollution from transport and businesses stayed flat.

Energy industry chiefs said the figures showed that the government should rethink its ban on onshore wind subsidies, a move that ministers have hinted could happen soon.

Lawrence Slade, chief executive of the big six lobby group Energy UK, said: “We need to keep up the pace ... by ensuring that the lowest cost renewables are no longer excluded from the market.”

Across the whole year, low-carbon sources of power – wind, solar, biomass and nuclear – provided a record 50.4% of electricity, up from 45.7% in 2016, when wind beat coal for the first time.

But in the fourth quarter of 2017, high wind speeds, new renewables installations and lower nuclear output saw wind and solar becoming the second biggest source of power for the first time.

Wind and solar generated 18.33 terawatt hours (TWh), with nuclear on 16.69TWh, and the UK later set a new record for wind power during 2019, the figures published by the Department for Business, Energy and Industrial Strategy show.

But renewables still have a long way to go to catch up with gas, the UK’s top source of electricity at 36.12TWh, which saw its share of generation fall slightly, though at times wind became the main source as capacity expanded.

Greenpeace said the figures showed the government should capitalise on its lead in renewables and “stop wasting time and money propping up nuclear power”.

Horizon Nuclear Power, a subsidiary of the Japanese conglomerate Hitachi, is in talks with Whitehall officials for a financial support package from the government, which it says it needs by midsummer.

By contrast, large-scale solar and onshore wind projects are not eligible for support, after the Conservative government cut subsidies in 2015.

However the energy minister, Claire Perry, recently told House Magazine that “we will have another auction that brings forward wind and solar, we just haven’t yet said when”.


Related News

View more

Energy Department Announces 20 New Competitors for the American-Made Solar Prize

American-Made Solar Prize Round 3 accelerates DOE-backed solar innovation, empowering entrepreneurs and domestic manufacturing with photovoltaics and grid integration support via National Laboratories, incubators, and investors to validate products, secure funding, and deploy backup power.


Key Points

A DOE challenge fast-tracking solar innovation to market readiness, boosting US manufacturing and grid integration.

✅ $50,000 awards to 20 teams for prototype validation

✅ Access to National Labs, incubators, investors, and mentors

✅ Focus on PV advances and grid integration solutions


The U.S. Department of Energy (DOE) announced the 20 competitors who have been invited to advance to the next phase of the American-Made Solar Prize Round 3, a competition designed to incentivize the nation’s entrepreneurs to strengthen American leadership in solar energy innovation and domestic manufacturing, a key front in the clean energy race today.

The American-Made Solar Prize is designed to help more American entrepreneurs thrive in the competitive global energy market. Each round of the prize brings new technologies to pre-commercial readiness in less than a year, ensuring new ideas enter the marketplace. As part of the competition, teams will have access to a network of DOE National Laboratories, technology incubators and accelerators, and related DOE efforts like next-generation building upgrades, venture capital firms, angel investors, and industry. This American-Made Network will help these competitors raise private funding, validate early-stage products, or test technologies in the field.

Each team will receive a $50,000 cash prize and become eligible to compete in the next phase of the competition. Through a rigorous evaluation process, teams were chosen based on the novelty of their ideas and how their solutions address a critical need of the solar industry. The teams were selected from 120 submissions and represent 11 states. These projects will tackle challenges related to new solar applications, like farming, as well as show how solar can be used to provide backup power when the grid goes down, aided by increasingly affordable batteries now reaching scale. Nine teams will advance solar photovoltaic technologies, and 11 will address challenges related to how solar integrates with the grid. The projects are as follows:

Photovoltaics:

  • Durable Antireflective and Self-Cleaning Glass (Pittsburgh, PA)
  • Pursuit Solar - More Power, Less Hassle (Denver, NC)
  • PV WaRD (San Diego, CA)
  • Remotely Deployed Solar Arrays (Charlottesville, VA)
  • Robotics Changing the Landscape for Solar Farms (San Antonio, TX)
  • TrackerSled (Chicago, IL)
  • Transparent Polymer Barrier Films for PV (Bristol, PA)
  • Solar for Snow (Duluth, MN)
  • SolarWall Power Tower (Buffalo, NY)


Systems Integration:

  • Affordable Local Solar Storage via Utility Virtual Power Plants (Parker, TX)
  • Allbrand Solar Monitor (Detroit, MI)
  • Beyond Monitoring – Next Gen Software and Hardware (Atlanta, GA)
  • Democratizing Solar with Artificial Intelligence Energy Management (Houston, TX)
  • Embedded, Multi-Function Maximum Power Point Tracker for Smart Modules (Las Vegas, NV)
  • Evergrid: Keep Solar Flowing When the Grid Is Down (Livermore, CA)
  • Inverter Health Scan (San Jose, CA)
  • JuiceBox: Integrated Solar Electricity for Americans Transitioning out of Homelessness and Recovering from Natural Disasters (Claremont, CA)
  • Low-Cost Parallel-Connected DC Power Optimizer (Blacksburg, VA)
  • Powerfly: A Plug-and-Play Solar Monitoring Device (Berkeley, CA)
  • Simple-Assembly Storage Kit (San Antonio, TX)

Read the descriptions of the projects to see how they contribute to efforts to improve solar and wind power worldwide.

Over the next six months, these teams will fast-track their efforts to identify, develop, and test disruptive solutions amid record solar and storage growth projected nationwide. During a national demonstration day at Solar Power International in September 2020, a panel of judges will select two final winners who will receive a $500,000 prize. Learn more at the American-Made Solar Prize webpage.

The American-Made Challenges incentivize the nation's entrepreneurs to strengthen American leadership in energy innovation and domestic manufacturing. These new challenges seek to lower the barriers U.S.-based innovators face in reaching manufacturing scale by accelerating the cycles of learning from years to weeks while helping to create partnerships that connect entrepreneurs to the private sector and the network of DOE’s National Laboratories across the nation, alongside recent wind energy awards that complement solar innovation.

Go here to learn how this work aligns with a tenfold solar expansion being discussed nationally.

https://www.energy.gov/eere/solar/solar-energy-technologies-office


Related News

View more

Learn how fees and usage impacts your electricity bill in new online CER tool

CER Interactive Electricity Bill Tool compares provincial electricity prices, fees, taxes, and usage. Explore household appliance costs, hydroelectric generation, and consumption trends across Canada with interactive calculators and a province-by-province breakdown.


Key Points

An online CER report with calculators comparing electricity prices, fees, and usage to explain household energy costs.

✅ Province-by-province bill, price, and consumption comparison

✅ Calculator for appliance and electronics energy costs

✅ Explains fees, taxes, regulation, and generation sources


Canadians have a new way to assess their electricity bill in a new, interactive online report released by the Canada Energy Regulator (CER).

The report titled What is in a residential electricity bill? features a province-to-province comparison of electricity bills, generation and consumption. It also explains electricity prices across the country, including how Calgary electricity prices have changed, allowing people to understand why costs vary depending on location, fees, regulation and taxes.  

Learn how fees and usage impacts your electricity bill in new online CER tool
Interactive tools allow people to calculate the cost of household appliances and electronic use for each province and territory, and to understand how Ontario rate increases may affect monthly bills. For example, an individual can use the tools to find out that leaving a TV on for 24-hours in Quebec costs $5.25 per month, while that same TV on for a whole day would cost $12.29 per month in Saskatchewan, $20.49 per month in the Northwest Territories, and $15.30 per month in Nova Scotia.

How Canadians use energy varies as much as how provinces and territories produce it, especially in regions like Nunavut where unique conditions influence costs. Millions of Canadians rely on electricity to power their household appliances, charge their electronics, and heat their homes. Provinces with abundant hydro-electric resources like Quebec, B.C., Manitoba, and Newfoundland and Labrador use electricity for home heating and tend to consume the most electricity.

By gathering data from various sources, this report is the first Canadian publication that features interactive tools to allow for a province-by-province comparison of electricity bills while highlighting different elements within an electricity bill, a helpful context as Canada faces a critical supply crunch in the years ahead.

The CER monitors energy markets and assesses Canadian energy requirements and trends, including clean electricity regulations developments that shape pricing. This report is part of a portfolio of publications on energy supply, demand and infrastructure that the CER publishes regularly as part of its ongoing market monitoring.

"No matter where you go in the country, Canadians want to know how much they pay for power and why, especially amid price spikes in Alberta this year," says lead author Colette Craig. "This innovative, interactive report really explains electricity bills to help everyone understand electricity pricing and consumption across Canada."

Quick Facts

  • Quebec ranks first in electricity consumption per capita at 21.0 MW.h, followed by Saskatchewan at 20.0 MW.h, Newfoundland and Labrador at 19.3 MW.h.
  • About 95% of Quebec's electricity is produced from hydroelectricity.
  • Provinces that use electricity for home heating tend to consume the most electricity.
  • Canada's largest consuming sector for electricity was industrial at 238 TW.h. The residential and commercial sectors consumed 168 TW.h and 126 TW.h, respectively.
  • In 2018, Canada produced 647.7 terawatt hours (TW.h) of electricity. More than half of the electricity in Canada (61%) is generated from hydro sources. The remainder is produced from a variety of sources, such as fossil fuels (natural gas and petroleum), nuclear, wind, coal, biomass, solar.
  • Canada is a net exporter of electricity. In 2019, net exports to the U.S. electricity market totaled 47.0 TW.h.
  • The total value of Canada's electricity exports was $2.5 billion Canadian dollars and the value of imports was $0.6 billion Canadian dollars, resulting in 2019 net exports of $1.9 billion.
  • All regions in Canada are reflected in this report but it does not include data that reflects the COVID-19 lockdown and its effects on residential electricity bills.


Related News

View more

Utilities see benefits in energy storage, even without mandates

Utility Battery Storage Rankings measure grid-connected capacity, not ownership, highlighting MW, MWh, and watts per customer across PJM, MISO, and California IOUs, featuring Duke Energy, IPL, ancillary services, and frequency regulation benefits.


Key Points

Rankings that track energy storage connected to utility grids, comparing MW, MWh, and W/customer rather than ownership.

✅ Ranks by MW, MWh, and watts per customer, not asset ownership

✅ Highlights PJM, MISO cases and California IOUs' deployments

✅ Examples: Duke Energy, IPL, IID; ancillary services, frequency response


The rankings do not tally how much energy storage a utility built or owns, but how much was connected to their system. So while IPL built and owns the storage facility in its territory, Duke does not own the 16 MW of storage that connected to its system in 2016. Similarly, while California’s utilities are permitted to own some energy storage assets, they do not necessarily own all the storage facilities connected to their systems.

Measured by energy (MWh), IPL ranked fourth with 20 MWh, and Duke Energy Ohio ranked eighth with 6.1 MWh.

Ranked by energy storage watts per customer, IPL and Duke actually beat the California utilities, ranking fifth and sixth with 42 W/customer and 23 W/customer, respectively.

Duke ready for next step

Given Duke’s plans, including projects in Florida that are moving ahead, the utility is likely to stay high in the rankings and be more of a driving force in development. “Battery technology has matured, and we are ready to take the next step,” Duke spokesman Randy Wheeless told Utility Dive. “We can go to regulators and say this makes economic sense.”

Duke began exploring energy storage in 2012, and until now most of its energy storage efforts were focused on commercial projects in competitive markets where it was possible to earn revenues. Those included its 36 MW Notrees battery storage project developed in partnership with the Department of Energy in 2012 that provides frequency regulation for the Electric Reliability Council of Texas market and two 2 MW storage projects at its retired W.C. Beckjord plant in New Richmond, Ohio, that sells ancillary services into the PJM Interconnection market.

On the regulated side, most of Duke’s storage projects have had “an R&D slant to them,” Wheeless said, but “we are moving beyond the R&D concept in our regulated territory and are looking at storage more as a regulated asset.”

“We have done the demos, and they have proved out,” Wheeless said. Storage may not be ready for prime time everywhere, he said, but in certain locations, especially where it can it can be used to do more than one thing, it can make sense.

Wheeless said Duke would be making “a number of energy storage announcements in the next few months in our regulated states.” He could not provide details on those projects.

More flexible resources
Location can be a determining factor when building a storage facility. For IPL, serving the wholesale market was a driving factor in the rationale to build its 20 MW, 20 MWh storage facility in Indianapolis.

IPL built the project to address a need for more flexible resources in light of “recent changes in our resource mix,” including decreasing coal-fired generation and increasing renewables and natural gas-fired generation, as other regions plan to rely on battery storage to meet rising demand, Joan Soller, IPL’s director of resource planning, told Utility Dive in an email. The storage facility is used to provide primary frequency response necessary for grid stability.

The Harding Street storage facility in May. It was the first energy storage project in the Midcontinent ISO. But the regulatory path in MISO is not as clear as it is in PJM, whereas initiatives such as Ontario storage framework are clarifying participation. In November, IPL with the Federal Energy Regulatory Commission, asking the regulator to find that MISO’s rules for energy storage are deficient and should be revised.

Soller said IPL has “no imminent plans to install energy storage in the future but will continue to monitor battery costs and capabilities as potential resources in future Integrated Resource Plans.”

California legislative and regulatory push

In California, energy storage did not have to wait for regulations to catch up with technology. With legislative and regulatory mandates, including CEC long-duration storage funding announced recently, as a push, California’s IOUs took high places in SEPA’s rankings.

Southern California Edison and San Diego Gas & Electric were first and fourth (63.2 MW and 17.2 MW), respectively, in terms of capacity. SoCal Ed and SDG&E were first and second (104 MWh and 28.4 MWh), respectively, and Pacific Gas and Electric was fifth (17 MWh) in terms of energy.

But a public power utility, the Imperial Irrigation District (IID), ended up high in the rankings – second in capacity (30 MW) and third  in energy (20 MWh) – even though as a public power entity it is not subject to the state’s energy storage mandates.

But while IID was not under state mandate, it had a compelling regulatory reason to build the storage project. It was part of a settlement reached with FERC over a September 2011 outage, IID spokeswoman Marion Champion said.

IID agreed to a $12 million fine as part of the settlement, of which $9 million was applied to physical improvements of IID’s system.

IID ended up building a 30 MW, 20 MWh lithium-ion battery storage system at its El Centro generating station. The system went into service in October 2016 and in May, IID used the system’s 44 MW combined-cycle natural gas turbine at the generating station.

Passing savings to customers
The cost of the storage system was about $31 million, and based on its experience with the El Centro project, Champion said IID plans to add to the existing batteries. “We are continuing to see real savings and are passing those savings on to our customers,” she said.

Champion said the battery system gives IID the ability to provide ancillary services without having to run its larger generation units, such as El Centro Unit 4, at its minimum output. With gas prices at $3.59 per million British thermal units, it costs about $26,880 a day to run Unit 4, she said.

IID’s territory is in southeastern California, an area with a lot of renewable resources. IID is also not part of the California ISO and acts as its own balancing authority. The battery system gives the utility greater operational flexibility, in addition to the ability to use more of the surrounding renewable resources, Champion said.

In May, IID’s board gave the utility’s staff approval to enter into contract negotiations for a 7 MW, 4 MWh expansion of its El Centro storage facility. The negotiations are ongoing, but approval could come in the next couple months, Champion said.

The heart of the issue, though, is “the ability of the battery system to lower costs for our ratepayers,” Champion said. “Our planning section will continue to utilize the battery, and we are looking forward to its expansion,” she said.” I expect it will play an even more important role as we continue to increase our percentage of renewables.”


Related News

View more

Sign Up for Electricity Forum’s Newsletter

Stay informed with our FREE Newsletter — get the latest news, breakthrough technologies, and expert insights, delivered straight to your inbox.

Electricity Today T&D Magazine Subscribe for FREE

Stay informed with the latest T&D policies and technologies.
  • Timely insights from industry experts
  • Practical solutions T&D engineers
  • Free access to every issue

Live Online & In-person Group Training

Advantages To Instructor-Led Training – Instructor-Led Course, Customized Training, Multiple Locations, Economical, CEU Credits, Course Discounts.

Request For Quotation

Whether you would prefer Live Online or In-Person instruction, our electrical training courses can be tailored to meet your company's specific requirements and delivered to your employees in one location or at various locations.