Baltic States Disconnect from Russian Power Grid, Join EU System


Baltic States Disconnect from Russian Power Grid, Join EU System

High Voltage Maintenance Training Online

Our customized live online or in‑person group training can be delivered to your staff at your location.

  • Live Online
  • 12 hours Instructor-led
  • Group Training Available
Regular Price:
$599
Coupon Price:
$499
Reserve Your Seat Today

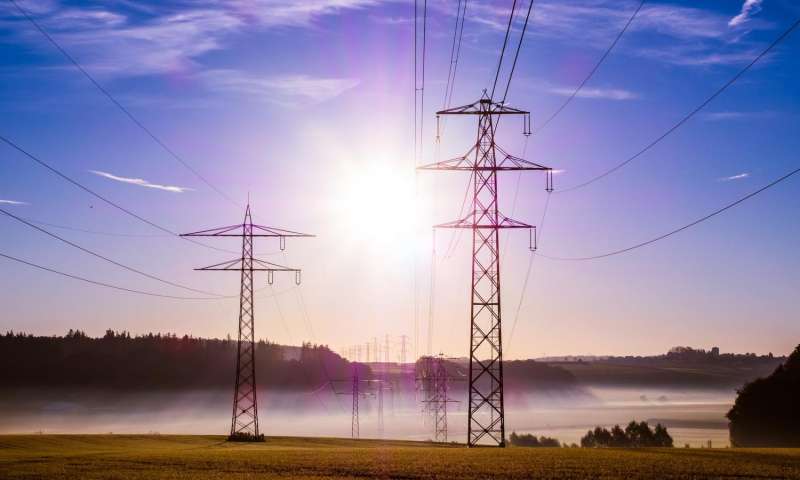
Baltic States EU Grid Synchronization strengthens energy independence and electricity security, ending IPS/UPS reliance. Backed by interconnectors like LitPol Link, NordBalt, and Estlink, it aligns with NATO interests and safeguards against subsea infrastructure threats.


Key Points

A shift by Estonia, Latvia, and Lithuania to join the EU grid, boosting energy security and reducing Russian leverage.

✅ Synchronized with EU grid on Feb 9, 2025 after islanding tests.

✅ New interconnectors: LitPol Link, NordBalt, Estlink upgrades.

✅ Reduces IPS/UPS risks; bolsters NATO and critical infrastructure.


In a landmark move towards greater energy independence and European integration, the Baltic nations of Estonia, Latvia, and Lithuania have officially disconnected from Russia's electricity grid, a path also seen in Ukraine's rapid grid link to the European system. This decisive action, completed in February 2025, not only ends decades of reliance on Russian energy but also enhances the region's energy security and aligns with broader geopolitical shifts.

Historical Context and Strategic Shift

Historically, the Baltic states were integrated into the Russian-controlled IPS/UPS power grid, a legacy of their Soviet past. However, in recent years, these nations have sought to extricate themselves from Russian influence, aiming to synchronize their power systems with the European Union (EU) grid. This transition gained urgency following Russia's annexation of Crimea in 2014 and further intensified after the invasion of Ukraine in 2022, as demonstrated by Russian strikes on Ukraine's grid that underscored energy vulnerability.

The Disconnection Process

The process culminated on February 8, 2025, when Estonia, Latvia, and Lithuania severed their electrical ties with Russia. For approximately 24 hours, the Baltic states operated in isolation, conducting rigorous tests to ensure system stability and resilience, echoing winter grid protection efforts seen elsewhere. On February 9, they successfully synchronized with the EU's continental power grid, marking a historic shift towards European energy integration.

Geopolitical and Security Implications

This transition holds significant geopolitical weight. By disconnecting from Russia's power grid, the Baltic states reduce potential leverage that Russia could exert through energy supplies. The move also aligns with NATO's strategic interests, enhancing the security of critical infrastructure in the region, amid concerns about Russian hacking of US utilities that highlight cyber risks.

Economic and Technical Challenges

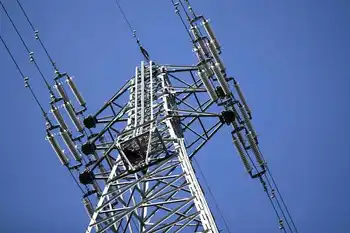
The shift was not without challenges. The Baltic states had to invest heavily in infrastructure to ensure compatibility with the EU grid and navigate regional market pressures such as a Nordic grid blockade affecting transmission capacity. This included constructing new interconnectors and upgrading existing facilities. For instance, the LitPol Link between Lithuania and Poland, the NordBalt cable connecting Lithuania and Sweden, and the Estlink between Estonia and Finland were crucial in facilitating this transition.

Impact on Kaliningrad

The disconnection has left Russia's Kaliningrad exclave isolated from the Russian power grid, relying solely on imports from Lithuania. While Russia claims to have measures in place to maintain power stability in the region, the long-term implications remain uncertain.

Ongoing Security Concerns

The Baltic Sea region has experienced heightened security concerns, particularly regarding subsea cables and pipelines. Increased incidents of damage to these infrastructures have raised alarms about potential sabotage, including a Finland cable damage investigation into a suspected Russian-linked vessel. Authorities continue to investigate these incidents, emphasizing the need for robust protection of critical energy infrastructure.

The successful disconnection and synchronization represent a significant step in the Baltic states' journey towards full integration with European energy markets. This move is expected to enhance energy security, promote economic growth, and solidify geopolitical ties with the EU and NATO. As the region continues to modernize its energy infrastructure, ongoing vigilance against security threats will be paramount, as recent missile and drone attacks on Kyiv's grid demonstrate.

The Baltic states' decision to disconnect from Russia's power grid and synchronize with the European energy system is a pivotal moment in their post-Soviet transformation. This transition not only signifies a break from historical dependencies but also reinforces their commitment to European integration and collective security. As these nations continue to navigate complex geopolitical landscapes, their strides towards energy independence serve as a testament to their resilience and strategic vision.


Related News

Related News

Heat Exacerbates Electricity Struggles for 13,000 Families in America

Energy Poverty in Extreme Heat exposes vulnerable households to heatwaves, utility shutoffs, and unreliable grid infrastructure, straining public health. Community nonprofits, cooling centers, and policy reform aim to improve electricity access, resilience, and affordable energy.


Key Points

Without reliable, affordable power in heatwaves, health risks rise and cooling, food storage, and daily needs suffer.

✅ Risks: heat illness, dehydration, and indoor temperatures above 90F

✅ Causes: utility shutoffs, aging grid, unpaid bills, remote areas

✅ Relief: cooling centers, aid programs, weatherization, bill credits


In a particular pocket of America, approximately 13,000 families endure the dual challenges of sweltering heat and living without electricity, and the broader risk of summer shut-offs highlights how widespread these pressures have become across the country. This article examines the factors contributing to their plight, the impact of living without electricity during hot weather, and efforts to alleviate these hardships.

Challenges Faced by Families

For these 13,000 families, daily life is significantly impacted by the absence of electricity, especially during the scorching summer months. Without access to cooling systems such as air conditioners or fans, residents are exposed to dangerously high temperatures, which can lead to heat-related illnesses and discomfort, particularly among vulnerable populations such as children, the elderly, and individuals with health conditions, where electricity's role in public health became especially evident.

Causes of Electricity Shortages

The reasons behind the electricity shortages vary. In some cases, it may be due to economic challenges that prevent families from paying utility bills, resulting in disconnections. Other factors include outdated or unreliable electrical infrastructure in underserved communities, as reflected in a recent grid vulnerability report that underscores systemic risks, where maintenance and upgrades are often insufficient to meet growing demand.

Impact of Extreme Heat

During heatwaves, the lack of electricity exacerbates health risks and quality of life issues for affected families, aligning with reports of more frequent outages across the U.S. Furthermore, the absence of refrigeration and cooking facilities can compromise food safety and nutritional intake, further impacting household well-being.

Community Support and Resilience

Despite these challenges, communities and organizations often rally to support families living without electricity. Local nonprofits, community centers, and government agencies provide assistance such as distributing fans, organizing cooling centers, and delivering essentials like bottled water and non-perishable food items during heatwaves to alleviate immediate hardships and improve summer blackout preparedness in vulnerable neighborhoods.

Long-term Solutions

Addressing electricity access issues requires comprehensive, long-term solutions. These may include policy reforms to ensure equitable access to affordable energy, investments in upgrading infrastructure in underserved areas, and expanding financial assistance programs to help families maintain uninterrupted electricity service, in recognition that climate change risks increasingly stress the grid.

Advocacy and Awareness

Advocacy efforts play a crucial role in raising awareness about the challenges faced by families living without electricity and advocating for sustainable solutions. By highlighting these issues, community leaders, activists, and policymakers can work together to drive policy changes, secure funding for infrastructure improvements, and promote energy efficiency initiatives, drawing lessons from Canada's harsh-weather grid exposures that illustrate regional vulnerabilities.

Building Resilience

Building resilience in vulnerable communities involves not only improving access to reliable electricity but also enhancing preparedness for extreme weather events. This includes developing emergency response plans, educating residents about heat safety measures, and fostering community partnerships to support those in need during crises.

Conclusion

As temperatures rise and climate impacts intensify, addressing the plight of families living without electricity becomes increasingly urgent. By prioritizing equitable access to energy, investing in resilient infrastructure, and fostering community resilience, stakeholders can work towards ensuring that all families have access to essential services, even during the hottest months of the year. Collaborative efforts between government, nonprofit organizations, and community members are essential in creating sustainable solutions that improve quality of life and promote health and well-being for all residents.


Related News

View more

Electrifying: New cement makes concrete generate electricity

Cement-Based Conductive Composite transforms concrete into power by energy harvesting via triboelectric nanogenerator action, carbon fibers, and built-in capacitors, enabling net-zero buildings and self-sensing structural health monitoring from footsteps, wind, rain, and waves.


Key Points

A carbon fiber cement that harvests and stores energy as electricity, enabling net-zero, self-sensing concrete.

✅ Uses carbon fibers to create a conductive concrete matrix

✅ Acts as a triboelectric nanogenerator and capacitor

✅ Enables net-zero, self-sensing structural health monitoring


Engineers from South Korea have invented a cement-based composite that can be used in concrete to make structures that generate and store electricity through exposure to external mechanical energy sources like footsteps, wind, rain and waves, and even self-powering roads concepts.

By turning structures into power sources, the cement will crack the problem of the built environment consuming 40% of the world’s energy, complementing vehicle-to-building energy strategies across the sector, they believe.

Building users need not worry about getting electrocuted. Tests showed that a 1% volume of conductive carbon fibres in a cement mixture was enough to give the cement the desired electrical properties without compromising structural performance, complementing grid-scale vanadium flow batteries in the broader storage landscape, and the current generated was far lower than the maximum allowable level for the human body.

Researchers in mechanical and civil engineering from from Incheon National University, Kyung Hee University and Korea University developed a cement-based conductive composite (CBC) with carbon fibres that can also act as a triboelectric nanogenerator (TENG), a type of mechanical energy harvester.

They designed a lab-scale structure and a CBC-based capacitor using the developed material to test its energy harvesting and storage capabilities, similar in ambition to gravity storage approaches being scaled.

“We wanted to develop a structural energy material that could be used to build net-zero energy structures that use and produce their own electricity,” said Seung-Jung Lee, a professor in Incheon National University’s Department of Civil and Environmental Engineering, noting parallels with low-income housing microgrids in urban settings.

“Since cement is an indispensable construction material, we decided to use it with conductive fillers as the core conductive element for our CBC-TENG system,” he added.

The results of their research were published this month in the journal Nano Energy.

Apart from energy storage and harvesting, the material could also be used to design self-sensing systems that monitor the structural health and predict the remaining service life of concrete structures without any external power, which is valuable in industrial settings where hydrogen-powered port equipment is being deployed.

“Our ultimate goal was to develop materials that made the lives of people better and did not need any extra energy to save the planet. And we expect that the findings from this study can be used to expand the applicability of CBC as an all-in-one energy material for net-zero energy structures,” said Prof. Lee, pointing to emerging circular battery recycling pathways for net-zero supply chains.

Publicising the research, Incheon National University quipped: “Seems like a jolting start to a brighter and greener tomorrow!”


Related News

View more

Mercury in $3 billion takeover bid for Tilt Renewables

Mercury Energy Tilt Renewables acquisition signals a trans-Tasman energy push as PowAR and Mercury split assets via a scheme of arrangement, offering $7.80 per share and a $2.96b valuation across Australia and New Zealand.


Key Points

A PowAR-Mercury deal to buy Tilt Renewables, splitting Australian and New Zealand assets via a court-approved scheme.

✅ $7.80 per share, valuing Tilt at $2.96b

✅ PowAR takes AU assets; Mercury gets NZ business

✅ Infratil and Mercury to vote for the scheme


Mercury Energy and an Australian partner appear to have won the race to buy Tilt Renewables, an Australasian wind farm developer which was spun out of TrustPower, bidding almost $3 billion, amid wider utility consolidation such as the Peterborough Distribution sale to Hydro One.

Yesterday Tilt Renewables announced that it had entered a scheme implementation agreement under which it was proposed that PowAR would acquire its Australian business and Mercury would acquire the New Zealand business, mirroring cross-border approvals where U.S. antitrust clearance shaped Hydro One's bid for Avista.

Conducted through a scheme of arrangement, Tilt shareholders will be offered $7.80 a share, valuing Tilt at $2.96b.

Yesterday morning shares in Tilt opened about 18 per cent up at $7.65, though regulatory outcomes can swing valuations as seen when Hydro One-Avista reconsideration of a U.S. order came into play.

In early December Infratil, which owns around two thirds of Tilt's shares, announced it was undertaking a review of its investment after receiving approaches, with investor sentiment sensitive to governance shifts as when Hydro One shares fell after leadership changes in Ontario.

According to a report in the Australian Financial Review, the transtasman bid beat out other parties including ASX-listed APA Group, Canadian pension fund CDPQ and Australian fund manager Infrastructure Capital Group, as Canadian investors like Ontario Teachers' Plan pursue similar infrastructure deals.

“This compelling acquisition proposal is a result of Tilt Renewables’ constant focus on delivering long-term value for shareholders and the board is pleased that, with these new owners, the transition to renewables in Australia and New Zealand will continue to accelerate,” Tilt’s chairman Bruce Harker said.

Comparable community-led clean energy partnerships, such as initiatives with British Columbia First Nations highlighted in clean-energy generation, underscore the broader momentum.

Just prior to the announcement, Tilt shares had been trading for less than $4. Such repricing reflects how utilities can face perceived uncertainties, as one investor argued too many unknowns at the time.

Mercury is already Tilt’s second largest shareholder, at just under 20 per cent. Both Infratil and Mercury have agreed to vote in favour of the scheme. The deal values Tilt’s New Zealand business at $770m, however the value of Mercury’s existing shareholding is around $585m, meaning the company will increase debt by around $185m.


Related News

View more

Salmon and electricity at center of Columbia River treaty negotiations

Columbia River Treaty Negotiations involve Canada-U.S. talks on B.C. dams, flood control, hydropower sharing, and downstream benefits, prioritizing ecosystem health, First Nations rights, and salmon restoration while balancing affordable electricity for northwest consumers.


Key Points

Talks to update flood control, hydropower, and ecosystem terms for fair benefits to B.C. and U.S. communities.

✅ Public consultations across B.C.'s Columbia Basin

✅ First Nations priorities include salmon restoration

✅ U.S. seeks cheaper power; B.C. defends downstream benefits


With talks underway between Canada and the U.S. on the future of the Columbia River Treaty, the B.C. New Democrats have launched public consultations in the region most affected by the high-stakes negotiation.

“We want to ensure Columbia basin communities are consulted, kept informed and have their voices heard,” said provincial cabinet minister Katrine Conroy via a press release announcing meetings this month in Castlegar, Golden, Revelstoke, Nakusp, Nelson and other communities.

As well as having cabinet responsibility for the talks, Conroy’s Kootenay West riding includes several places that were inundated under the terms of the 1964 flood control and power generation treaty.

“We will continue to work closely with First Nations affected by the treaty, to ensure Indigenous interests are reflected in the negotiations,” she added by way of consolation to Indigenous people who’ve been excluded from the negotiating teams on both sides of the border.

#google#

The stakes are also significant for the province as a whole. The basics of the treaty saw B.C. build dams to store water on this side of the border, easing the flood risk in the U.S. and allowing the flow to be evened out through the year. In exchange, B.C. was entitled to a share of the additional hydro power that could be generated in dams on the U.S. side.

B.C.’s sale of those downstream benefits to the U.S has poured almost $1.4 billion into provincial coffers over the past 10 years, albeit at a declining rate these days amid scrutiny from a regulator report on BC Hydro that raised concerns, because of depressed prices for cross-border electricity sales.

Politicians on the U.S. side have long sought to reopen the treaty, believing there was now a case for reducing B.C.’s entitlement.

They did not get across the threshold under President Barack Obama.

Then, last fall his successor Donald Trump served notice of intent, initiating the formal negotiations that commenced with a two day session last week in Washington, D.C. The next round is set for mid-August in B.C.

American objectives in the talks include “continued, careful management of flood risk; ensuring a reliable and economical power supply; and better addressing ecosystem concerns,” with recognition of recent BC Hydro demand declines during the pandemic.

“Economical power supply,” being a diplomatic euphemism for “cheaper electricity for consumers in the northwest states,” achievable by clawing back most of B.C.’s treaty entitlement.

On taking office last summer, the NDP inherited a 14-point statement of principles setting out B.C. hopes for negotiations to “continue the treaty” while “seeking improvements within the existing framework” of the 54-year-old agreement.

The New Democrats have endorsed those principles in a spirit of bipartisanship, even as Manitoba Hydro governance disputes play out elsewhere in Canada.

“Those principles were developed with consultation from throughout the region,” as Conroy advised the legislature this spring. “So I was involved, as well, in the process and knew what the issues were, right as they would come up.”

The New Democrats did chose to put additional emphasis on some concerns.

“There is an increase in discussion with Canada and First Nations on the return of salmon to the river,” she advised the house, recalling how construction of the enormous Grand Coulee Dam on the U.S. side in the 1930s wiped out salmon runs on the upper Columbia River.

“There was no consideration then for how incredibly important salmon was, especially to the First Nations people in our region. We have an advisory table that is made up of Indigenous representation from our region, and also we are discussing with Canada that we need to see if there’s feasibility here.”

As to feasibility, the obstacles to salmon migration in the upper reaches of the Columbia include the 168-metre high Grand Coulee and the 72-metre Chief Joseph dams on the U.S. side, plus the Keenleyside (52 metres), Revelstoke (175 metres) and Mica (240 metres) dams on the Canadian side.

Still, says Conroy “the First Nations from Canada and the tribes from the United States, have been working on scientific and technical documents and research to see if, first of all, the salmon can come up, how they can come up, and what the things are that have to be done to ensure that happens.”

The New Democrats also put more emphasis on preserving the ecosystem, aligning with clean-energy efforts with First Nations that support regional sustainability.

“I know that certainly didn’t happen in 1964, but that is something that’s very much on the minds of people in the Columbia basin,” said Conroy. “If we are going to tweak the treaty, what can we do to make sure the voices of the basin are heard and that things that were under no consideration in the ’60s are now a topic for consideration?”

With those new considerations, there’s still the status quo concern of preserving the downstream benefits as a trade off for the flooding and other impacts on this side of the border.

The B.C. position on that score is the same under the New Democrats as it was under the Liberals, despite a B.C. auditor general report on deferred BC Hydro costs.

“The level of benefits to B.C., which is currently solely in the form of the (electricity) entitlement, does not account for the full range of benefits in the U.S. or the impacts in B.C.,” says the statement of principle.

“All downstream U.S. benefits such as flood risk management, hydropower, ecosystems, water supply (including municipal, industrial and agricultural uses), recreation, navigation and other related benefits should be accounted for and such value created should be shared equitably between the two countries.”

No surprise if the Americans do not see it the same way.  But that is a topic for another day.


Related News

View more

Which of the cleaner states imports dirty electricity?

Hourly Electricity Emissions Tracking maps grid balancing areas, embodied emissions, and imports/exports, revealing carbon intensity shifts across PJM, ERCOT, and California ISO, and clarifying renewable energy versus coal impacts on health and climate.


Key Points

An hourly method tracing generation, flows, and embodied emissions to quantify carbon intensity across US balancing areas.

✅ Hourly traces of imports/exports and generation mix

✅ Consumption-based carbon intensity by balancing area

✅ Policy insights for renewables, coal, health costs


In the United States, electricity generation accounts for nearly 30% of our carbon emissions. Some states have responded to that by setting aggressive renewable energy standards; others are hoping to see coal propped up even as its economics get worse. Complicating matters further is the fact that many regional grids are integrated, and as America goes electric the stakes grow, meaning power generated in one location may be exported and used in a different state entirely.

Tracking these electricity exports is critical for understanding how to lower our national carbon emissions. In addition, power from a dirty source like coal has health and environment impacts where it's produced, and the costs of these aren't always paid by the parties using the electricity. Unfortunately, getting reliable figures on how electricity is produced and where it's used is challenging, even for consumers trying to find where their electricity comes from in the first place, leaving some of the best estimates with a time resolution of only a month.

Now, three Stanford researchers—Jacques A. de Chalendar, John Taggart, and Sally M. Benson—have greatly improved on that standard, and they have managed to track power generation and use on an hourly basis. The researchers found that, of the 66 grid balancing areas within the United States, only three have carbon emissions equivalent to our national average, and they have found that imports and exports of electricity have both seasonal and daily changes. de Chalendar et al. discovered that the net results can be substantial, with imported electricity increasing California's emissions/power by 20%.

Hour by hour
To figure out the US energy trading landscape, the researchers obtained 2016 data for grid features called balancing areas. The continental US has 66 of these, providing much better spatial resolution on the data than the larger grid subdivisions. This doesn't cover everything—several balancing areas in Canada and Mexico are tied in to the US grid—and some of these balancing areas are much larger than others. The PJM grid, serving Pennsylvania, New Jersey, and Maryland, for example, is more than twice as large as Texas' ERCOT, in a state that produces and consumes the most electricity in the US.

Despite these limitations, it's possible to get hourly figures on how much electricity was generated, what was used to produce it, and whether it was used locally or exported to another balancing area. Information on the generating sources allowed the researchers to attach an emissions figure to each unit of electricity produced. Coal, for example, produces double the emissions of natural gas, which in turn produces more than an order of magnitude more carbon dioxide than the manufacturing of solar, wind, or hydro facilities. These figures were turned into what the authors call "embodied emissions" that can be traced to where they're eventually used.

Similar figures were also generated for sulfur dioxide and nitrogen oxides. Released by the burning of fossil fuels, these can both influence the global climate and produce local health problems.

Huge variation
The results were striking. "The consumption-based carbon intensity of electricity varies by almost an order of magnitude across the different regions in the US electricity system," the authors conclude. The low is the Bonneville Power grid region, which is largely supplied by hydropower; it has typical emissions below 100kg of carbon dioxide per megawatt-hour. The highest emissions come in the Ohio Valley Electric region, where emissions clear 900kg/MW-hr. Only three regional grids match the overall grid emissions intensity, although that includes the very large PJM (where capacity auction payouts recently fell), ERCOT, and Southern Co balancing areas.

Most of the low-emissions power that's exported comes from the Pacific Northwest's abundant hydropower, while the Rocky Mountains area exports electricity with the highest associated emissions. That leads to some striking asymmetries. Local generation in the hydro-rich Idaho Power Company has embodied emissions of only 71kg/MW-hr, while its imports, coming primarily from Rocky Mountain states, have a carbon content of 625kg/MW-hr.

The reliance on hydropower also makes the asymmetry seasonal. Local generation is highest in the spring as snow melts, but imports become a larger source outside this time of year. As solar and wind can also have pronounced seasonal shifts, similar changes will likely be seen as these become larger contributors to many of these regional grids. Similar things occur daily, as both demand and solar production (and, to a lesser extent, wind) have distinct daily profiles.

The Golden State
California's CISO provides another instructive case. Imports represent less than 30% of its total electric use in 2016, yet California electricity imports provided 40% of its embodied emissions. Some of these, however, come internally from California, provided by the Los Angeles Department of Water and Power. The state itself, however, has only had limited tracking of imported emissions, lumping many of its sources as "other," and has been exporting its energy policies to Western states in ways that shape regional markets.

Overall, the 2016 inventory provides a narrow picture of the US grid, as plenty of trends are rapidly changing our country's emissions profile, including the rise of renewables and the widespread adoption of efficiency measures and other utility trends in 2017 that continue to evolve. The method developed here can, however, allow for annual updates, providing us with a much better picture of trends. That could be quite valuable to track things like how the rapid rise in solar power is altering the daily production of clean power.

More significantly, it provides a basis for more informed policymaking. States that wish to promote low-emissions power can use the information here to either alter the source of their imports or to encourage the sites where they're produced to adopt more renewable power. And those states that are exporting electricity produced primarily through fossil fuels could ensure that the locations where the power is used pay a price that includes the health costs of its production.


Related News

View more

Parsing Ontario's electricity cost allocation

Ontario Global Adjustment and ICI balance hydro rates, renewable cost shift, and peak demand. Class A and Class B customers face demand response decisions amid pandemic occupancy uncertainty and volatile GA charges through 2022.


Key Points

A pricing model where GA costs and ICI peak allocation shape Class A/B bills, driven by renewables cost shifts.

✅ Renewable cost shift trims GA; larger Class A savings expected.

✅ Class A peak strategy returns; occupancy uncertainty persists.

✅ Class B faces volatile GA; limited levers beyond efficiency.


Ontario’s large commercial electricity customers can approach the looming annual decision about their billing structure for the 12 months beginning July 1 with the assurance of long-term relief on a portion of their costs, amid changes coming for electricity consumers that could affect planning. That’s to be weighed against uncertainties around energy demand and whether a locked-in cost allocation formula that looked favourable in pre-pandemic times will remain so until June 30, 2022.

“The biggest unknown is we just don’t know when the people are coming back,” Jon Douglas, director of sustainability with Menkes Property Management Services, reflected during a webinar sponsored by the Building Owners and Managers Association (BOMA) of Greater Toronto last week. “The occupancy in our office buildings this fall, and going into the new year, could really impact the outcome of the decision.”

After a year of operational upheaval and more modifications to provincial electricity pricing policies, BOMA Toronto’s regularly scheduled workshop ahead of the June 15 deadline for eligible customers to opt into the Industrial Conservation Initiative (ICI) program had a lot of ground to cover. Notably, beginning in January, all commercial customers have seen a reduction in the global adjustment (GA) component of their monthly hydro bills after the Ontario government shifted costs associated with contracted non-hydroelectric renewable supply to reduce the burden on industrial ratepayers from electricity rates to the general provincial account — a move that trims approximately $258 million per month from the total GA charged to industrial and commercial customers. However, they won’t garner the full benefit of that until 2022 since they’re currently repaying about $333 million in GA costs that were deferred in April, May and June of 2020.

Renewable cost shift pares the global adjustment
For now, Ontario government officials estimate the renewable cost shift equates to a 12 per cent discount relative to 2020 prices, even as typical bills may rise about 2% as fixed pricing ends in some cases. Once last year’s GA deferral is repaid at the end of 2021, they project the average Class A customer participating in the ICI program should realize a 16 per cent saving on the total hydro bill, while Class B customers paying the GA on a volumetric per kilowatt-hour (kWh) basis will see a slightly more moderate 15 per cent decrease.

“This is the biggest change to electricity pricing that’s happened since the introduction of ICI,” Tim Christie, director of electricity policy, economics and system planning for Ontario’s Ministry of Energy, Northern Development and Mines, told online workshop attendees. “The government is funding the out-of-market costs of renewables. It does tail off into the 2030s as those contracts (for wind, solar and biomass generation) expire, but over the next eight-ish years, it’s pretty steady at around just over $3 billion per year.”

Extrapolating from 2020 costs, he pegged average electricity costs at roughly 9.1 cents/kWh for Class A commercial customers and 13.2 cents/kWh for Class B, a point of concern for Ontario manufacturers facing high rates as well. However, energy management specialists suggest actual 2021 numbers haven’t proved that out.

“In commercial buildings, we’re averaging 10 to 12 cents for Class A in 2021, and we’re seeing more than that for about 14, 15 cents for Class B,” reported Scott Rouse, managing partner with the consulting firm, Energy@Work.

GA costs for Class B customers dropped nearly 30 per cent in the first four months of 2021 compared to the last four months of 2020, when they averaged 11.8 cents/kWh. Thus far, though, there have been significant month-to-month fluctuations, with a low of 5.04 cents/kWh in February and a high of 10.9 cents/kWh in April contributing to the four-month average of 8.3 cents/kWh.

“In 2020, system-wide GA very often averaged more than $1 billion per month,” Rouse said. “This February it dropped to $500 million, which was really quite surprising. So it is a very volatile cost.”

Although welcome, the renewable cost shift does alter the payback on energy-saving investments, particularly for demand response mechanisms like energy storage. When combined with pandemic-related uncertainty and a series of policy and program reversals alongside calls to clean up Ontario’s hydro policy in recent years, the industry’s appetite for some more capital-intensive technologies appears to be flagging.

“Volatility puts a pause on some of the innovation,” said Terry Flynn, general manager with BentallGreenOak and chair of BOMA Toronto’s energy committee. “It could be a leading edge, but it might be a bleeding edge that won’t bear any fruit because the way the commodity costs are structured will change.”

“There’s kind of a wait-and-see approach on some of these bigger investments,” Douglas concurred.

Industrial Conservation Initiative underpins commercial class divide
Turning to the ICI, Class A customers — defined as those with average monthly energy demand of at least 1 megawatt (MW) — encountered some unexpected changes to the program rules during 2020. Meanwhile, Class B customers — encompassing the vast share of commercial properties smaller than about 350,000 square feet — confront the persistent reality of electricity cost allocation that offloads the burden from larger players onto them.

Through the ICI, participating Class A customers pay a share of the global adjustment that’s prorated to their energy use during the five hours of the period from May 1 to April 30 when the highest overall system demand is recorded. This gives Class A customers the opportunity to lock in a favourable factor for calculating their share of monthly system-wide global adjustment costs if they can successful project and curtail energy loads during those five hours of peak demand. On the flipside, Class B customers pay the remainder of those system-wide costs, on a straightforward per-kWh basis, once Class A payments have been reconciled.

“Class B has sometimes been regarded as the forgotten middle child of the customer classes in Ontario where all the shifted costs in the system kind of pile up,” acknowledged Mark Olsheski, vice president, energy and environment, with Sussex Strategy Group. “Likewise, there can be big unpredictable and uncontrollable swings in the global adjustment rate from month to month and, outside of pure energy efficiency, there really is precious little opportunity or empowerment for a Class B customer to take actions to lower their bills.”

Nevertheless, COVID-19 presents a few extra hiccups for Class A customers this year. Conventionally, late May is when they receive notification of the cost allocation factor that would be used to determine their GA for the upcoming July 1 to June 30 period. This year, though, all current ICI participants will retain the factor they secured by responding to the five hours of peak demand during the 12 months from May 1, 2019 to April 30, 2020 after the Ontario government placed a temporary halt on the peak demand response aspect of the program last summer. Regardless, eligible ICI participants must formally opt into the program by June 15 or they will be billed as Class B customers.

Peak chasing resumes for summer 2021
Since peak demand hours conventionally occur from June to September, Class A customers will once again be studying forecasts intently and preparing to respond via Peak Perks as the heat wave season sets in. That should help alleviate some of the system stresses that arose last summer — prompting policy-makers to reject lobbying for a continued pause on peak demand response.

“The policy rationale was to allow consumers to focus on their operations when recovering from COVID as opposed to reducing peaks. The other issue was that we did not expect the peaks to be high last summer given COVID shutdowns,” Christie recounted. “But due to some hot weather, more people at home and also the lack of ICI response, we saw peaks we haven’t seen in many, many years come up last summer. So the peak hiatus has ended and this summer we’ll be back to responding to ICI as per normal.”

Among Class A customers, owners/managers of office and retail facilities generally have the most to lose from a billing formula tied to the energy demand of more densely occupied buildings in the summer of 2019. However, they could be much more competitively positioned for 2022-23 if their buildings remain below full occupancy and energy demand stays lower than usual this summer.

“Where we can improve is the IESO (Independent Electricity System Operator) and the LDCs (local distribution companies) need to help customers get their real-time data, especially in light of the phantom demand issue, interpret their bills and their Class A versus B scenarios much more easily and comprehensively,” urged Lee Hodgkinson, vice president, technical services, sustainability and ESG, with Dream Unlimited. “ I look for APIs (application programming interface) and direct data flow from the LDCs to the building owners so that we can access that data really easily.”

Given Class A’s historic advantages, few eligible ICI participants are expected to migrate out to Class B. From a sustainability perspective, there’s perhaps more cause to question how the ICI’s 1-MW threshold encourages strategies to move in the other direction.

“You could jack up demand in some buildings and get them into Class A basically by firing up the chillers on the weekend and then pouring cooling outside to get rid of it,” Douglas noted. “That has nothing to do with climate change strategy or sustainability, but it’s a cost- saving strategy, and, sometimes, when you look at the math, it’s hundreds of thousands of dollars you can save.”

Brian Hewson, vice president, consumer protection and industry performance with the Ontario Energy Board (OEB), confirmed the OEB is currently scrutinizing the discrepancy that leaves Class B as the only consumer group with no flexibility to curtail energy load during higher-priced periods, and will be providing advice to the Ministry of Energy. In the interim, that status does, at least, simplify tactics.

“Just reduce your kWh and it doesn’t matter what time of day because you’re paying that fixed rate for 24 hours a day. So if you can curb your demand at night, you get a big bang for your dollar,” Rouse advised.

“We do talk about rates a lot, but if you’re not using it, you’re not paying for it,” Flynn agreed. “A lot of our focus is still on really to try to reduce the number of kilowatts that we use. That seems to be the best thing to do.”


Related News

View more

Sign Up for Electricity Forum’s Newsletter

Stay informed with our FREE Newsletter — get the latest news, breakthrough technologies, and expert insights, delivered straight to your inbox.

Electricity Today T&D Magazine Subscribe for FREE

Stay informed with the latest T&D policies and technologies.
  • Timely insights from industry experts
  • Practical solutions T&D engineers
  • Free access to every issue

Download the 2025 Electrical Training Catalog

Explore 50+ live, expert-led electrical training courses –

  • Interactive
  • Flexible
  • CEU-cerified