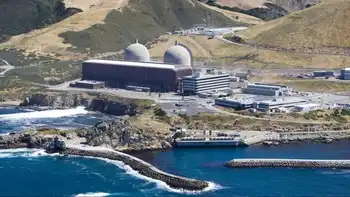
Clean B.C. is quietly using coal and gas power from out of province
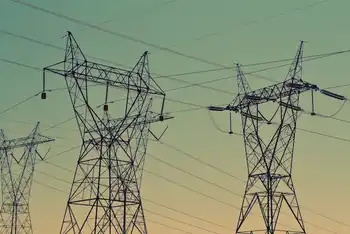

bc powerlines

High Voltage Maintenance Training Online

Our customized live online or in‑person group training can be delivered to your staff at your location.

  • Live Online
  • 12 hours Instructor-led
  • Group Training Available
Regular Price:
$599
Coupon Price:
$499
Reserve Your Seat Today

BC Hydro Electricity Imports shape CleanBC claims as Powerex trades cross-border electricity, blending hydro with coal and gas supplies, affecting emissions, grid carbon intensity, and how electric vehicles and households assess "clean" power.


Key Points

Powerex buys power for BC Hydro, mixing hydro with coal and gas, shifting emissions and affecting CleanBC targets.

✅ Powerex trades optimize price, not carbon intensity

✅ Imports can include coal- and gas-fired generation

✅ Emissions affect EV and CleanBC decarbonization claims


British Columbians naturally assume they’re using clean power when they fire up holiday lights, juice up a cell phone or plug in a shiny new electric car. 

That’s the message conveyed in advertisements for the CleanBC initiative launched by the NDP government, amid indications that residents are split on going nuclear according to a survey, which has spent $3.17 million on a CleanBC “information campaign,” including almost $570,000 for focus group testing and telephone town halls, according to the B.C. finance ministry.

“We’ll reduce air pollution by shifting to clean B.C. energy,” say the CleanBC ads, which feature scenic photos of hydro reservoirs. “CleanBC: Our Nature. Our Power. Our Future.” 

Yet despite all the bumph, British Columbians have no way of knowing if the electricity they use comes from a coal-fired plant in Alberta or Wyoming, a nuclear plant in Washington, a gas-fired plant in California or a hydro dam in B.C. 

Here’s why. 

BC Hydro’s wholly-owned corporate subsidiary, Powerex Corp., exports B.C. power when prices are high and imports power from other jurisdictions when prices are low. 

In 2018, for instance, B.C. imported more electricity than it exported — not because B.C. has a power shortage (it has a growing surplus due to the recent spate of mill closures and the commissioning of two new generating stations in B.C.) but because Powerex reaps bigger profits when BC Hydro slows down generators to import cheaper power, especially at night.

“B.C. buys its power from outside B.C., which we would argue is not clean,” says Martin Mullany, interim executive director for Clean Energy BC. 

“A good chunk of the electricity we use is imported,” Mullany says. “In reality we are trading for brown power” — meaning power generated from conventional ‘dirty’ sources such as coal and gas. 

Wyoming, which generates almost 90 per cent of its power from coal, was among the 12 U.S. states that exported power to B.C. last year. (Notably, B.C. did not export any electricity to Wyoming in 2018.)

Utah, where coal-fired power plants produce 70 per cent of the state’s energy amid debate over the costs of scrapping coal-fired electricity, and Montana, which derives about 55 per cent of its power from coal, also exported power to B.C. last year. 

So did Nebraska, which gets 63 per cent of its power from coal, 15 per cent from nuclear plants, 14 per cent from wind and three per cent from natural gas.   

Coal is responsible for about 23 per cent of the power generated in Arizona, another exporter to B.C., while gas produces about 44 per cent of the electricity in that state.  

In 2017, the latest year for which statistics are available, electricity imports to B.C. totalled just over 1.2 million tonnes of carbon dioxide emissions, according to the B.C. environment ministry — roughly the equivalent of putting 255,000 new cars on the road, using the U.S. Environmental Protection Agency’s calculation of 4.71 tonnes of annual carbon emissions for a standard passenger vehicle. 

These figures far outstrip the estimated local and upstream emissions from the contested Woodfibre LNG plant in Squamish that is expected to release annual emissions equivalent to 170,000 new cars on the road.

Import emissions cast a new light on B.C.’s latest “milestone” announcement that 30,000 electric cars are now among 3.7 million registered vehicles in the province.

BC Electric Vehicles Announcement Horgan Heyman Mungall Weaver
In November of 2018 the province announced a new target to have all new light-duty cars and trucks sold to be zero-emission vehicles by the year 2040. Photo: Province of B.C. / Flickr

“Making sure more of the vehicles driven in the province are powered by BC Hydro’s clean electricity is one of the most important steps to reduce [carbon] pollution,” said the November 28 release from the energy ministry, noting that electrification has prompted a first call for power in 15 years from BC Hydro.

Mullany points out that Powerex’s priority is to make money for the province and not to reduce emissions.

“It’s not there for the cleanest outcome,” he said. “At some time we have to step up to say it’s either the money or the clean power, which is more important to us?”

Electricity bought and sold by little-known, unregulated Powerex
These transactions are money-makers for Powerex, an opaque entity that is exempt from B.C.’s freedom of information laws. 

Little detailed information is available to the public about the dealings of Powerex, which is overseen by a board of directors comprised of BC Hydro board members and BC Hydro CEO and president Chris O’Reilly. 

According to BC Hydro’s annual service plan, Powerex’s net income ranged from $59 million to $436 million from 2014 to 2018. 

“We will never know the true picture. It’s a black box.” 

Powerex’s CEO Tom Bechard — the highest paid public servant in the province — took home $939,000 in pay and benefits last year, earning $430,000 of his executive compensation through a bonus and holdback based on his individual and company performance.  

“The problem is that all of the trade goes on at Powerex and Powerex is an unregulated entity,” Mullany says. 

“We will never know the true picture. It’s a black box.” 

In 2018, Powerex exported 8.7 million megawatt hours of electricity to the U.S. for a total value of almost $570 million, according to data from the Canada Energy Regulator. That same year, Powerex imported 9.6 million megawatt hours of electricity from the U.S. for almost $360 million. 

Powerex sold B.C.’s publicly subsidized power for an average of $87 per megawatt hour in 2018, according to the Canada Energy Regulator. It imported electricity for an average of $58 per megawatt hour that year. 

In an emailed statement in response to questions from The Narwhal, BC Hydro said “there can be a need to import some power to meet our electricity needs” due to dam reservoir fluctuations during the year and from year to year.

‘Impossible’ to determine if electricity is from coal or wind power
Emissions associated with electricity imports are on average “significantly lower than the emissions of a natural gas generating plant because we mostly import electricity from hydro generation and, increasingly, power produced from wind and solar,” BC Hydro claimed in its statement. 

But U.S. energy economist Robert McCullough says there’s no way to distinguish gas and coal-fired U.S. power exports to B.C. from wind or hydro power, noting that “electrons lack labels.” 

Similarly, when B.C. imports power from Alberta, where generators are shifting to gas and 48.5 per cent of electricity production is coal-fired and 38 per cent comes from natural gas, there’s no way to tell if the electricity is from coal, wind or gas, McCullough says.

“It really is impossible to make that determination.” 

Wyoming Gilette coal pits NASA
The Gillette coal pits in Wyoming, one of the largest coal-producers in the U.S. Photo: NASA Earth Observatory

Neither the Canada Energy Regulator nor Statistics Canada could provide annual data on electricity imports and exports between B.C. and Alberta. 

But you can watch imports and exports in real time on this handy Alberta website, which also lists Alberta’s power sources. 

In 2018, California, Washington and Oregon supplied considerably more power to B.C. than other states, according to data from Canada Energy Regulator. 

Washington, where about one-quarter of generated power comes from fossil fuels, led the pack, with more than $339 million in electricity exports to B.C. 

California, which still gets more than half of its power from gas-fired plants even though it leads the U.S. in renewable energy with substantial investments in wind, solar and geothermal, was in second place, selling about $18.4 million worth of power to B.C. 

And Oregon, which produces about 43 per cent of its power from natural gas and six per cent from coal, exported about $6.2 million worth of electricity to B.C. last year. 

By comparison, Nebraska’s power exports to B.C. totalled about $1.6 million, Montana’s added up to $1.3 million,  Nevada’s were about $706,000 and Wyoming’s were about $346,000.

Clean electrons or dirty electrons?
Dan Woynillowicz, deputy director of Clean Energy Canada, which co-chaired the B.C. government’s Climate Solutions and Clean Growth Advisory Council, says B.C. typically exports power to other jurisdictions during peak demand. 

Gas-fired plants and hydro power can generate electricity quickly, while coal-fired power plants take longer to ramp up and wind power is variable, Woynillowicz notes. 

“When you need power fast and there aren’t many sources that can supply it you’re willing to pay more for it.”

Woynillowicz says “the odds are high” that B.C. power exports are displacing dirty power.

Elsewhere in Canada, analysts warn that Ontario's electricity could get dirtier as policies change, raising similar concerns.

“As a consumer you never know whether you’re getting a clean electron or a dirty electron. You’re just getting an electron.” 


Related News

Related News

Tornadoes and More: What Spring Can Bring to the Power Grid

Spring Storm Grid Risks highlight tornado outbreaks, flooding, power outages, and transmission disruptions, with NOAA flood outlooks, coal and barge delays, vulnerable nuclear sites, and distribution line damage demanding resilience, reliability, and emergency preparedness.


Key Points

Spring Storm Grid Risks show how tornadoes and floods disrupt power systems, fuel transport, and plants guide resilience.

✅ Tornado outbreaks and derechos damage distribution and transmission

✅ Flooding drives outages via treefall, substation and plant inundation

✅ Fuel logistics disrupted: rail coal, river barges, road access


The storm and tornado outbreak that recently barreled through the US Midwest, South and Mid-Atlantic was a devastating reminder of how much danger spring can deliver, despite it being the “milder” season compared to summer and winter.  

Danger season is approaching, and the country is starting to see the impacts. 

The event killed at least 32 people across seven states. The National Weather Service is still tallying up the number of confirmed tornadoes, which has already passed 100. Communities coping with tragedy are assessing the damage, which so far includes at least 72 destroyed homes in one Tennessee county alone, and dozens more homes elsewhere. 

On Saturday, April 1–the day after the storm struck–there were 1.1 million US utility customers without power, even as EIA reported a January power generation surge earlier in the year. On Monday morning, April 3, there were still more than 80,000 customers in the dark, according to PowerOutage.us. The storm system brought disruptions to both distribution grids–those networks of local power lines you generally see running overhead to buildings–as well as the larger transmission grid in the Midwest, which is far less common than distribution-level issues. 

While we don’t yet have a lot of granular details about this latest storm’s grid impacts, recent shifts in demand like New York City's pandemic power patterns show how operating conditions evolve, and it’s worth going through what else the country might be in for this spring, as well as in future springs. Moreover, there are steps policymakers can take to prepare for these spring weather phenomena and bolster the reliability and resilience of the US power system. 

Heightened flood risk 
The National Oceanic Atmospheric Administration (NOAA) said in a recent outlook that about 44 percent of the United States is at risk of floods this spring, equating to about 146 million people. This includes most of the eastern half of the country, the federal agency said. 

The agency also sees “major” flood risk potential in some parts of the Upper Mississippi River Basin, and relatively higher risk in the Sierra Nevada region, due in part to a historic snowpack in California.  

Multiple components of the power system can be affected by spring floods. 

Power lines – Floods can saturate soil and make trees more likely to uproot and fall onto power lines. This has been contributing to power outages during California’s recent heavy storms–called atmospheric rivers–that started over the winter. In other regions, soil moisture has even been used as a predictor of where power outages will occur due to hurricanes, so that utility companies are better prepared to send line repair crews to the right areas. Hurricanes are primarily a summer and fall phenomenon, and summer also brings grid stress from air conditioning demand in many states, so for now, during spring, they are less of a concern.  

Fuel transport – Spring floods can hinder the transportation of fuels like coal. While it is a heavily polluting fossil fuel that is set to continue declining as a fuel source for US electricity generation, with the EIA summer outlook for wind and solar pointing to further shifts, coal still accounted for roughly 20 percent of the country’s generation in 2022.   

About 70 percent of US coal is transported at least part of the way by trains. The rail infrastructure to transport coal from the Powder River Basin in Montana and Wyoming–the country’s primary coal source–was proven to be vulnerable to extreme floods in the spring of 2011, and even more extreme floods in the spring of 2019. The 2019 floods’ disruptions of coal shipments to power plants via rail persisted for months and into the summertime, also affecting river shipments of coal by barge. In June 2019, hundreds of barges were stalled in the Mississippi River, through which millions of tons of the fossil fuel are normally transported. 

Power plants – Power plants themselves can also be at risk of flooding, since most of them are sited near a source of water that is used to create steam to spin the plants’ turbines, and conversely, low water levels can constrain hydropower as seen in Western Canada hydropower drought during recent reservoir shortfalls. Most US fossil fuel generating capacity from sources like methane gas, which recently set natural gas power records across the grid, and coal utilizes steam to generate electricity. 

However, much of the attention paid to the flood risk of power plant sites has centered on nuclear plants, a key source of low-carbon electricity discussed in IAEA low-carbon electricity lessons that also require a water source for the creation of steam, as well as for keeping the plant cool in an emergency. To name a notable flood example here in the United States–both visually and substantively–in 2011, the Fort Calhoun nuclear plant in Nebraska was completely surrounded by water due to late-spring flooding along the Missouri River. This sparked a lot of concerns because it was just a few months after the March 2011 meltdown of the Fukushima Daiichi nuclear plant in Japan. The public was thankfully not harmed by the Nebraska incident, but this was unfortunately not an isolated incident in terms of flood risks posed to the US nuclear power fleet. 


Related News

View more

U.S. Department of Energy Announces $110M for Carbon Capture, Utilization, and Storage

DOE CCUS Funding advances carbon capture, utilization, and storage with FEED studies, regional deployment, and CarbonSAFE site characterization, leveraging 45Q tax credits to scale commercial CO2 reduction across fossil energy sectors.


Key Points

DOE CCUS Funding are federal FOAs for commercial carbon capture, storage, and utilization via FEED and CarbonSAFE.

✅ $110M across FEED, Regional, and CarbonSAFE FOAs

✅ Supports Class VI permits, NEPA, and site characterization

✅ Enables 45Q credits and enhanced oil recovery utilization


The U.S. Department of Energy’s (DOE’s) Office of Fossil Energy (FE) has announced approximately $110 million in federal funding for cost-shared research and development (R&D) projects under three funding opportunity announcements (FOAs), alongside broader carbon-free electricity investments across the power sector.

Approximately $75M is for awards selected under two FOAs announced earlier this fiscal year; $35M is for a new FOA.

These FOAs further the Administration’s commitment to strengthening coal while protecting the environment. Carbon capture, utilization, and storage (CCUS) is increasingly becoming widely accepted as a viable option for fossil-based energy sources—such as coal- or gas-fired power plants under new EPA power plant rules and other industrial sources—to lower their carbon dioxide (CO2) emissions.

DOE’s program has successfully deployed various large-scale CCUS pilot and demonstration projects, and it is imperative to build upon these learnings to test, mature, and prove CCUS technologies at the commercial scale. A recent study by Science of the Total Environment found that DOE is the most productive organization in the world in the carbon capture and storage field.

“This Administration is committed to providing cost-effective technologies to advance CCUS around the world,” said Secretary Perry. “CCUS technologies are vital to ensuring the United States can continue to safely use our vast fossil energy resources, and we are proud to be a global leader in this field.”

“CCUS technologies have transformative potential,” said Assistant Secretary for Fossil Energy Steven Winberg. “Not only will these technologies allow us to utilize our fossil fuel resources in an environmentally friendly manner, but the captured CO2 can also be utilized in enhanced oil recovery and emerging CO2-to-electricity concepts, which would help us maximize our energy production.”

Under the first FOA award, Front-End Engineering Design (FEED) Studies for Carbon Capture Systems on Coal and Natural Gas Power Plants, DOE has selected nine projects to receive $55.4 million in federal funding for cost-shared R&D. The selected projects will support FEED studies for commercial-scale carbon capture systems. Find project descriptions HERE. 

Under the second FOA award, Regional Initiative to Accelerate CCUS Deployment, DOE selected four projects to receive up to $20 million in federal funding for cost-shared R&D. The projects also advance existing research and development by addressing key technical challenges; facilitating data collection, sharing, and analysis; evaluating regional infrastructure, including CO2 storage hubs and pipelines; and promoting regional technology transfer. Additionally, this new regional initiative includes newly proposed regions or advanced efforts undertaken by the previous Regional Carbon Sequestration Partnerships (RCSP) Initiative. Find project descriptions HERE. 

Elsewhere in North America, provincial efforts such as Quebec's and industry partners like Cascades are investing in energy efficiency projects to complement emissions-reduction goals.

Under the new FOA, Carbon Storage Assurance Facility Enterprise (CarbonSAFE): Site Characterization and CO2 Capture Assessment, DOE is announcing up to $35 million in federal funding for cost-shared R&D projects that will accelerate wide-scale deployment of CCUS through assessing and verifying safe and cost-effective anthropogenic CO2 commercial-scale storage sites, and carbon capture and/or purification technologies. These types of projects have the potential to take advantage of the 45Q tax credit, bolstered by historic U.S. climate legislation, which provides a tax credit for each ton of CO2 sequestered or utilized. The credit was recently increased to $35/metric ton for enhanced oil recovery and $50/metric ton for geologic storage.

Projects selected under this new FOA shall perform the following key activities: complete a detailed site characterization of a commercial-scale CO2 storage site (50 million metric tons of captured CO2 within a 30 year period); apply and obtain an underground injection control class VI permit to construct an injection well; complete a CO2capture assessment; and perform all work required to obtain a National Environmental Policy Act determination for the site.


Related News

View more

Wind power making gains as competitive source of electricity

Canada Wind Energy Costs are plunging as renewable energy auctions, CfD contracts, and efficient turbines drive prices to 2-4 cents/kWh across Alberta and Saskatchewan, outcompeting grid power via competitive bidding and improved capacity factors.


Key Points

Averaging 2-4 cents/kWh via auctions, CfD support, and bigger turbines, wind is now cost-competitive across Canada.

✅ Alberta CfD bids as low as 3.9 cents/kWh.

✅ Turbine outputs rose from 1 MW to 3.3 MW per tower.

✅ Competitive auctions cut costs ~70% over nine years.


It's taken a decade of technological improvement and a new competitive bidding process for electrical generation contracts, but wind may have finally come into its own as one of the cheapest ways to create power.

Ten years ago, Ontario was developing new wind power projects at a cost of 28 cents per kilowatt hour (kWh), the kind of above-market rate that the U.K., Portugal and other countries were offering to try to kick-start development of renewables. 

Now some wind companies say they've brought generation costs down to between 2 and 4 cents — something that appeals to provinces that are looking to significantly increase their renewable energy deployment plans.

The cost of electricity varies across Canada, by province and time of day, from an average of 6.5 cents per kWh in Quebec to as much as 15 cents in Halifax.

Capital Power, an Edmonton-based company, recently won a contract for the Whitla 298.8-megawatt (MW) wind project near Medicine Hat, Alta., with a bid of 3.9 cents per kWh, at a time when three new solar facilities in Alberta have been contracted at lower cost than natural gas, underscoring the trend. That price covers capital costs, transmission and connection to the grid, as well as the cost of building the project.

Jerry Bellikka, director of government relations, said Capital Power has been building wind projects for a decade, in the U.S., Alberta, B.C. and other provinces. In that time the price of wind generation equipment has been declining continually, while the efficiency of wind turbines increases.


Increased efficiency

"It used to be one tower was 1 MW; now each turbine generates 3.3 MW. There's more electricity generated per tower than several years ago," he said.

One wild card for Whitla may be steel prices — because of the U.S. and Canada slapping tariffs on one other's steel and aluminum products. Whitla's towers are set to come from Colorado, and many of the smaller components from China.


Canada introduces new surtaxes to curb flood of steel imports

"We haven't yet taken delivery of the steel. It remains to be seen if we are affected by the tariffs." Belikka said.

Another company had owned the site and had several years of meteorological data, including wind speeds at various heights on the site, which is in a part of southern Alberta known for its strong winds.

But the choice of site was also dependent on the municipality, with rural Forty Mile County eager for the development, Belikka said.


Alberta aims for 30% electricity from wind by 2030

Alberta wants 30 per cent of its electricity to come from renewable sources by 2030 and, as an energy powerhouse, is encouraging that with a guaranteed pricing mechanism in what is otherwise a market-bidding process.

While the cost of generating energy for the Alberta Electric System Operator (AESO) fluctuates hourly and can be a lot higher when there is high demand, the winners of the renewable energy contracts are guaranteed their fixed-bid price.

The average pool price of electricity last year in Alberta was 5 cents per kWh; in boom times it rose to closer to 8 cents. But if the price rises that high after the wind farm is operating, the renewable generator won't get it, instead rebating anything over 3.9 cents back to the government.

On the other hand, if the average or pool price is a low 2 cents kWh, the province will top up their return to 3.9 cents.

This contract-for-differences (CfD) payment mechanism has been tested in renewable contracts in the U.K. and other jurisdictions, including some U.S. states, according to AESO.


Competitive bidding in Saskatchewan

In Saskatchewan, the plan is to double its capacity of renewable electricity, to 50 per cent of generation capacity, by 2030, and it uses an open bidding system between the private sector generator and publicly owned SaskPower.

In bidding last year on a renewable contract, 15 renewable power developers submitted bids, with an average price of 4.2 cents per kWh.

One low bidder was Potentia with a proposal for a 200 MW project, which should provide electricity for 90,000 homes in the province, at less than 3 cents kWh, according to Robert Hornung of the Canadian Wind Energy Association.

"The cost of wind energy has fallen 70 per cent in the last nine years," he says. "In the last decade, more wind energy has been built than any other form of electricity."

Ontario remains the leading user of wind with 4,902 MW of wind generation as of December 2017, most of that capacity built under a system that offered an above-market price for renewable power, put in place by the previous Liberal government.

In June of last year, the new Conservative government of Doug Ford halted more than 700 renewable-energy projects, one of them a wind farm that is sitting half-built, even as plans to reintroduce renewable projects continue to advance.

The feed-in tariff system that offered a higher rate to early builders of renewable generation ended in 2016, but early contracts with guaranteed prices could last up to 20 years.

Hornung says Ontario now has an excess of generating capacity, as it went on building when the 2008-9 bust cut market consumption dramatically.

But he insists wind can compete in the open market, offering low prices for generation when Ontario needs new  capacity.

"I expect there will be competitive processes put in place. I'm quite confident wind projects will continue to go ahead. We're well positioned to do that."


Related News

View more

California's future with income-based flat-fee utility bills is getting closer

California Income-Based Utility Fees would overhaul electricity bills as CPUC weighs fixed charges tied to income, grid maintenance costs, AB 205 changes, and per-kilowatt-hour rates, shifting from pure usage pricing to hybrid utility rate design.


Key Points

Income-based utility fees are fixed monthly charges tied to earnings, alongside per-kWh rates, to help fund grid costs.

✅ CPUC considers fixed charges by income under AB 205

✅ Separates grid costs from per-kWh energy charges

✅ Could shift rooftop solar and EV charging economics


Electricity bills in California are likely to change dramatically in 2026, with major changes under discussion statewide.

The California Public Utilities Commission (CPUC) is in the midst of an unprecedented overhaul of the way most of the state’s residents pay for electricity, as it considers revamping electricity rates to meet grid and climate goals.

Utility bills currently rely on a use-more pay-more system, where bills are directly tied to how much electricity a resident consumes, a setup that helps explain why prices are soaring for many households.

California lawmakers are asking regulators to take a different approach, and some are preparing to crack down on utility spending as oversight intensifies. Some of the bill will pay for the kilowatt hours a customer uses and a monthly fixed fee will help pay for expenses to maintain the electric grid: the poles, the substations, the batteries, and the wires that bring power to people’s homes.

The adjustments to the state’s public utility code, section 739.9, came about because of changes written into a sweeping energy bill passed last summer, AB 205, though some lawmakers now aim to overturn income-based charges in subsequent measures.

A stroke of a pen, a legislative vote, and the governor’s signature created a move toward unprecedented income-based fixed charges across the state.

“This was put in at the last minute,” said Ahmad Faruqui, a California economist with a long professional background in utility rates. “Nobody even knew it was happening. It was not debated on the floor of the assembly where it was supposedly passed. Of course, the governor signed it.”

Faruqui wonders who was responsible for legislation that was added to the energy bill during the budget writing process. That process is not transparent.

“It’s a very small clause in a very long bill, which is mostly about other issues,” Faruqui said.

But that small adjustment could have a massive impact on California residents, because it links the size of a monthly flat fee for utility service to a resident’s income. Earn more money and pay a higher flat fee.

That fee must be paid even before customers are charged for how much power they draw.

Regulators interpreted legislative change as a mandate, but Faruqui is not sold.

“They said the commission may consider or should consider,” Faruqui said. “They didn’t mandate it. It’s worth re-reading it.”

In fact, the legislative language says the commission “may” adopt income-based flat fees for utilities. It does not say the commission “should” adopt them.

Nevertheless, the CPUC has already requested and received nine proposals for how a flat fee should be implemented, as regulators face calls for action amid soaring electricity bills.

The suggestions came from consumer groups, environmentalists, the solar industry and utilities.


Related News

View more

South Australia rides renewables boom to become electricity exporter

Australia electricity grid transition is accelerating as renewables, wind, solar, and storage drive decentralised generation, emissions cuts, and NEM trade shifts, with South Australia becoming a net exporter post-Hazelwood closure and rooftop solar surging.


Key Points

Australia electricity shift to renewables, distributed generation and storage, cutting emissions, reshaping NEM flows.

✅ South Australia now exports power post-Hazelwood closure

✅ Rooftop solar is the fastest-growing NEM generation source

✅ Gas peaking and storage investments balance variable renewables


The politics may not change much, but Australia’s electricity grid is changing before our very eyes – slowly and inevitably becoming more renewable, more decentralised, and in step with Australia's energy transition that is challenging the pre-conceptions of many in the industry.

The latest national emissions audit from The Australia Institute, which includes an update on key electricity trends in the national electricity market, notes some interesting developments over the last three months.

The most surprising of those developments may be the South Australia achievement, which shows that since the closure of the Hazelwood brown coal generator in Victoria in March 2017, and as renewables outpacing brown coal in other markets, South Australia has become a net exporter of electricity, in net annualised terms.

Hugh Saddler, lead author of the study, notes that this is a big change for South Australia, which in 1999 and 2000, when it had only gas and local coal, used to import 30% of its electricity demand.

#google#

The fact that wholesale prices in South Australia were higher in other states – then, as they are now – has nothing to with wind and solar, but the fact that it has no low-cost conventional source and a peaky demand profile (then and now).

“The difference today is that the state is now taking advantage of its abundant resources of wind and solar radiation, and the new technologies which have made them the lowest cost sources of new generation, to supply much of its electricity requirements,” Saddler writes.

Other things to note about the flows between states is that Victoria was about equal on imports and exports with its three neighbouring states, despite the closure of Hazelwood. NSW continues to import around 10% of its needs from cheaper providers in Queensland.

Gas-fired generation had increased in the last year or two in South Australia as a result of the Northern closure, but is still below the levels of a decade ago.

But because it is expensive, this is likely to spur more investment in storage.

As for rooftop solar, Saddler notes that the share of residential solar in the grid is still relatively small but, despite excess solar risks flagged by distributors, it is the most steadily growing generation source in the NEM.

That line is expected to grow steadily. By 2040, or perhaps 2050, the share of distributed generation, which includes rooftop solar, battery storage and demand management, is expected to reach nearly half of all Australia’s grid demand.

Saddler, says, however, that the increase in large-scale solar over the last few months is a significant milestone in Australia’s transition towards clean electricity generation, mirroring trends in India's on-grid solar development seen in recent years. (See very top graph).

“Firstly, they are a concrete demonstration that the construction cost advantage, which wind enjoyed over solar until a year or two ago, is gone.

“From now on we can expect new capacity to be a mix of both technologies. Indeed, the Clean Energy Regulator states that it expects solar to account for half of all (new renewable) capacity by 2020, and the US is moving toward 30% from wind and solar as well.”


Related News

View more

Duke Energy seeks changes in how solar owners are paid for electricity

Duke Energy Net Metering Proposal updates rooftop solar compensation with time-of-use rates, lower grid credits, and a minimum charge, aligning payments with electricity demand in North Carolina pending regulators' approval.


Key Points

A plan to swap flat credits for time-of-use rates and a minimum charge for rooftop solar customers in North Carolina.

✅ Time-of-use credits vary by grid demand

✅ $10 minimum use charge plus $14 basic fee

✅ Aims to align solar payouts with actual electricity value


Duke Energy has proposed new rules for how owners of rooftop solar panels are paid for electricity they send to the electric grid. It could mean more complexity and lower payments, but the utility says rates would be fairer.

State legislators have called for changes in the payment rules — known as "net metering" policies that allow households to sell power back to energy firms.

Right now, solar panel owners who produce more electricity than they need get credits on their bills, equal to whatever they pay for electricity. Under the proposed changes, the credit would be lower and would vary according to electricity demand, said Duke spokesperson Randy Wheeless.

"So in a cold winter morning, like now, you would get more, but maybe in a mild spring day, you would get less," Wheeless said Tuesday. "So, it better reflects what the price of electricity is."

Besides setting rates by time of use, solar owners also would have to pay a minimum of $10 a month for electricity, even if they don't use any from the grid. That's on top of Duke's $14 basic charge. Duke said it needs the extra revenue to pay for grid infrastructure to serve solar customers.

The proposal is the result of an agreement between Duke and solar industry groups — the North Carolina Sustainable Energy Association; the Southern Environmental Law Center, which represented Vote Solar and the Southern Alliance for Clean Energy; solar panel maker Sunrun Inc.; and the Solar Energy Industries Association.

The deal is similar to one approved by regulators in South Carolina last year, while in Nova Scotia a solar charge was delayed after controversy.

Daniel Brookshire of the North Carolina Sustainable Energy Association said he hopes the agreement will help the solar industry.

"We reached an agreement here that we think will provide certainty over the next decade, at least, for those interested in pursuing solar for their homes, and for our members who are solar installers," Brookshire said.

But other environmental and consumer groups oppose the changes, amid debates over who pays for grid upgrades elsewhere. Jim Warren with NC WARN said the rules would slow the expansion of rooftop solar in North Carolina.

"It would make it even harder for ordinary people to go solar," Warren said. "This would make it more complicated and more expensive, even for wealthier homeowners."

State regulators still must approve the proposal, even as courts weigh aspects of the electricity monopoly in related solar cases. If state regulators approve it, rates for new net metering customers would take effect Jan. 1, 2023.


Related News

View more

Sign Up for Electricity Forum’s Newsletter

Stay informed with our FREE Newsletter — get the latest news, breakthrough technologies, and expert insights, delivered straight to your inbox.

Electricity Today T&D Magazine Subscribe for FREE

Stay informed with the latest T&D policies and technologies.
  • Timely insights from industry experts
  • Practical solutions T&D engineers
  • Free access to every issue

Download the 2025 Electrical Training Catalog

Explore 50+ live, expert-led electrical training courses –

  • Interactive
  • Flexible
  • CEU-cerified