CSA Z463 Electrical Maintenance -
Our customized live online or in‑person group training can be delivered to your staff at your location.

- Live Online
- 6 hours Instructor-led
- Group Training Available
Regular Price:
$249
Coupon Price:
$199
A July insert provided in customers' electric bill statements by Duncan Public Utility boasted the following heading: "Electric Energy Costs Are Coming Down."
The reason for the decrease in costs, according to the insert, was that hydropower conditions had improved. But when those same customers opened their August statements, they got quite a shock.
"When my wife opened our bill, I heard her scream," Mayor Gene Brown said during the Aug. 14 City Council meeting. The price in electricity had not decreased as DPU indicated it would. Instead, the cost of electricity rose dramatically, and this nationwide trend has left many questioning why.
The reason is as multi-faceted as an algebra equation. In order to understand the outcome, one not only has to grasp each individual variable, but also understand how those variables relate to one another in order to form the solution.
The first part of the electric equation focuses on from where our energy supply is coming. Duncan uses four different forms of energy generation to power the community: coal, hydroelectricity, natural gas and wind.
Coal makes up the bulk of Duncan's power source and is the least expensive. Its effect on the environment, though, has generated a lot of concern as global warming becomes more than a thing of the future. Hydroelectricity comes in second.
While hydropower is more expensive than coal, it has the benefit of being a renewable energy source. Hydropower, however, is also dependent on weather, so that if drought conditions are present, power production decreases, even though costs remain the same as if the facility were running at full capacity.
Natural gas takes third place. It is the third most expensive form of power generation but, like hydropower, it has the benefit of being more environmentally friendly.
Wind power fills the last spot. It is the most expensive power supply. While wind power harnesses another natural resource, it has its downfalls. By itself, wind power is not reliable enough nor strong enough to power a significant amount of the demand.
In this hierarchy of power supplies, balance is key. While getting all of the energy needed to power the community from the cheapest source - coal - would be a break for the checking account, it would result in disaster.
If coal supply suddenly becomes short and all of the city's power is resting on it, the outcome would be no electricity. By maintaining separate power sources, when one falls short of the need, another can pick up the slack.
"You don't put all of your eggs in one basket," said Brian Alford, spokesman for Oklahoma Gas and Electric (OG&E). "It's important to maintain a balance of fuels." That combination of supply and balance is part of the key to understanding why electric rates continue to climb.
"What's killed us was as hydroelectricity went down, our coal went down," said David Yeager, Duncan Power electric utility director.
The result was a turn to natural gas, the third costliest form of power generation, to make up the energy deficit left by the lack of coal and water power. That cost is then deflected back to the customer, who has to pay for what is being used. And, because the cost of natural gas is dictated by the law of supply and demand, the price is never certain.
"It's like your gas prices," said Drake Rice, Oklahoma Municipal Power Authority director of member services. "You see what they do. That's what your natural gas prices do - they're up and down." Natural gas prices began to really escalate following Hurricane Quatrain in September 2005.
Before the hurricane hit, the cost of natural gas was a mere $6.93. By December, the cost had risen to $13.37. It hasn't slowed down.
"Over the last four years, our wholesales prices have gone from about $7.5 million to $11.5 million," Yeager said. Because Duncan doesn't have the means to produce its own power, the city purchases electricity from other places - it buys it wholesale. The increase in wholesale prices can again be traced back to what power sources are available.
As an example, say the city's power supply is a combination of 60 percent coal, 30 percent hydroelectricity, 9 percent natural gas and 1 percent wind power.
Suddenly, coal production drops because of transportation cost increases, train derailments or various other causes. That drop reduces the available coal power supply to the city by 20 percent. Hydroelectricity also decreases at this time because of dry weather conditions. That drop then reduces the available hydroelectricity power supply to the city by 10 percent. Now, the city has to make up 30 percent of its missing power supply.
The next option on the list is natural gas, which comes with an expensive price tag. Instead of having to pay for only 9 percent of the natural gas electric cost, the customer now has to pay for 39 percent.
And, because natural gas is, again, a precious commodity, an increase in demand equals an increase in price.
The second part of the electric equation deals with the fuel cost adjustment (FCA) rate, which relates back to power sources and their supply. It dictates what customers' electric rates will be.
"It's based on previous costs and then we talk to our supplier and find out their best estimate on what future costs are going to be," Yeager said.
The first part of the FCA rate focuses on those past costs and future estimates. Because the electric utility industry does not permit fixed costs of supplies over long periods of time, actual costs of the individual power sources are not known until they change.
By looking at the previous costs of electricity and the future estimated cost, it becomes possible to reach a logical and educated estimate of how much electric rates will increase or decrease. When those estimates are incorrect, there is an adjustment in the rates that reflects the cost difference.
The second part of the FCA rate goes back to the balance of power supplies and their individual costs. Using the same example, the city gets its power from 60 percent coal, 40 percent hydroelectricity, 9 percent natural gas and 1 percent wind power. With that balance of energy sources, it costs the city $3.50 per megawatt hour to produce power.
Then, coal and hydropower production go down, leaving natural gas to cover the 30 percent deficit in power. Because natural gas is more expensive than the other two, the city pays more. It now costs the city $4.50 per megawatt hour to produce power. That dollar difference has to be made up somehow and the city recovers the cost through a FCA of $1 per megawatt hour used.
"From January to June, our fuel cost adjustment was as high as it's ever been," Yeager said. "More people are generating electricity from natural gas." So the question becomes why did the DPU insert say electric costs were going down when they seem to just be increasing? The answer is all in the energy equation.
Because the FCA is based on past costs and projected costs, the here and now doesn't count until it's come and gone. FCA rates are looked at every month, but adjustments usually take a few months to make.
Yeager said rates did decrease after June and they are expected to lower again for October, November and December. But as long as natural gas remains a precious commodity and the demand for it continues to grow, electric rates are likely to keep increasing, leaving the cost of power generation to be passed down to those who use it.
Related News
Coalition pursues extra $7.25B for DOE nuclear cleanup, job creation
DOE Environmental Management Funding Boost seeks $7.25B to accelerate nuclear cleanup, upgrade Savannah River Site…
View more
Aging U.S. power grid threatens progress on renewables, EVs
U.S. Grid Modernization is critical for renewable energy integration, EV adoption, climate resilience, and reliability,…
View more

Europe Is Losing Nuclear Power Just When It Really Needs Energy
Europe's Nuclear Energy Policy shapes responses to the energy crisis, soaring gas prices, EU taxonomy…
View more
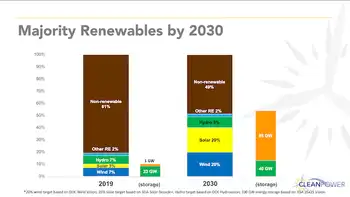
U.S. Renewable and Clean Energy Industries Set Sights on Market Majority
U.S. Majority Renewables by 2030 targets over half of electricity from wind, solar, hydropower, and…
View more

94,000 lose electricity in LA area after fire at station
Los Angeles Power Station Fire prompts LADWP to shut a Northridge/Reseda substation, causing a San…
View more

China boosts wind energy, photovoltaic and concentrated solar power
China Renewable Energy Law drives growth in wind power, solar thermal, and photovoltaic capacity, supporting…
View more
Sign Up for Electricity Forum’s Newsletter
Stay informed with our FREE Newsletter — get the latest news, breakthrough technologies, and expert insights, delivered straight to your inbox.
Electricity Today T&D Magazine Subscribe for FREE

Stay informed with the latest T&D policies and technologies.
- Timely insights from industry experts
- Practical solutions T&D engineers
- Free access to every issue
