Farmers angry about proposed power line path

By Associated Press


Substation Relay Protection Training

Our customized live online or in‑person group training can be delivered to your staff at your location.

  • Live Online
  • 12 hours Instructor-led
  • Group Training Available
Regular Price:
$699
Coupon Price:
$599
Reserve Your Seat Today
Growers and ranchers in the southern reaches of California are posing the latest obstacle to the state's push for green power.

Facing the possibility of losing land to power transmission lines, they have urged state commissioners to avoid their property when selecting a route for a project linking consumers on the coast to renewable energy operations in the Southern California desert.

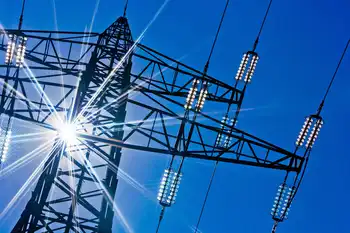
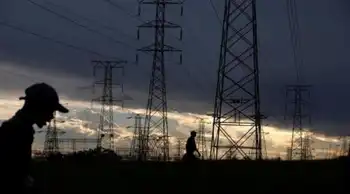
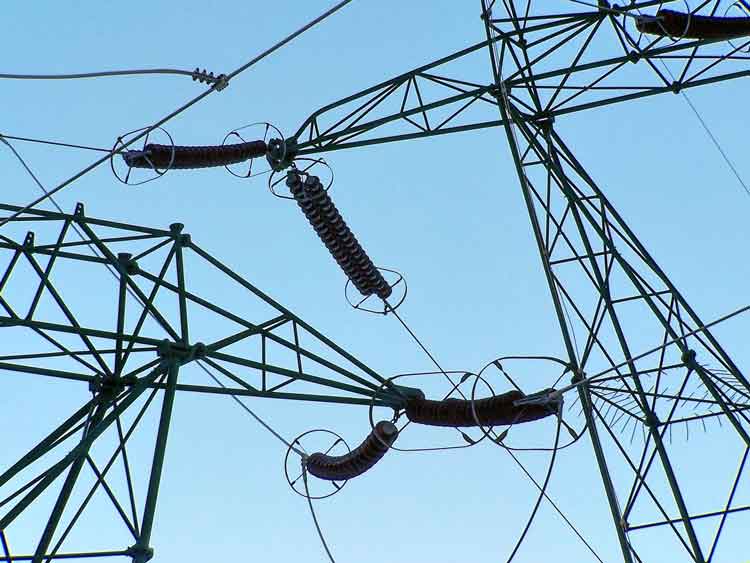
San Diego Gas & Electric Co. contends that stringing high-voltage lines over agricultural land in San Diego and Imperial counties as part of its $1.5-billion Sunrise Powerlink project is the most secure and economic way to deliver wind, solar and geothermal energy.

Farmers counter that utility profits from the project would come at their expense.

"They're going to come in and pay a few thousand dollars for the land they're taking and that's all you get. You lose the revenue from that land forever," said Katie Moretti, whose family has raised cattle for more than a century in San Diego County.

The dispute is part of a growing conflict between farmers and utilities, as California's mandate for power providers to boost their use of renewable energy prompts new projects across the state.

Apple growers in San Bernardino County are fighting a proposal by the Los Angeles Department of Water and Power to string transmission lines through their orchards to carry geothermal energy from inland sources.

The lines in San Diego and Imperial counties would idle at least 860 acres now used to raise cattle and grow wheat, alfalfa and other feed crops, according to California Public Utilities Commission documents.

The land would be used to accommodate transmission towers, access roads and other infrastructure needed for the project.

Karen Mills, a lawyer for the California Farm Bureau Federation, said the project's proponents vastly underestimate the acreage that could be impacted, because crop duster planes and tractors would have to steer clear of the power lines and towers, leaving more land unusable.

Imperial County farmer Doug Westmoreland said the lines proposed for his property could hamper production on hundreds of the 3,500 acres he farms.

"The actual power line footprint isn't that big, but it would be akin to having a post in the middle of a freeway," he said. "It creates havoc."

The commission must approve a final route for the lines before the utility can compel farmers to sell property through eminent domain. A final decision on the route could come in December.

The lines would stretch 150 miles through the center of the two counties and carry enough power for 750,000 homes. The utility would build the power line but buy the juice from a host of generating companies whose proposed plants harness energy from the sun, wind and underground heat.

The entire route would include 554 towers.

Some opponents of the plan are urging SDG&E to adopt an alternative route along an existing power line easement just north of the Mexico border that avoids most agricultural land.

But the utility said its preferred northern route offers more security by keeping the project separate from existing power lines and saves money because it goes through gentler terrain.

It also would pass closer to sources of underground geothermal energy near the Salton Sea, which might be tapped in the future.

"We have to connect the supply areas where the resources are at with the areas of consumption, and that's one of the big challenges we have here in California," said Mike Niggli, chief operating officer of Sempra Energy's utilities business, which includes SDG&E.

Related News

Ontario Extends Off-Peak Electricity Rates to Provide Relief for Families, Small Businesses and Farms

Ontario Off-Peak Electricity Rate Relief extends 8.5 cents/kWh pricing 24/7 for residential, small business, and farm customers, covering Time-Of-Use and tiered plans to stabilize utility bills during COVID-19 Stay-at-Home measures across Ontario.


Key Points

A province-wide 8.5 cents/kWh price applied 24/7 until Feb 22, 2021 for TOU and tiered users to reduce electricity bills

✅ 8.5 cents/kWh, applied 24/7 through Feb 22, 2021

✅ Available to TOU and tiered OEB-regulated customers

✅ Automatic on bills for homes, small businesses, farms


The Ontario government is once again extending electricity rate relief for families, small businesses and farms to support those spending more time at home while the province maintains the Stay-at-Home Order in the majority of public health regions. The government will continue to hold electricity prices to the off-peak rate of 8.5 cents per kilowatt-hour, compared with higher peak rates elsewhere in the day, until February 22, 2021. This lower rate is available 24 hours per day, seven days a week for Time-Of-Use and tiered customers.

"We know staying at home means using more electricity during the day when electricity prices are higher, that's why we are once again extending the off-peak electricity rate to provide households, small businesses and farms with stable and predictable electricity bills when they need it most," said Greg Rickford, Minister of Energy, Northern Development and Mines, Minister of Indigenous Affairs. "We thank Ontarians for continuing to follow regional Stay-at-Home orders to help stop the spread of COVID-19."

The off-peak rate came into effect January 1, 2021, providing families, farms and small businesses with immediate electricity rate relief, and for industrial and commercial companies, stable pricing initiatives have provided additional certainty. The off-peak rate will now be extended until the end of day February 22, 2021, for a total of 53 days of emergency rate relief. During this period, and alongside temporary disconnect moratoriums for residential customers, the off-peak price will continue to be automatically applied to electricity bills of all residential, small business, and farm customers who pay regulated rates set by the Ontario Energy Board and get a bill from a utility.

"We extend our thanks to the Ontario Energy Board and local distribution companies across the province, including Hydro One, for implementing this extended emergency rate relief and supporting Ontarians as they continue to work and learn from home," said Bill Walker, Associate Minister of Energy.


Related News

View more

Africa must quadruple power investment to supply electricity for all, IEA says

Africa Energy Investment must quadruple, says IEA, to deliver electricity access via grids, mini-grids, and stand-alone solar PV, wind, hydropower, natural gas, and geothermal, targeting $120 billion annually and 2.5% of GDP.


Key Points

Africa Energy Investment funds reliable, low-carbon electricity via grids, mini-grids, and renewables.

✅ Requires about $120B per year, or 2.5% of GDP

✅ Mix: grids, mini-grids, stand-alone solar PV and wind

✅ Targets reliability, economic growth, and electricity access


African countries will need to quadruple their rate of investment in their power sectors for the next two decades to bring reliable electricity to all Africans, as outlined in the IEA’s path to universal access analysis, an International Energy Agency (IEA) study published on Friday said.

If African countries continue on their policy trajectories, 530 million Africans will still lack electricity in 2030, the IEA report said. It said bringing reliable electricity to all Africans would require annual investment of around $120 billion and a global push for clean, affordable power to mobilize solutions.

“We’re talking about 2.5% of GDP that should go into the power sector,” Laura Cozzi, the IEA’s Chief Energy Modeller, told journalists ahead of the report’s launch. “India’s done it over the past 20 years. China has done it, with solar PV growth outpacing any other fuel, too. So it’s something that is doable.”

Taking advantage of technological advances and optimizing natural resources, as highlighted in a renewables roadmap, could help Africa’s economy grow four-fold by 2040 while requiring just 50% more energy, the agency said.

Africa’s population is currently growing at more than twice the global average rate. By 2040, it will be home to more than 2 billion people. Its cities are forecast to expand by 580 million people, a historically unprecedented pace of urbanization.

While that growth will lead to economic expansion, it will pile pressure on power sectors that have already failed to keep up with demand, with the sub-Saharan electricity challenge intensifying across the region. Nearly half of Africans - around 600 million people - do not have access to electricity. Last year, Africa accounted for nearly 70% of the global population lacking power, a proportion that has almost doubled since 2000, the IEA found.

Some 80% of companies in sub-Saharan Africa suffered frequent power disruptions in 2018, leading to financial losses that curbed economic growth.

The IEA recommended changing how power is distributed, with mini-grids and stand-alone systems like household solar playing a larger role in complementing traditional grids as targeted efforts to accelerate access funding gain momentum.

According to IEA Executive Director Fatih Birol, with the right government policies and energy strategies, Africa has an opportunity to pursue a less carbon-intensive development path than other regions.

“To achieve this, it has to take advantage of the huge potential that solar, wind, hydropower, natural gas and energy efficiency offer,” he said.

Despite possessing the world’s greatest solar potential, Africa boasts just 5 gigawatts of solar photovoltaics (PV), or less than 1% of global installed capacity, a slow green transition that underscores the scale of the challenge, the report stated.

To meet demand, African nations should add nearly 15 gigawatts of PV each year through 2040. Wind power should also expand rapidly, particularly in Ethiopia, Kenya, Senegal and South Africa. And Kenya should develop its geothermal resources.


Related News

View more

Magnitude 5 quake strikes near Iran nuclear plant

Iran Bushehr Earthquake rattles southern province near the Bushehr nuclear power plant, USGS reports M5.1 at 38 km depth; seismic activity along major fault lines raises safety, damage, and monitoring concerns.


Key Points

A magnitude 5.1 quake near Bushehr nuclear plant at 38 km depth, with no damage reported, per USGS.

✅ USGS lists magnitude 5.1 at 38 km depth

✅ Near Bushehr nuclear power plant; built for stronger quakes

✅ Iran lies on major fault lines; quake risk is frequent


A magnitude 5 earthquake struck southern Iran early Friday near the Islamic Republic's only nuclear power plant. There were no immediate reports of damage or injuries as Iran continues combined-cycle conversions across its power sector.

The quake hit Iran's Bushehr province at 5:23 a.m., according to the U.S. Geological Survey. It put the magnitude at 5.1 and the depth of the earthquake at 38 kilometres (24 miles), in a province tied to efforts to transmit electricity to Europe in coming years.

Iranian state media did not immediately report on the quake. However, the Bushehr nuclear power plant was designed to withstand much stronger earthquakes, a notable consideration as Iraq plans nuclear power plants to address shortages.

A magnitude 5 earthquake can cause considerable damage, including power disruptions that have seen blackouts spark protests in some Iranian cities.

Iran sits on major fault lines and is prone to near-daily earthquakes, yet it remains a key player in regional power, with Iran-Iraq energy cooperation ongoing. In 2003, a 6.6-magnitude quake flattened the historic city of Bam, killing 26,000 people, and today Iran supplies 40% of Iraq's electricity through cross-border power deals. Bam is near the Bushehr nuclear plant, which wasn’t damaged at that time, while more recently Iran finalized deals to rehabilitate Iraq's power grid to improve resilience.


Related News

View more

Bright Feeds Powers Berlin Facility with Solar Energy

Bright Feeds Solar Upgrade integrates a 300-kW DC PV system and 625 solar panels at the Berlin, CT plant, supplying one-third of power, cutting carbon emissions, and advancing clean, renewable energy in agriculture.


Key Points

An initiative powering Bright Feeds' Berlin plant with a 300-kW DC PV array, reducing costs and carbon emissions.

✅ 300-kW DC PV with 625 panels by Solect Energy

✅ Supplies ~33% of facility power; lowers operating costs

✅ Offsets 2,100+ tons CO2e; advances clean, sustainable agriculture


Bright Feeds, a New England-based startup, has successfully transitioned its Berlin, Connecticut, animal feed production facility to solar energy. The company installed a 300-kilowatt direct current (DC) solar photovoltaic (PV) system at its 25,000-square-foot plant, mirroring progress seen at projects like the Arvato solar plant in advancing onsite generation. This move aligns with Bright Feeds' commitment to sustainability and reducing its carbon footprint.

Solar Installation Details

The solar system comprises 625 solar panels and was developed and installed by Solect Energy, a Massachusetts-based company, reflecting momentum as projects like Building Energy's launch come online nationwide. Over its lifetime, the system is projected to offset more than 2,100 tons of carbon emissions, contributing significantly to the company's environmental goals. This initiative not only reduces energy expenses but also supports Bright Feeds' mission to promote clean energy solutions in the agricultural sector. 

Bright Feeds' Sustainable Operations

At its Berlin facility, Bright Feeds employs advanced artificial intelligence and drying technology to transform surplus food into an all-natural, nutrient-rich alternative to soy and corn in animal feed, complementing emerging agrivoltaics approaches that pair energy with agriculture. The company supplies its innovative feed product to a broad range of customers across the Northeast, including animal feed distributors and dairy farms. By processing food that would otherwise go to waste, the facility diverts tens of thousands of tons of food from the regional waste stream each year. When operating at full capacity, the environmental benefit of the plant’s process is comparable to taking more than 33,000 cars off the road annually.

Industry Impact

Bright Feeds' adoption of solar energy sets a precedent for sustainability in the agricultural sector. The integration of renewable energy sources into production processes not only reduces operational costs but also demonstrates a commitment to environmental stewardship, amid rising European demand for U.S. solar equipment that underscores market momentum. As the demand for sustainable practices grows, and as rural clean energy delivers measurable benefits, other companies in the industry may look to Bright Feeds as a model for integrating clean energy solutions into their operations.

Bright Feeds' initiative to power its Berlin facility with solar energy underscores the company's dedication to sustainability and innovation. By harnessing the power of the sun, Bright Feeds is not only reducing its carbon footprint but also contributing to a cleaner, more sustainable future for the agricultural industry, and when paired with solar batteries can further enhance resilience. This move serves as an example for other companies seeking to align their operations with environmental responsibility and renewable energy adoption, as new milestones like a U.S. clean energy factory signal expanding capacity across the sector.


Related News

View more

Which of the cleaner states imports dirty electricity?

Hourly Electricity Emissions Tracking maps grid balancing areas, embodied emissions, and imports/exports, revealing carbon intensity shifts across PJM, ERCOT, and California ISO, and clarifying renewable energy versus coal impacts on health and climate.


Key Points

An hourly method tracing generation, flows, and embodied emissions to quantify carbon intensity across US balancing areas.

✅ Hourly traces of imports/exports and generation mix

✅ Consumption-based carbon intensity by balancing area

✅ Policy insights for renewables, coal, health costs


In the United States, electricity generation accounts for nearly 30% of our carbon emissions. Some states have responded to that by setting aggressive renewable energy standards; others are hoping to see coal propped up even as its economics get worse. Complicating matters further is the fact that many regional grids are integrated, and as America goes electric the stakes grow, meaning power generated in one location may be exported and used in a different state entirely.

Tracking these electricity exports is critical for understanding how to lower our national carbon emissions. In addition, power from a dirty source like coal has health and environment impacts where it's produced, and the costs of these aren't always paid by the parties using the electricity. Unfortunately, getting reliable figures on how electricity is produced and where it's used is challenging, even for consumers trying to find where their electricity comes from in the first place, leaving some of the best estimates with a time resolution of only a month.

Now, three Stanford researchers—Jacques A. de Chalendar, John Taggart, and Sally M. Benson—have greatly improved on that standard, and they have managed to track power generation and use on an hourly basis. The researchers found that, of the 66 grid balancing areas within the United States, only three have carbon emissions equivalent to our national average, and they have found that imports and exports of electricity have both seasonal and daily changes. de Chalendar et al. discovered that the net results can be substantial, with imported electricity increasing California's emissions/power by 20%.

Hour by hour
To figure out the US energy trading landscape, the researchers obtained 2016 data for grid features called balancing areas. The continental US has 66 of these, providing much better spatial resolution on the data than the larger grid subdivisions. This doesn't cover everything—several balancing areas in Canada and Mexico are tied in to the US grid—and some of these balancing areas are much larger than others. The PJM grid, serving Pennsylvania, New Jersey, and Maryland, for example, is more than twice as large as Texas' ERCOT, in a state that produces and consumes the most electricity in the US.

Despite these limitations, it's possible to get hourly figures on how much electricity was generated, what was used to produce it, and whether it was used locally or exported to another balancing area. Information on the generating sources allowed the researchers to attach an emissions figure to each unit of electricity produced. Coal, for example, produces double the emissions of natural gas, which in turn produces more than an order of magnitude more carbon dioxide than the manufacturing of solar, wind, or hydro facilities. These figures were turned into what the authors call "embodied emissions" that can be traced to where they're eventually used.

Similar figures were also generated for sulfur dioxide and nitrogen oxides. Released by the burning of fossil fuels, these can both influence the global climate and produce local health problems.

Huge variation
The results were striking. "The consumption-based carbon intensity of electricity varies by almost an order of magnitude across the different regions in the US electricity system," the authors conclude. The low is the Bonneville Power grid region, which is largely supplied by hydropower; it has typical emissions below 100kg of carbon dioxide per megawatt-hour. The highest emissions come in the Ohio Valley Electric region, where emissions clear 900kg/MW-hr. Only three regional grids match the overall grid emissions intensity, although that includes the very large PJM (where capacity auction payouts recently fell), ERCOT, and Southern Co balancing areas.

Most of the low-emissions power that's exported comes from the Pacific Northwest's abundant hydropower, while the Rocky Mountains area exports electricity with the highest associated emissions. That leads to some striking asymmetries. Local generation in the hydro-rich Idaho Power Company has embodied emissions of only 71kg/MW-hr, while its imports, coming primarily from Rocky Mountain states, have a carbon content of 625kg/MW-hr.

The reliance on hydropower also makes the asymmetry seasonal. Local generation is highest in the spring as snow melts, but imports become a larger source outside this time of year. As solar and wind can also have pronounced seasonal shifts, similar changes will likely be seen as these become larger contributors to many of these regional grids. Similar things occur daily, as both demand and solar production (and, to a lesser extent, wind) have distinct daily profiles.

The Golden State
California's CISO provides another instructive case. Imports represent less than 30% of its total electric use in 2016, yet California electricity imports provided 40% of its embodied emissions. Some of these, however, come internally from California, provided by the Los Angeles Department of Water and Power. The state itself, however, has only had limited tracking of imported emissions, lumping many of its sources as "other," and has been exporting its energy policies to Western states in ways that shape regional markets.

Overall, the 2016 inventory provides a narrow picture of the US grid, as plenty of trends are rapidly changing our country's emissions profile, including the rise of renewables and the widespread adoption of efficiency measures and other utility trends in 2017 that continue to evolve. The method developed here can, however, allow for annual updates, providing us with a much better picture of trends. That could be quite valuable to track things like how the rapid rise in solar power is altering the daily production of clean power.

More significantly, it provides a basis for more informed policymaking. States that wish to promote low-emissions power can use the information here to either alter the source of their imports or to encourage the sites where they're produced to adopt more renewable power. And those states that are exporting electricity produced primarily through fossil fuels could ensure that the locations where the power is used pay a price that includes the health costs of its production.


Related News

View more

What Will Drive Utility Revenue When Electricity Is Free?

AI-Powered Utility Customer Experience enables transparency, real-time pricing, smart thermostats, demand response, and billing optimization, helping utilities integrate distributed energy resources, battery storage, and microgrids while boosting customer satisfaction and reducing costs.


Key Points

An approach where utilities use AI and real-time data to personalize service, optimize billing, and cut energy costs.

✅ Real-time pricing aligns retail and wholesale market signals

✅ Device control via smart thermostats and home energy management

✅ Analytics reveal appliance-level usage and personalized savings


The latest electric utility customer satisfaction survey results from the American Customer Satisfaction Index (ACSI) Energy Utilities report reveal that nearly every investor-owned utility saw customer satisfaction go down from 2018 to 2019. Residential customers are sending a clear message in the report: They want more transparency and control over energy usage, billing and ways to reduce costs.

With both customer satisfaction and utility revenues on the decline, utilities are facing daunting challenges to their traditional business models amid flat electricity demand across many markets today. That said, it is the utilities that see these changing times as an opportunity to evolve that will become the energy leaders of tomorrow, where the customer relationship is no longer defined by sales volume but instead by a utility company's ability to optimize service and deliver meaningful customer solutions.

We have seen how the proliferation of centralized and distributed renewables on the grid has already dramatically changed the cost profile of traditional generation and variability of wholesale energy prices. This signals the real cost drivers in the future will come from optimizing energy service with things like batteries, microgrids and peer-to-peer trading networks. In the foreseeable future, flat electricity rates may be the norm, or electricity might even become entirely free as services become the primary source of utility revenue.

The key to this future is technological innovation that allows utilities to better understand a customer’s unique needs and priorities and then deliver personalized, well-timed solutions that make customers feel valued and appreciated as their utility helps them save and alleviates their greatest pain points.

I predict utilities that adopt new technologies focused on customer experience, aligned with key utility trends shaping the sector, and deliver continual service improvements and optimization will earn the most satisfied, most loyal customers.

To illustrate this, look at how fixed pricing today is applied for most residential customers. Unless you live in one of the states with deregulated utilities where most customers are free to choose a service provider in a competitive marketplace, as consumers in power markets increasingly reshape offerings, fixed-rate tariffs or time-of-use tariffs might be the only rate structures you have ever known, though new utility rate designs are being tested nationwide today. These tariffs are often market distortions, bearing little relation to the real-time price that the utility pays on the wholesale market.

It can be easy enough to compare the rate you pay as a consumer and the market rate that utilities pay. The California ISO has a public dashboard -- as do other grid operators -- that shows the real-time marginal cost of energy. On a recent Friday, for example, a buyer in San Francisco could go to the real-time market and procure electricity at a rate of around 9.5 cents per kilowatt-hour (kWh), yet a residential customer can pay the utility PG&E between 22 cents and 49 cents per kWh amid major changes to electric bills being debated, depending on usage.

The problem is that utility customers do not usually see this data or know how to interpret it in a way that helps add value to their service or drive down the cost.

This is a scenario ripe for innovation. Artificial intelligence (AI) technologies are beginning to be applied to give customers the transparency and control over the energy they desire, and a new type of utility is emerging using real-time pricing signals from wholesale markets to give households hassle-free energy savings. Evolve Energy in Texas is developing a utility service model, even as Texas utilities revisit smart home network strategies, that delivers electricity to consumers at real-time market prices and connects to smart thermostats and other connected devices in the home for simple monitoring and control -- all managed via an intuitive consumer app.

My company, Bidgely, partners with utilities and energy retailers all over the world to apply artificial intelligence and machine learning algorithms to customer data in order to bring transparency to their electricity bills, showing exactly where the customers’ money is going down to the appliance and offering personalized, actionable advice on how to save.

Another example is from energy management company Keewi. Its wireless outlet adaptors are revealing real-time energy usage information to Texas A&M dorm residents as well as providing students the ability to conserve energy through controlling items in their rooms from their smartphones.

These are but a few examples of innovations among many in play that answer the consumer demand for increased transparency and control over energy usage.

Electric service providers will be closely watching how consumers respond to AI-driven innovation, including providers in traditionally regulated markets that are exploring equitable regulation approaches now, to stay aligned with policy and customer expectations. While regulated utilities have no reason to fear that their customers might sign up with a competitor, they understand that the revenues from electricity sales are going down and the deployment of distributed energy resources is going up. Both trends were reflected in a March report from Bloomberg New Energy Finance (via ThinkProgress) that claimed unsubsidized storage projects co-located with solar or wind are starting to compete with coal and gas for dispatchable power. Change is coming to regulated markets, and some of that change can be attributed to customer dissatisfaction with utility service.

Like so many industries before, the utility-customer relationship is on track to become less about measuring unit sales and more about driving revenue through services and delivering the best customer value. Loyal customers are most likely to listen and follow through on the utility’s advice and to trust the utility for a wide range of energy-related products and services. Utilities that make customer experience the highest priority today will emerge tomorrow as the leaders of a new energy service era.


Related News

View more

Sign Up for Electricity Forum’s Newsletter

Stay informed with our FREE Newsletter — get the latest news, breakthrough technologies, and expert insights, delivered straight to your inbox.

Electricity Today T&D Magazine Subscribe for FREE

Stay informed with the latest T&D policies and technologies.
  • Timely insights from industry experts
  • Practical solutions T&D engineers
  • Free access to every issue

Live Online & In-person Group Training

Advantages To Instructor-Led Training – Instructor-Led Course, Customized Training, Multiple Locations, Economical, CEU Credits, Course Discounts.

Request For Quotation

Whether you would prefer Live Online or In-Person instruction, our electrical training courses can be tailored to meet your company's specific requirements and delivered to your employees in one location or at various locations.