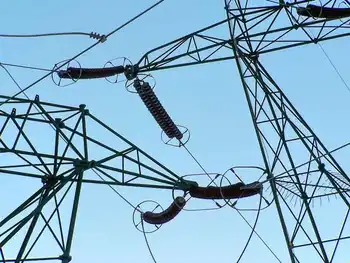
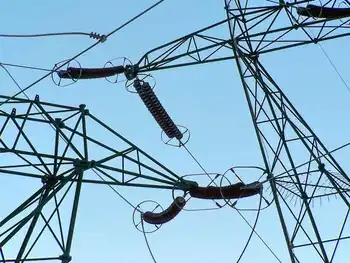
Germany agrees 200 bln euro package to shield against surging energy prices


German Chancellor Olaf Scholz

CSA Z462 Arc Flash Training - Electrical Safety Essentials

Our customized live online or in‑person group training can be delivered to your staff at your location.

  • Live Online
  • 6 hours Instructor-led
  • Group Training Available
Regular Price:
$249
Coupon Price:
$199
Reserve Your Seat Today

Germany Energy Price Defensive Shield counters soaring gas and electricity costs with a gas price brake, VAT cut, subsidies for households and SMEs, LNG terminals, renewables, temporary nuclear extension, and targeted borrowing to curb inflation.


Key Points

A 200 billion euro package to cap energy costs, subsidize basics, and stabilize inflation for firms and households.

✅ Gas price brake and VAT cut reduce consumer and SME energy bills.

✅ Temporary electricity subsidies and nuclear extension aid winter supply.

✅ Funded via new borrowing; supports LNG and renewable expansion.


German Chancellor Olaf Scholz set out a 200 billion euro ($194 billion) "defensive shield", including a gas price brake and a cut in sales tax for the fuel, to protect companies and households from the impact of soaring energy prices in Germany.

Europe's biggest economy is trying to cope with surging gas and electricity costs, with local utilities seeking help, caused largely by a collapse in Russian gas supplies to Europe, which Moscow has blamed on Western sanctions following its invasion of Ukraine in February.

3 minute readSeptember 29, 202211:35 AM PDTLast Updated 6 days ago
Germany agrees 200 bln euro package to shield against surging energy prices
By Holger Hansen and Kirsti Knolle

"Prices have to come down, so the government will do everything it can. To this end, we are setting up a large defensive shield," said Scholz.

Under the plans, to run until spring 2024, the government will introduce an emergency price brake on gas, the details of which will be announced next month, while Europe weighs emergency measures to limit electricity prices across the bloc. It is scrapping a planned gas levy meant to help firms struggling with high spot market prices. 

A temporary electricity price brake will subsidise basic consumption for consumers and small and medium-sized companies, and complements an electricity subsidy for industries under discussion. Sales tax on gas will fall to 7% from 19%.

In its efforts to cut its dependence on Russian energy, Germany is also promoting the expansion of renewable energy and developing liquefied gas terminals, but rolling back European electricity prices remains complex.

To help households and companies weather any winter supply disruption, amid rising heating and electricity costs this winter, especially in southern Germany, two nuclear plants previously due to close by the end of this year will be able to keep running until spring 2023.

The package will be financed with new borrowing this year, as Berlin makes use of the suspension of a constitutionally enshrined limit on new debt of 0.35% of gross domestic product.

Finance Minister Christian Lindner has said he wants to comply with the limit again next year, even as the EU outlines gas price cap strategies for the market.

Lindner, of the pro-business Free Democrats (FDP) who share power with Scholz's Social Democrats and the Greens, said on Thursday the country's public finances were stable.

"We can put it no other way: we find ourselves in an energy war," said Lindner. "We want to clearly separate crisis expenditure from our regular budget management, we want to send a very clear signal to the capital markets."

He also said the steps would act as a brake on inflation, which hit its highest level in more than a quarter of century in September.

Opposition conservative Markus Soeder, premier of the southern state of Bavaria, said the steps gave the right signal.

"It gives industry and citizens confidence that we can get through the winter," he said.


Related News

Related News

Which of the cleaner states imports dirty electricity?

Hourly Electricity Emissions Tracking maps grid balancing areas, embodied emissions, and imports/exports, revealing carbon intensity shifts across PJM, ERCOT, and California ISO, and clarifying renewable energy versus coal impacts on health and climate.


Key Points

An hourly method tracing generation, flows, and embodied emissions to quantify carbon intensity across US balancing areas.

✅ Hourly traces of imports/exports and generation mix

✅ Consumption-based carbon intensity by balancing area

✅ Policy insights for renewables, coal, health costs


In the United States, electricity generation accounts for nearly 30% of our carbon emissions. Some states have responded to that by setting aggressive renewable energy standards; others are hoping to see coal propped up even as its economics get worse. Complicating matters further is the fact that many regional grids are integrated, and as America goes electric the stakes grow, meaning power generated in one location may be exported and used in a different state entirely.

Tracking these electricity exports is critical for understanding how to lower our national carbon emissions. In addition, power from a dirty source like coal has health and environment impacts where it's produced, and the costs of these aren't always paid by the parties using the electricity. Unfortunately, getting reliable figures on how electricity is produced and where it's used is challenging, even for consumers trying to find where their electricity comes from in the first place, leaving some of the best estimates with a time resolution of only a month.

Now, three Stanford researchers—Jacques A. de Chalendar, John Taggart, and Sally M. Benson—have greatly improved on that standard, and they have managed to track power generation and use on an hourly basis. The researchers found that, of the 66 grid balancing areas within the United States, only three have carbon emissions equivalent to our national average, and they have found that imports and exports of electricity have both seasonal and daily changes. de Chalendar et al. discovered that the net results can be substantial, with imported electricity increasing California's emissions/power by 20%.

Hour by hour
To figure out the US energy trading landscape, the researchers obtained 2016 data for grid features called balancing areas. The continental US has 66 of these, providing much better spatial resolution on the data than the larger grid subdivisions. This doesn't cover everything—several balancing areas in Canada and Mexico are tied in to the US grid—and some of these balancing areas are much larger than others. The PJM grid, serving Pennsylvania, New Jersey, and Maryland, for example, is more than twice as large as Texas' ERCOT, in a state that produces and consumes the most electricity in the US.

Despite these limitations, it's possible to get hourly figures on how much electricity was generated, what was used to produce it, and whether it was used locally or exported to another balancing area. Information on the generating sources allowed the researchers to attach an emissions figure to each unit of electricity produced. Coal, for example, produces double the emissions of natural gas, which in turn produces more than an order of magnitude more carbon dioxide than the manufacturing of solar, wind, or hydro facilities. These figures were turned into what the authors call "embodied emissions" that can be traced to where they're eventually used.

Similar figures were also generated for sulfur dioxide and nitrogen oxides. Released by the burning of fossil fuels, these can both influence the global climate and produce local health problems.

Huge variation
The results were striking. "The consumption-based carbon intensity of electricity varies by almost an order of magnitude across the different regions in the US electricity system," the authors conclude. The low is the Bonneville Power grid region, which is largely supplied by hydropower; it has typical emissions below 100kg of carbon dioxide per megawatt-hour. The highest emissions come in the Ohio Valley Electric region, where emissions clear 900kg/MW-hr. Only three regional grids match the overall grid emissions intensity, although that includes the very large PJM (where capacity auction payouts recently fell), ERCOT, and Southern Co balancing areas.

Most of the low-emissions power that's exported comes from the Pacific Northwest's abundant hydropower, while the Rocky Mountains area exports electricity with the highest associated emissions. That leads to some striking asymmetries. Local generation in the hydro-rich Idaho Power Company has embodied emissions of only 71kg/MW-hr, while its imports, coming primarily from Rocky Mountain states, have a carbon content of 625kg/MW-hr.

The reliance on hydropower also makes the asymmetry seasonal. Local generation is highest in the spring as snow melts, but imports become a larger source outside this time of year. As solar and wind can also have pronounced seasonal shifts, similar changes will likely be seen as these become larger contributors to many of these regional grids. Similar things occur daily, as both demand and solar production (and, to a lesser extent, wind) have distinct daily profiles.

The Golden State
California's CISO provides another instructive case. Imports represent less than 30% of its total electric use in 2016, yet California electricity imports provided 40% of its embodied emissions. Some of these, however, come internally from California, provided by the Los Angeles Department of Water and Power. The state itself, however, has only had limited tracking of imported emissions, lumping many of its sources as "other," and has been exporting its energy policies to Western states in ways that shape regional markets.

Overall, the 2016 inventory provides a narrow picture of the US grid, as plenty of trends are rapidly changing our country's emissions profile, including the rise of renewables and the widespread adoption of efficiency measures and other utility trends in 2017 that continue to evolve. The method developed here can, however, allow for annual updates, providing us with a much better picture of trends. That could be quite valuable to track things like how the rapid rise in solar power is altering the daily production of clean power.

More significantly, it provides a basis for more informed policymaking. States that wish to promote low-emissions power can use the information here to either alter the source of their imports or to encourage the sites where they're produced to adopt more renewable power. And those states that are exporting electricity produced primarily through fossil fuels could ensure that the locations where the power is used pay a price that includes the health costs of its production.


Related News

View more

Duke Energy seeks changes in how solar owners are paid for electricity

Duke Energy Net Metering Proposal updates rooftop solar compensation with time-of-use rates, lower grid credits, and a minimum charge, aligning payments with electricity demand in North Carolina pending regulators' approval.


Key Points

A plan to swap flat credits for time-of-use rates and a minimum charge for rooftop solar customers in North Carolina.

✅ Time-of-use credits vary by grid demand

✅ $10 minimum use charge plus $14 basic fee

✅ Aims to align solar payouts with actual electricity value


Duke Energy has proposed new rules for how owners of rooftop solar panels are paid for electricity they send to the electric grid. It could mean more complexity and lower payments, but the utility says rates would be fairer.

State legislators have called for changes in the payment rules — known as "net metering" policies that allow households to sell power back to energy firms.

Right now, solar panel owners who produce more electricity than they need get credits on their bills, equal to whatever they pay for electricity. Under the proposed changes, the credit would be lower and would vary according to electricity demand, said Duke spokesperson Randy Wheeless.

"So in a cold winter morning, like now, you would get more, but maybe in a mild spring day, you would get less," Wheeless said Tuesday. "So, it better reflects what the price of electricity is."

Besides setting rates by time of use, solar owners also would have to pay a minimum of $10 a month for electricity, even if they don't use any from the grid. That's on top of Duke's $14 basic charge. Duke said it needs the extra revenue to pay for grid infrastructure to serve solar customers.

The proposal is the result of an agreement between Duke and solar industry groups — the North Carolina Sustainable Energy Association; the Southern Environmental Law Center, which represented Vote Solar and the Southern Alliance for Clean Energy; solar panel maker Sunrun Inc.; and the Solar Energy Industries Association.

The deal is similar to one approved by regulators in South Carolina last year, while in Nova Scotia a solar charge was delayed after controversy.

Daniel Brookshire of the North Carolina Sustainable Energy Association said he hopes the agreement will help the solar industry.

"We reached an agreement here that we think will provide certainty over the next decade, at least, for those interested in pursuing solar for their homes, and for our members who are solar installers," Brookshire said.

But other environmental and consumer groups oppose the changes, amid debates over who pays for grid upgrades elsewhere. Jim Warren with NC WARN said the rules would slow the expansion of rooftop solar in North Carolina.

"It would make it even harder for ordinary people to go solar," Warren said. "This would make it more complicated and more expensive, even for wealthier homeowners."

State regulators still must approve the proposal, even as courts weigh aspects of the electricity monopoly in related solar cases. If state regulators approve it, rates for new net metering customers would take effect Jan. 1, 2023.


Related News

View more

Hurricane Michael by the numbers: 32 dead, 1.6 million homes, businesses without power

Hurricane Michael Statistics track catastrophic wind speed, storm surge, rainfall totals, power outages, evacuations, and fatalities across Florida and the Southeast, detailing Category 4 intensity, Saffir-Simpson scale impacts, and emergency response resources.


Key Points

Hurricane Michael statistics detail wind speed, storm surge, rainfall, outages, and deaths from Category 4 landfall.

✅ 155 mph landfall winds; 14 ft storm surge; 12 in rainfall max

✅ 1.6M without power; 30,000 restoring crews; 6 states emergency

✅ 325k ordered evacuations; 32 deaths; FEMA and Guard deployed


Hurricane Michael, a historic Category 4 storm, struck the Florida Panhandle early Wednesday afternoon, unleashing heavy rain, high winds and a devastating storm surge.


Here is a look at the dangerous storm by the numbers:

155 mph: Wind speed -- nearly the highest possible for a Category 4 hurricane -- with which Michael made landfall near Mexico Beach and Panama City. A hurricane with 157 mph or higher is a Category 5, the strongest on the Saffir-Simpson hurricane wind scale.

129 mph: Peak wind gust reported Wednesday at Tyndall Air Force Base, which is about 12 miles southeast of Panama City, Florida.

32: Number of storm-related deaths attributed to Michael thus far, including an 11-year-old girl who local officials say was killed when part of a metal carport crashed into her family's mobile home in Lake Seminole, Georgia, and a 38-year-old man who was killed when a tree fell onto his moving car in Statesville, North Carolina.


Waves take over a house as Hurricane Michael comes ashore in Alligator Point, Fla., Oct. 10, 2018.

14 feet: Maximum height forecast for the storm surge when Michael's strong winds pushed the ocean water onto land. A storm surge just over 9 feet was reported Wednesday in Apalachicola, Florida.

12 inches: Isolated maximum amount of rain that Michael was expected to dump across the Florida Panhandle and the state's Big Bend region, as well as in southeast Alabama and parts of southwest and central Georgia.

9 inches: Maximum amount of rain that Michael could bring to isolated areas from Virginia to North Carolina.

1.6 million: Number of homes and businesses without power in Florida, Alabama, Georgia, South Carolina, North Carolina and Virginia as of Friday morning, a reminder that extended outages can persist after major disasters.

30,000: Number of workers mobilized from across the country to help restore power, underscoring the risks of field repairs such as line crew injuries during recovery.

6: Number of states that had emergency declarations in anticipation of Michael: Florida, Alabama, Georgia, South Carolina, North Carolina and Virginia.

325,000: Estimated number of people in the storm's path who were told to evacuate by local authorities.

6,000: Approximate number of people who stayed in the roughly 80 shelters across Florida, Alabama, Georgia, South Carolina and North Carolina on Wednesday night, while those sheltering at home were urged to avoid overheated power strips that can spark fires.

3,000: Number of personnel the Federal Emergency Management Agency deployed ahead of landfall, while utilities prepared on-site staffing plans to maintain operations during widespread disruptions.

35: Number of counties in Florida, of the state's 67, where Gov. Rick Scott declared a state of emergency prior to landfall, and grid reliability warnings often underscore systemic risks during national emergencies.

3,500: Number of Florida National Guard troops activated for pre-landfall coordination and planning, with an emphasis on high water and search-and-rescue operations.

600: Number of Florida state troopers assigned to the Panhandle and Big Bend region to assist with response and recovery efforts, including public reminders about downed line safety in affected communities.

500: Number of disaster relief workers that the American Red Cross was sending to affected areas in the Sunshine State.

200: Approximate number of patients being evacuated from at least two hospitals in Florida due to damage from the hurricane, highlighting how critical facilities depend on staff who have raised workforce safety concerns during other crises. Bay Medical Center Sacred Heart in Panama City said in a statement Thursday that its facility was damaged during the storm and thus is transferring more than 200 patients, including 39 who are critically ill, to regional hospitals. Gulf Coast Regional Medical Center, also in Panama City, announced in a statement Thursday that it's evacuating its roughly approximately patients, starting with the most critically ill, "because of the infrastructure challenges in our community."


Related News

View more

BC Hydro cryptic about crypto mining electricity use

BC Hydro Crypto Mining Moratorium pauses high-load connection requests, as BCUC reviews electricity demand, gigawatt-hours and megawatt load forecasts, data center growth, and potential rate impacts on the power grid and industrial customers.


Key Points

A BC order pausing crypto mining connections while BC Hydro and BCUC assess load, grid impacts, and ratepayer risks.

✅ 18-month pause on new high-load crypto connections

✅ 1,403 MW in requests suspended; 273 MW existing or pending

✅ Seeks to manage demand, rates, and grid reliability


In its Nov. 1, 2022 load update briefing note to senior executives of the Crown corporation, BC Hydro shows that the entire large industrial sector accounted for 6,591 gigawatt-hours during the period – one percent less than forecast in the service plan.

BC Hydro censored load statistics about crypto mining, coal mining and chemicals from the briefing note, which was obtained under the freedom of information law and came amid scrutiny over B.C. electricity imports because it feared that disclosure would harm Crown corporation finances and third-party business interests.

Crypto mining requires high-powered computers to run and be cooled around the clock constantly. So much so that cabinet ordered the BC Utilities Commission (BCUC) last December to place an 18-month moratorium on crypto mining connection requests, while other jurisdictions, such as the N.B. Power crypto review, undertook similar pauses to assess impacts.


In a news release, the government said 21 projects seeking 1,403 megawatts were temporarily suspended. The government said that would be enough to power 570,000 homes or 2.1 million electric vehicles for a year.

A report issued by BC Hydro before Christmas said there were already 166 megawatts of power from operational projects at seven sites. Another six projects with 107 megawatts were nearing connection, bringing its total load to 273 megawatts.

Richard McCandless, a retired assistant deputy minister who analyzes the performance of BC Hydro and the Insurance Corp of British Columbia, said China's May 2021 ban on crypto mining had a major ripple effect on those seeking cheap and reliable power.

"When China cracked down, these guys fled to different areas," McCandless said in an interview. "So they took their computers and went somewhere else. Some wound up in B.C."

He said BC Hydro's secrecy about crypto loads appears rooted in the Crown corporation underestimating load demand, even as new generating stations were commissioned to bolster capacity.

"Crypto is up so dramatically; they didn't want to show that," McCandless said. "Maybe they didn't want to be seen as being asleep at the switch."

Indeed, BCUC's April 21 decision on BC Hydro's 2021 revenue forecasts through the 2025 fiscal year included BC Hydro's forecast increase for crypto and data centres of about 100 gigawatt-hours through fiscal 2024 before returning to 2021 levels by 2025. In addition, the BCUC document said that BC Hydro's December 2020 load forecast was lower than the previous one because of project cancellations and updated load requests, amid ongoing nuclear power debate in B.C.

"Given the segment's continued uncertainty and volatility, the forecast assumes these facilities are not long-lived," the BC Hydro application said.

A September 2022 report to the White House titled "Crypto-Assets in the United States" said increased electricity demand from crypto-asset mining could lead to rate increases.

"Crypto-asset mining in upstate New York increased annual household electric bills by [US]$82 and annual small business electric bills by [US]$164, with total net losses from local consumers and businesses estimated to be [US]$179 million from 2016-2018," the report said. The information mentioned Plattsburgh, New York's 18-month moratorium in 2018. Manitoba announced a similar suspension almost a month before B.C.

B.C.'s total core domestic load of 23,666 gigawatt-hours was two percent higher than the service plan amid BC Hydro call for power planning, with commercial and light industrial (9,198 gigawatt-hours) and residential (7,877 gigawatt-hours) being the top two customer segments.

"A cooler spring and warmer summer supported increased loads, as the Western Canada drought strained hydropower production regionally. However, warmer daytime temperatures in September impacted heating more than cooling," said the briefing note.

"Commercial and light industrial consumption benefited from warmer temperatures in August but has also been impacted to a lesser degree by the reduced heating load in the first three weeks of October."

Loads improved relative to 2021, but offices, retail businesses and restaurants remained below pre-pandemic levels. Education, recreation and hotel sectors were in line with pre-pandemic levels. Light industrial sector growth offset the declines.

For heavy industry, pulp and paper electricity use was 15 percent ahead of forecast, but wood manufacturing was 16 percent below forecast. The briefing note said oil and gas grew nine percent relative to the previous year but, alongside ongoing LNG power demand, fell nine percent below the service plan.


Related News

View more

China to build 525-MW hydropower station on Yangtze tributary

Baima Hydropower Station advances China renewable energy on the Wujiang River, a Yangtze tributary in Chongqing; a 525 MW cascade project approved by NDRC, delivering 1.76 billion kWh and improving river shipping.


Key Points

An NDRC-approved 525 MW project on Chongqing's Wujiang River, producing 1.76 billion kWh and improving navigation.

✅ 10.2 billion yuan investment; final cascade plant on Wujiang in Chongqing

✅ Expected output: 1.76 billion kWh; capacity 525 MW; NDRC approval

✅ Improves river shipping; relocation of 5,000 residents in Wulong


China plans to build a 525-MW hydropower station on the Wujiang River, a tributary of the Yangtze River, in Southwest China's Chongqing municipality, aligning with projects like the Lawa hydropower station elsewhere in the Yangtze basin.

The Baima project, the last of a cascade of hydropower stations on the section of the Wujiang River in Chongqing, has gotten the green light from the National Development and Reform Commission, China's state planning agency, even as some independent power projects elsewhere face uncertainty, such as the Siwash Creek project in British Columbia, the Chongqing Municipal Commission of Development and Reform said Monday.

The project, in Baima township of Wulong district, is expected to involve an investment of 10.2 billion yuan ($1.6 billion), as China explores compressed air generation to bolster grid flexibility, it said.

#google#

With a power-generating capacity of 525 MW, it is expected to generate 1.76 billion kwh of electricity a year, supporting efforts to reduce coal power production nationwide, and help improve the shipping service along the Wujiang River.

More than 5,000 local residents will be relocated to make room for the project, which forms part of a broader energy mix alongside advances in nuclear energy in China.


Related News

View more

Hydro One deal to buy Avista receives U.S. antitrust clearance

Hydro One-Avista Acquisition secures U.S. antitrust clearance under Hart-Scott-Rodino, pending approvals from state utility commissions, the FCC, and CFIUS, with prior FERC approval and shareholder vote supporting the cross-border utility merger.


Key Points

A $6.7B cross-border utility merger cleared under HSR, still awaiting state, FCC, and CFIUS approvals; FERC approved earlier.

✅ HSR waiting period expired; U.S. antitrust clearance obtained

✅ Approvals pending: state commissions, FCC, and CFIUS

✅ FERC and Avista shareholders have approved the transaction


Hydro One Ltd. says it has received antitrust clearance in the United States for its deal to acquire U.S. energy company Avista Corp., even as it sought to redesign customer bills in Ontario.

The Ontario-based utility says the 30-day waiting period under the Hart-Scott-Rodino Antitrust Improvements Act expired Thursday night.

Hydro One announced the friendly deal to acquire Avista last summer, amid customer backlash in some service areas, in an agreement that valued the company at $6.7 billion.

The deal still requires several other approvals, including those from utility commissions in Washington, Idaho, Oregon, Montana and Alaska.

Analysts also warned of political risk for Hydro One during this period, reflecting concerns about provincial influence.

The U.S. Federal Communications Commission must also sign off on the transaction, and although U.S. regulators later rejected the $6.7B takeover following review, clearance is required by the Committee on Foreign Investment in the United States.

The agreement has received approval from the U.S. Federal Energy Regulatory Commission as well as Avista shareholders, and it mirrored other cross-border deals such as Algonquin Power's acquisition of Empire District that closed in the sector.


Related News

View more

Sign Up for Electricity Forum’s Newsletter

Stay informed with our FREE Newsletter — get the latest news, breakthrough technologies, and expert insights, delivered straight to your inbox.

Electricity Today T&D Magazine Subscribe for FREE

Stay informed with the latest T&D policies and technologies.
  • Timely insights from industry experts
  • Practical solutions T&D engineers
  • Free access to every issue

Live Online & In-person Group Training

Advantages To Instructor-Led Training – Instructor-Led Course, Customized Training, Multiple Locations, Economical, CEU Credits, Course Discounts.

Request For Quotation

Whether you would prefer Live Online or In-Person instruction, our electrical training courses can be tailored to meet your company's specific requirements and delivered to your employees in one location or at various locations.