NFPA 70E Training
Our customized live online or in‑person group training can be delivered to your staff at your location.

- Live Online
- 6 hours Instructor-led
- Group Training Available
Regular Price:
$199
Coupon Price:
$149
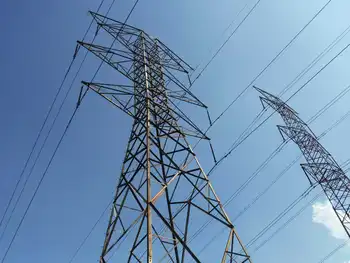
Honolulu's plan to reduce power consumption by 10 percent by 2017 is off to a rough start.
Since city officials announced the plan in 2007, Honolulu's electricity use has climbed nearly 15 percent. It used 194.4 million kilowatt hours of electricity during the fiscal year ending in June — up from 169.3 million kilowatt hours in the 2007 fiscal year.
The city blames the jump on recent upgrades to its Sand Island Waste Water Treatment Plant that were mandated by federal and state agencies. But officials insist that overall energy consumption patterns are going in the right direction.
Meanwhile, Hawaiian Electric Co. says overall electricity use in Oahu, Maui and Hawaii counties during the first half of this year is down 5 percent.
Related News

California Utility Cuts Power to Massive Areas in Northern, Central California
PG&E Public Safety Power Shutoff curbs wildfire risk amid high winds, triggering California outages across…
View more
Hydro-Quebec begins talks for $185-billion strategy to wean the province off fossil fuels
Hydro-Québec $185-Billion Clean Energy Plan accelerates hydroelectric upgrades, wind power expansion, solar and battery storage,…
View more

Siemens Energy to unlock a new era of offshore green hydrogen production
Offshore Wind-to-Hydrogen Integration enables green hydrogen by embedding an electrolyzer in offshore turbines. Siemens Gamesa…
View more
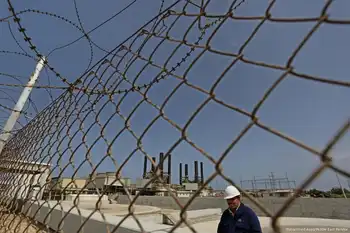
Gaza’s sole electricity plant shuts down after running out of fuel
Gaza Power Plant Shutdown underscores the Gaza Strip's fuel ban, Israeli blockade, and electricity crisis,…
View more

Seattle Apartment Fire Caused by Overheated Power Strip
Seattle Capitol Hill Apartment Fire highlights an electrical fire from an overheated power strip, a…
View more
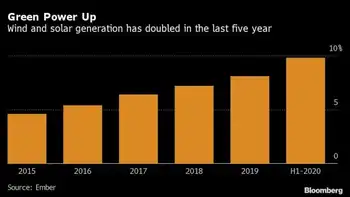
Wind and Solar Double Global Share of Electricity in Five Years
Wind And Solar Energy Growth is reshaping the global power mix, accelerating grid decarbonization as…
View more
Sign Up for Electricity Forum’s Newsletter
Stay informed with our FREE Newsletter — get the latest news, breakthrough technologies, and expert insights, delivered straight to your inbox.
Electricity Today T&D Magazine Subscribe for FREE

Stay informed with the latest T&D policies and technologies.
- Timely insights from industry experts
- Practical solutions T&D engineers
- Free access to every issue
