How to “oil-proof” Canada’s mass transit

By Richard Gilbert, Globe and Mail


NFPA 70b Training - Electrical Maintenance

Our customized live online or in‑person group training can be delivered to your staff at your location.

  • Live Online
  • 12 hours Instructor-led
  • Group Training Available
Regular Price:
$599
Coupon Price:
$499
Reserve Your Seat Today
Between my first Economy Lab post on September 30, 2010, and April 12, 2011, the closing spot price of a barrel of oil at the New York Mercantile Exchange NYMEX rose by 32 per cent, from $79.95 to $105.75. The European Brent price – which has become the international standard – rose even more, by 50 per cent from $80.77 to $121.33.

These price rises have been at a pace reminiscent of three years ago. Between Oct. 1, 2007, and April 15, 2008, both the NYMEX and Brent prices rose by 42 per cent, to just over $110. Whether the subsequent increases to above $140 in July, 2008, pushed the world economy into recession is still being debated. Whether the pattern of 2008 is being repeated in 2011 deserves more discussion.

If oil prices are on the same trajectory as that of 2008, we can expect a peaking in mid-2011 followed by an economic recession and a steep fall in oil prices. This is Jeff Rubin’s view, set out here in Economy Lab on March 13. He argued that a price rise can’t be prevented by a boost in supply by Saudi Arabia — or anyone else — because the Saudis can’t do it.

A contrary view is that of Donald Luskin writing in the Wall Street Journal on March 29. He claimed that Saudi Arabia will keep prices down by bridging any supply shortfalls. Even if it doesn’t, he continued, “the U.S. economy is today well-positioned to absorb an oil spike.” This, he suggested, is because:

1 U.S oil consumption is still 9 per cent below its 2005 peak

2 oil is now being used more efficiently than in 2008

3 economies in early stages of recovery are less vulnerable to oil shocks and

4 there is now a collective will to increase domestic oil production in the U.S.

I’m inclined to agree with Jeff Rubin. Oil prices will rise – perhaps higher and with a later peak than in 2008 for some of the reasons given by Donald Luskin – and then fall quite steeply as we again enter an oil-price-induced recession. The International Energy Agency shares the concern about effects on the economy. Its executive director said in Kuwait on April 17 that current high oil prices are a threat to growth and economic recovery. Two days earlier, Goldman Sachs had said the rising price of gasoline in the U.S. could undermine consumer spending and slow an already labouring economy.

If Mr. Rubin is right, weÂ’re effectively using the blunt tool of economic recession to reduce oil consumption in the face of supply constraints. Most oil is used for transportation, particularly in North America. In earlier posts I suggested that electricity is the best replacement for oil products as transportation fuels, especially when the electric motors are being powered from the grid while vehicles are in motion, as for trolley buses, streetcars and electric trains.

We should be moving as quickly as possible into electric traction. The way to get the most for each dollar invested in this transition would be to convert diesel bus routes to electric trolley bus routes. Conversion of a two-way route costs about $5-million per kilometre, including overhead wires, substations, and vehicles. Thus, for the $8-billion that the Ontario government through Metrolinx is to spend to add a 25-kilometre streetcar line in Toronto, 1,600 kilometres of roadway used by buses could be electrified, about 80 per cent of the total length of such roadway.

If the busiest routes were converted, this would mean that almost 100 per cent of transit trips in Toronto would be electrified, instead of the present 50 per cent the share carried by streetcars and subways. TorontoÂ’s transit system would be effectively proofed against oil crises. Some bus electrification of this kind would be worthwhile in all of CanadaÂ’s communities with a population of 100,000 or more, and in many smaller ones. European experience suggests that bus electrification can pay for itself over time.

Bus electrification would be particularly important in Eastern Canada, which is especially vulnerable to convulsions in oil markets because more than 90 per cent of the oil consumed there comes from or via another country. Moreover, unlike almost every other part of the developed world, there is no access to a strategic petroleum reserve.

Even with a massive program of bus electrification, most road transportation would not be electrified. How some road freight might benefit from powering while in motion was touched on in my last post. Doing this for car travel, which comprises about three quarters of the motorized movement of people in Canada, would be a larger challenge.

The kind of solution for personal transportation that I find increasingly appealing is often known as Personal Rapid Transit. PRT has been mooted for decades. Its time may be coming. You can get a sense of PRT in the short Swedish video Bubbles and Beams. In a later post, IÂ’ll set out PRTÂ’s prospects and challenges as we enter an era of oil scarcity and energy constraints.

Related News

Top Senate Democrat calls for permanent renewable energy, storage, EV tax credits

Clean Energy Tax Incentives could expand under Democratic proposals, including ITC, PTC, and EV tax credits, boosting renewable energy, energy storage, and grid modernization within a broader infrastructure package influenced by Green New Deal goals.


Key Points

Federal incentives like ITC, PTC, and EV credits that cut costs and speed renewables, storage, and grid upgrades.

✅ Proposes permanence for ITC, PTC, and EV tax credits

✅ Could accelerate solar, wind, storage, and grid upgrades

✅ Passage depends on bipartisan infrastructure compromise


The 115th U.S. Congress has not even adjourned for the winter, and already a newly resurgent Democratic Party is making demands that reflect its majority status in the U.S. House come January.

Climate appears to be near the top of the list. Last Thursday, Senator Chuck Schumer (D-NY), the Democratic Leader in the Senate, sent a letter to President Trump demanding that any infrastructure package taken up in 2019 include “policies and funding to transition to a clean energy economy and mitigate the risks that the United States is already facing due to climate change.”

And in a list of policies that Schumer says should be included, the top item is “permanent tax incentives for domestic production of clean electricity and storage, energy efficient homes and commercial buildings, electric vehicles, and modernizing the electric grid.”

In concrete terms, this could mean an extension of the Investment Tax Credit (ITC) for solar and energy storage, the Production Tax Credit (PTC) for wind and the federal electric vehicle (EV) tax credit program as well.


Pressure from the Left

This strong statement on climate change, clean energy and infrastructure investment comes as at least 30 incoming members of the U.S. House of Representatives have signed onto a call for the creation of a committee to explore a “Green New Deal” and to move the nation to 100% renewable energy by 2030.*

It also comes as Schumer has come under fire by activists for rumors that he plans to replace Senator Maria Cantwell (D-Washington) with coal state Democrat Joe Manchin (D-West Virginia) as the top Democrat on the Senate Energy and Natural Resources Committee.

As such, one possible way to read these moves is that centrist leaders like Schumer are responding to pressure from an energized and newly elected Left wing of the Democratic Party. It is notable that Schumer’s program includes many of the aims of the Green New Deal, while avoiding any explicit use of that phrase.


Implications of a potential ITC extension

The details of levels and timelines are important here, particularly for the ITC.

The ITC was set to expire at the end of 2016, but was extended in legislative horse-trading at the end of 2015 to a schedule where it remains at 30% through the end of 2019 and then steps down for the next three years, and disappears entirely for residential projects. Since that extension the IRS has issued guidance around the use of co-located energy storage, as well as setting a standard under which PV projects can claim the ITC for the year that they begin construction.

This language around construction means that projects can start work in 2019, complete in 2023 and still claim the 30% ITC, and this may be why we at pv magazine USA are seeing an unprecedented boom in project pipelines across the United States.

Of course, if the ITC were to become permanent some of those projects would be pushed out to later years. But as we saw in 2016, despite an extension of the ITC many projects were still completed before the deadline, leading to the largest volume of PV installed in the United States in any one year to date.

This means that if the ITC were extended by the end of 2020, we could see the same thing all over again – a boom in projects created by the expected sunset, and then after a slight lull a continuation of growth.

Or it is possible that a combination of raw economics, increased investor and utility interest, and accelerating renewable energy mandates will cause solar growth rates to continue every year, and that any changes in the ITC will only be a bump against a larger trend.

While the basis for expiration of the EV tax credit is the number of vehicles sold, not any year, both the battery storage and EV industries, which many see at an inflection point, could see similar effects if the ITC and EV tax credits are made permanent.


Will consensus be reached?

It is also unclear that any such infrastructure package will be taken up by Republicans, or that both parties will be able to come to a compromise on this issue. While the U.S. Congress passed an infrastructure bill in 2017, given the sharp and growing differences between the two parties, and divergent trade approaches such as the 100% tariff on Chinese-made EVs, it is not clear that they will be able to come to a meaningful compromise during the next two years.


Related News

View more

Pandemic causes drop in electricity demand across the province: Manitoba Hydro

Manitoba Electricity Demand Drop reflects COVID-19 effects, lowering peak demand about 6% as businesses and offices close, impacting the regional grid; recession-like patterns emerge while Winnipeg water consumption stays steady and peak usage shifts later.


Key Points

An observed 6% decline in Manitoba peak electricity during COVID-19 due to closures; Winnipeg water use remains steady.

✅ Daily peak load down roughly 6% provincewide

✅ Business and office shutdowns drive lower consumption

✅ Winnipeg peak water time shifts to 9 a.m., volume steady


The COVID-19 pandemic has caused a drop in the electricity demand across the province, according to Manitoba Hydro, mirroring the Ontario electricity usage decline reported elsewhere in Canada.

On Tuesday, Manitoba Hydro said it has tracked overall electrical use, which includes houses, farms and businesses both large and small, while also cautioning customers about pandemic-related scam calls in recent weeks.

Hydro said it has seen about a six per cent reduction in the daily peak electricity demand, adding this is due to the many businesses and downtown offices which are temporarily closed, even as residential electricity use has increased in many regions.


"Currently, the impact on Manitoba electricity demand appears to be consistent with what we saw during the 2008 recession," Bruce Owen, the media relations officer for Manitoba Hydro, noting a similar Ottawa demand decline during the pandemic, said in an email to CTV News.

Owen added this trend of reduced electricity demand is being seen across North America, with BC Hydro pandemic load patterns reported and the regional grid in the American Midwest – an area where Manitoba Hydro is a member.

While electricity demand is down, BC Hydro expects holiday usage to rise and water usage in Winnipeg has remained the same.

The City of Winnipeg said it has not seen any change in overall water consumption, but as Hydro One kept peak rates in Ontario, peak demand times have moved from 7 – 8 a.m. to 9 a.m.


Related News

View more

UK low-carbon electricity generation stalls in 2019

UK low-carbon electricity 2019 saw stalled growth as renewables rose slightly, wind expanded, nuclear output fell, coal hit record lows, and net-zero targets demand faster deployment to cut CO2 intensity below 100gCO2/kWh.


Key Points

Low-carbon sources supplied 54% of UK power in 2019, up just 1TWh; wind grew, nuclear fell, and coal dropped to 2%.

✅ Wind up 8TWh; nuclear down 9TWh amid outages

✅ Fossil fuels 43% of generation; coal at 2%

✅ Net-zero needs 15TWh per year added to 2030


The amount of electricity generated by low-carbon sources in the UK stalled in 2019, Carbon Brief analysis shows.

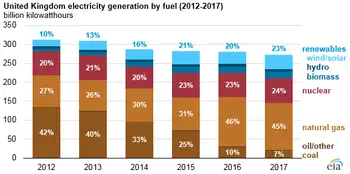
Low-carbon electricity output from wind, solar, nuclear, hydro and biomass rose by just 1 terawatt hour (TWh, less than 1%) in 2019. It represents the smallest annual increase in a decade, where annual growth averaged 9TWh. This growth will need to double in the 2020s to meet UK climate targets while replacing old nuclear plants as they retire.

Some 54% of UK electricity generation in 2019 came from low-carbon sources, including 37% from renewables and 20% from wind alone, underscoring wind's leading role in the power mix during key periods. A record-low 43% was from fossil fuels, with 41% from gas and just 2% from coal, also a record low. In 2010, fossil fuels generated 75% of the total.

Carbon Brief’s analysis of UK electricity generation in 2019 is based on figures from BM Reports and the Department for Business, Energy and Industrial Strategy (BEIS). See the methodology at the end for more on how the analysis was conducted.

The numbers differ from those published earlier in January by National Grid, which were for electricity supplied in Great Britain only (England, Wales and Scotland, but excluding Northern Ireland), including via imports from other countries.

Low-carbon low
In 2019, the UK became the first major economy to target net-zero greenhouse gas emissions by 2050, increasing the ambition of its legally binding Climate Change Act.

To date, the country has cut its emissions by around two-fifths since 1990, with almost all of its recent progress coming from the electricity sector.

Emissions from electricity generation have fallen rapidly in the decade since 2010 as coal power has been almost phased out and even gas output has declined. Fossil fuels have been displaced by falling demand and by renewables, such as wind, solar and biomass.

But Carbon Brief’s annual analysis of UK electricity generation shows progress stalled in 2019, with the output from low-carbon sources barely increasing compared to a year earlier.

The chart below shows low-carbon generation in each year since 2010 (grey bars) and the estimated level in 2019 (red). The pale grey bars show the estimated future output of existing low-carbon sources after old nuclear plants retire and the pale red bars show the amount of new generation needed to keep electricity sector emissions to less than 100 grammes of CO2 per kilowatt hour (gCO2/kWh), the UK’s nominal target for the sector.

 Annual electricity generation in the UK by fuel, terawatt hours, 2010-2019. Top panel: fuel by fuel. Bottom panel: cumulative total generation from all sources. Source: BEIS energy trends, BM Reports and Carbon Brief analysis. Chart by Carbon Brief using Highcharts.
As the chart shows, the UK will require significantly more low-carbon electricity over the next decade as part of meeting its legally binding climate goals.

The nominal 100gCO2/kWh target for 2030 was set in the context of the UK’s less ambitious goal of cutting emissions to 80% below 1990 levels by 2050. Now that the country is aiming to cut emissions to net-zero by 2050, that 100gCO2/kWh indicator is likely to be the bare minimum.

Even so, it would require a rapid step up in the pace of low-carbon expansion, compared to the increases seen over the past decade. On average, low-carbon generation has risen by 9TWh each year in the decade since 2010 – including a rise of just 1TWh in 2019.

Given scheduled nuclear retirements and rising demand expected by the Committee on Climate Change (CCC) – with some electrification of transport and heating – low-carbon generation would need to increase by 15TWh each year until 2030, just to meet the benchmark of 100gCO2/kWh.

For context, the 3.2 gigawatt (GW) Hinkley C new nuclear plant being built in Somerset will generate around 25TWh once completed around 2026. The world’s largest offshore windfarm, the 1.2GW Hornsea One scheme off the Yorkshire coast, will generate around 5TWh each year.

The new Conservative government is targeting 40GW of offshore wind by 2030, up from today’s figure of around 8GW. If policies are put in place to meet this goal, then it could keep power sector emissions below 100gCO2/kWh, depending on the actual performance of the windfarms built.

However, new onshore wind and solar, further new nuclear or other low-carbon generation, such as gas with carbon capture and storage (CCS), is likely to be needed if demand is higher than expected, or if the 100gCO2/kWh benchmark is too weak in the context of net-zero by 2050.

The CCC says it is “likely” to “reflect the need for more rapid deployment” of low-carbon towards net-zero emissions in its advice on the sixth UK carbon budget for 2033-2037, due in September.

Trading places
Looking more closely at UK electricity generation in 2019, Carbon Brief’s analysis shows why there was so little growth for low-carbon sources compared to the previous year.

There was another increase for wind power in 2019 (up 8TWh, 14%), with record wind generation as several large new windfarms were completed including the 1.2GW Hornsea One project in October and the 0.6GW Beatrice offshore windfarm in Q2 of 2019. But this was offset by a decline for nuclear (down 9TWh, 14%), due to ongoing outages for reactors at Hunterston in Scotland and Dungeness in Kent.

(Analysis of data held by trade organisation RenewableUK suggests some 0.6GW of onshore wind capacity also started operating in 2019, including the 0.2GW Dorenell scheme in Moray, Scotland.)

As a result of these movements, the UK’s windfarms overtook nuclear for the first time ever in 2019, becoming the country’s second-largest source of electricity generation, and earlier, wind and solar together surpassed nuclear in the UK as momentum built. This is shown in the figure below, with wind (green line, top panel) trading places with nuclear (purple) and gas (dark blue) down around 25% since 2010 but remaining the single-largest source.

 Annual electricity generation in the UK by fuel, terawatt hours, 2010-2019. Top panel: fuel by fuel. Bottom panel: cumulative total generation from all sources. Source: BEIS energy trends, BM Reports and Carbon Brief analysis. Chart by Carbon Brief using Highcharts.
The UK’s currently suspended nuclear plants are due to return to service in January and March, according to operator EDF, the French state-backed utility firm. However, as noted above, most of the UK’s nuclear fleet is set to retire during the 2020s, with only Sizewell B in Suffolk due to still be operating by 2030. Hunterston is scheduled to retire by 2023 and Dungeness by 2028.

Set against these losses, the UK has a pipeline of offshore windfarms, secured via “contracts for difference” with the government, at a series of auctions. The most recent auction, in September 2019, saw prices below £40 per megawatt hour – similar to current wholesale electricity prices.

However, the capacity contracted so far is not sufficient to meet the government’s target of 40GW by 2030, meaning further auctions – or some other policy mechanism – will be required.

Coal zero
As well as the switch between wind and nuclear, 2019 also saw coal fall below solar for the first time across a full year, echoing the 2016 moment when wind outgenerated coal across the UK, after it suffered another 60% reduction in electricity output. Just six coal plants remain in the UK, with Aberthaw B in Wales and Fiddlers Ferry in Cheshire closing in March.

Coal accounted for just 2% of UK generation in 2019, a record-low coal share since centralised electricity supplies started to operate in 1882. The fuel met 40% of UK needs as recently as 2012, but has plummeted thanks to falling demand, rising renewables, cheaper gas and higher CO2 prices.

The reduction in average coal generation hides the fact that the fuel is now often not required at all to meet the UK’s electricity needs. The chart below shows the number of days each year when coal output was zero in 2019 (red line) and the two previous years (blue).

 Cumulative number of days when UK electricity generation from renewable sources has been higher than that from fossil fuels. Source: BEIS energy trends, BM Reports and Carbon Brief analysis. Chart by Carbon Brief using Highcharts.
The 83 days in 2019 with zero coal generation amount to nearly a quarter of the year and include the record-breaking 18-day stretch without the fuel.

Great Britain has been running for a record TWO WEEKS without using coal to generate electricity – the first time this has happened since 1882.

The country’s grid has been coal-free for 45% of hours in 2019 so far.https://www.carbonbrief.org/countdown-to-2025-tracking-the-uk-coal-phase-out …

Coal generation was set for significant reductions around the world in 2019 – including a 20% reduction for the EU as a whole – according to analysis published by Carbon Brief in November.

Notably, overall UK electricity generation fell by another 9TWh in 2019 (3%), bringing the total decline to 58TWh since 2010. This is equivalent to more than twice the output from the Hinkley C scheme being built in Somerset. As Carbon Brief explained last year, falling demand has had a similar impact on electricity-sector CO2 emissions as the increase in output from renewables.

This is illustrated by the fact that the 9TWh reduction in overall generation translated into a 9TWh (6%) cut in fossil-fuel generation during 2019, with coal falling by 10TWh and gas rising marginally.

Increasingly renewable
As fossil-fuel output and overall generation have declined, the UK’s renewable sources of electricity have continued to increase. Their output has risen nearly five-fold in the past decade and their share of the UK total has increased from 7% in 2010 to 37% in 2019.

As a result, the UK’s increasingly renewable grid is seeing more minutes, hours and days during which the likes of wind, solar and biomass collectively outpace all fossil fuels put together, and on some days wind is the main source as well.

The chart below shows the number of days during each year when renewables generated more electricity than fossil fuels in 2019 (red line) and each of the previous four years (blue lines). In total, nearly two-fifths of days in 2019 crossed this threshold.

 Cumulative number of days when the UK has not generated any electricity from coal. Source: BEIS energy trends, BM Reports and Carbon Brief analysis. Chart by Carbon Brief using Highcharts.
There were also four months in 2019 when renewables generated more of the UK’s electricity than fossil fuels: March, August, September and December. The first ever such month came in September 2018 and more are certain to follow.

National Grid, which manages Great Britain’s high-voltage electricity transmission network, is aiming to be able to run the system without fossil fuels by 2025, at least for short periods. At present, it sometimes has to ask windfarm operators to switch off and gas plants to start running in order to keep the electricity grid stable.

Note that biomass accounted for 11% of UK electricity generation in 2019, nearly a third of the total from all renewables. Some two-thirds of the biomass output is from “plant biomass”, primarily wood pellets burnt at Lynemouth in Northumberland and the Drax plant in Yorkshire. The remainder was from an array of smaller sites based on landfill gas, sewage gas or anaerobic digestion.

The CCC says the UK should “move away” from large-scale biomass power plants, once existing subsidy contracts for Drax and Lynemouth expire in 2027.

Using biomass to generate electricity is not zero-carbon and in some circumstances could lead to higher emissions than from fossil fuels. Moreover, there are more valuable uses for the world’s limited supply of biomass feedstock, the CCC says, including carbon sequestration and hard-to-abate sectors with few alternatives.

Methodology
The figures in the article are from Carbon Brief analysis of data from BEIS Energy Trends chapter 5 and chapter 6, as well as from BM Reports. The figures from BM Reports are for electricity supplied to the grid in Great Britain only and are adjusted to include Northern Ireland.

In Carbon Brief’s analysis, the BM Reports numbers are also adjusted to account for electricity used by power plants on site and for generation by plants not connected to the high-voltage national grid. This includes many onshore windfarms, as well as industrial gas combined heat and power plants and those burning landfill gas, waste or sewage gas.

By design, the Carbon Brief analysis is intended to align as closely as possible to the official government figures on electricity generated in the UK, reported in BEIS Energy Trends table 5.1.

Briefly, the raw data for each fuel is in most cases adjusted with a multiplier, derived from the ratio between the reported BEIS numbers and unadjusted figures for previous quarters.

Carbon Brief’s method of analysis has been verified against published BEIS figures using “hindcasting”. This shows the estimates for total electricity generation from fossil fuels or renewables to have been within ±3% of the BEIS number in each quarter since Q4 2017. (Data before then is not sufficient to carry out the Carbon Brief analysis.)

For example, in the second quarter of 2019, a Carbon Brief hindcast estimates gas generation at 33.1TWh, whereas the published BEIS figure was 34.0TWh. Similarly, it produces an estimate of 27.4TWh for renewables, against a BEIS figure of 27.1TWh.

National Grid recently shared its own analysis for electricity in Great Britain during 2019 via its energy dashboard, which differs from Carbon Brief’s figures.


Related News

View more

Ontario tables legislation to lower electricity rates

Ontario Clean Energy Adjustment lowers hydro bills by shifting global adjustment costs, cutting time-of-use rates, and using OPG debt financing; ratepayers get inflation-capped increases for four years, then repay costs over 20 years.


Key Points

A 20-year line item repaying debt used to lower rates for 10 years by shifting global adjustment costs off hydro bills.

✅ 17% average bill cut takes effect after royal assent

✅ OPG-managed entity assumes debt for 10 years

✅ 20-year surcharge repays up to $28B plus interest


Ontarians will see lowered hydro bills for the next 10 years, but will then pay higher costs for the following 20 years, under new legislation tabled Thursday.

Ten weeks after announcing its plan to lower hydro bills, the Liberal government introduced legislation to lower time-of-use rates, take the cost of low-income and rural support programs off bills, and introduce new social programs.

It will lower time-of-use rates by removing from bills a portion of the global adjustment, a charge consumers pay for above-market rates to power producers. For the next 10 years, a new entity overseen by Ontario Power Generation will take on debt to pay that difference.

Then, the cost of paying back that debt with interest -- which the government says will be up to $28 billion -- will go back onto ratepayers' bills for the next 20 years as a "Clean Energy Adjustment."

An average 17-per-cent cut to bills will take effect 15 days after the hydro legislation receives royal assent, even as a Nov. 1 rate increase was set by the Ontario Energy Board, but there are just eight sitting days left before the Ontario legislature breaks for the summer. Energy Minister Glenn Thibeault insisted that leaves the opposition "plenty" of time for review and debate.

Premier Kathleen Wynne promised to cut hydro bills and later defended a 25% rate cut after widespread anger over rising costs helped send her approval ratings to record lows.

Electricity bills in the province have roughly doubled in the last decade, due in part to green energy initiatives, and Thibeault said the goal of this plan is to better spread out those costs.

"Like the mortgage on your house, this regime will cost more as we refinance over a longer period of time, but this is a more equitable and fair approach when we consider the lifespan of the clean energy investments, and generating stations across our province," he said.

NDP critic Peter Tabuns called it a "get-through-the-election" next June plan.

"We're going to take on a huge debt so Kathleen Wynne can look good on the hustings in the next few months and for decades we're going to pay for it," he said.

The legislation also holds rate increases to inflation for the next four years. After that, they'll rise more quickly, as illustrated by a leaked cabinet document the Progressive Conservatives unveiled Thursday.

The Liberals dismissed the document as containing outdated projections, but confirmed that it went before cabinet at some point before the government decided to go ahead with the hydro plan.

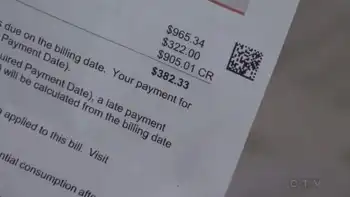
From about 2027 onward -- when consumers would start paying off the debt associated with the hydro plan -- Ontario electricity consumers will be paying about 12 per cent more than they would without the Liberal government's plan to cut costs in the short term, even though a deal with Quebec was not expected to reduce hydro bills, the government document projected.

But that was just one of many projections, said Energy Minister Glenn Thibeault.

"We have been working on this plan for months, and as we worked on it the documents and calculations evolved," he said.

The government's long-term energy plan is set to be updated this spring, and Thibeault said it will provide a more accurate look at how the hydro plan will reduce rates, even as a recovery rate could lead to higher hydro bills in certain circumstances.

Progressive Conservative critic Todd Smith said the "Clean Energy Adjustment" is nothing more than a revamped debt retirement charge, which was on bills from 2002 to 2016 to pay down debt left over from the old Ontario Hydro, the province's giant electrical utility that was split into multiple agencies in 1999 under the previous Conservative government.

"The minister can call it whatever he wants but it's right there in the graph, that there is going to be a new charge on the line," Smith said. "It's the debt retirement charge on steroids."


Related News

View more

Canadian Solar and Tesla contribute to resilient electricity system for Puerto Rico school

SunCrate Solar Microgrid delivers resilient, plug-and-play renewable power to Puerto Rico schools, combining Canadian Solar PV, Tesla Powerwall battery storage, and Black & Veatch engineering to ensure off-grid continuity during outages and disasters.


Key Points

A compact PV-and-battery system for resilient, diesel-free power and microgrid backup at schools and clinics.

✅ Plug-and-play, modular PV, inverter, and battery architecture

✅ Tesla Powerwall storage; Canadian Solar 325 W panels

✅ Scales via daisy-chain for higher loads and microgrids


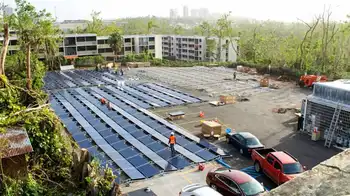
Eleven months since their three-building school was first plunged into darkness by Hurricane Maria, 140 students in Puerto Rico’s picturesque Yabucoa district have reliable power. Resilient electricity service was provided Saturday to the SU Manuel Ortiz school through an innovative scalable, plug-and-play solar system pioneered by SunCrate Energy with Black & Veatch support. Known as a “SunCrate,” the unit is an effective mitigation measure to back up the traditional power supply from the grid. The SunCrate can also provide sustainable power in the face of ongoing system outages and future natural disasters without requiring diesel fuel.

The humanitarian effort to return sustainable electricity to the K-8 school, found along the island’s hard-hit southeastern coast, drew donated equipment and expertise from a collection of North American companies. Additional support for the Yabucoa project came from Tesla, Canadian Solar and Lloyd Electric, reflecting broader efforts to build a solar-powered grid in Puerto Rico after Hurricane Maria.

“We are grateful for this initiative, which will equip this school with the technology needed to become a resilient campus and not dependent on the status of the power grid. This means that if we are hit with future harmful weather events, the school will be able to open more quickly and continue providing services to students,” Puerto Rico Secretary of Education Julia Keleher said.

The SunCrate harnesses a scalable rapid-response design developed by Black & Veatch and manufactured by SunCrate Energy. Electricity will be generated by an array of 325-W CS6U-Poly modules from Canadian Solar. California-based Tesla contributed advanced battery energy storage through various Powerwall units capable of storing excess solar power and delivering it outside peak generation periods, with related experience from a virtual power plant in Texas informing deployment.  Lloyd Electric Co. of Wichita Falls, Texas, partnered to support delivery and installation of the SunCrate.

“As families in the region begin to prepare for the school year, this community is still impacted by the longest U.S. power outage in history,” said Dolf Ivener, a Midwestern entrepreneur who owns King of Trails Construction and SunCrate Energy, which is donating the SunCrate. “SunCrate, with its rapid deployment and use of renewable energy, should give this school peace of mind and hopefully returns a touch of long-overdue normalcy to students and their parents. When it comes to consistent power, SunCrate is on duty.”

The SunCrate is a portable renewable energy system conceived by Ivener and designed and tested by Black & Veatch. Its modular design uses solar PV panels, inverters and batteries to store and provide electric power in support of critical services such as police, fire, schools, clinics and other community level facilities.

A SunCrate can generate 23 to 156 kWh per day, and store 10 kWh to 135 kWh depending on configuration. A SunCrate’s power generation and storage capacity can be easily scaled through daisy-chained configurations to accommodate larger buildings and loads. Leveraging resources from Tesla, Canadian Solar, Lloyd Electric and Lord Electric, the unit in Yabucoa will provide an estimated 52 kWh of storable power without requiring use of costlier diesel-powered generators and cutting greenhouse gas emissions. Its capabilities allow the school to strengthen its function as a designated Community Emergency Response Center in the event of future natural disasters.

“Canadian Solar has a long history of using solar power to support humanitarian efforts aiding victims of social injustice and natural disasters, including previous donations to Puerto Rico after Hurricane Maria,” said Dr. Shawn Qu, Chairman and Chief Executive Officer of Canadian Solar. “We are pleased to make the difference for these schoolchildren in Yabucoa who have been without reliable power for too long.”

The SunCrate will also substantially lower the school’s ongoing electricity costs by providing a reliable source of renewable energy on site, as falling costs of solar batteries improve project economics overall.

“Through our experience providing engineering services in Puerto Rico for nearly 50 years, including dozens of specialized projects for local government and industrial clients, we see great potential for SunCrate as a source of resilient power for the Commonwealth’s remote schools and communities at large, underscoring the importance of electricity resilience across critical infrastructure,” said Charles Moseley, a Program Director in Black & Veatch’s water business. “We hope that the deployment of the SunCrate in Yabucoa sets a precedent for facility and municipal level migro-grid efforts on the island and beyond.”

SunCrate also has broad potential applications in conflict/post-conflict environments and in rural electrification efforts in the developing world, serving as a resilient source of electricity within hours of its arrival on site and could enable peer-to-peer energy within communities. Of particular benefit, the system’s flexibility cuts fuel costs to a fraction of a generator’s typical consumption when they are used around the clock with maintenance requirements.


Related News

View more

British Columbians can access more in EV charger rebates

B.C. EV Charging Rebates boost CleanBC incentives as NRCan and ZEVIP funding covers up to 75% of Level 2 and DC fast-charger purchase and installation costs for homes, workplaces, condos, apartments, and fleet operators.


Key Points

Incentives in B.C. cover up to 75% of Level 2 and DC fast charger costs for homes, workplaces, and fleets.

✅ Up to 75% back; Level 2 max $5,000; DC fast max $75,000 for fleets.

✅ Eligible sites: homes, workplaces, condos, apartments, fleet depots.

✅ Funded by CleanBC with NRCan ZEVIP; time-limited top-up.


The Province and Natural Resources Canada (NRCan) are making it more affordable for people to install electric vehicle (EV) charging stations in their homes, businesses and communities, as EV demand ramps up across the province.

B.C. residents, businesses and municipalities can receive higher rebates for EV charging stations through the CleanBC Go Electric EV Charger Rebate and Fleets programs. For a limited time, funding will cover as much as 75% of eligible purchase and installation costs for EV charging stations, which is an increase from the previous 50% coverage.

“With electric vehicles representing 13% of all new light-duty vehicles sold in B.C. last year, our province has the strongest adoption rate of electric vehicles in Canada. We’re positioning ourselves to become leaders in the EV industry,” said Bruce Ralston, B.C.’s Minister of Energy, Mines and Low Carbon Innovation. “We’re working with our federal partners to increase rebates for home, workplace and fleet charging, and making it easier and more affordable for people to make the switch to electric vehicles.”

With a $2-million investment through NRCan’s Zero-Emission Vehicle Infrastructure Program (ZEVIP) to top up the Province’s EV Charger Rebate program, workplaces, condominiums and apartments can get a rebate for a Level 2 charging station for as much as 75% of purchase and installation costs to a maximum of $5,000. As many as 360 EV chargers will be installed through the program.

“We’re making electric vehicles more affordable and charging more accessible where Canadians live, work and play,” said Jonathan Wilkinson, federal Minister of Natural Resources. “Investing in more EV chargers, like the ones announced today in British Columbia, will put more Canadians in the driver’s seat on the road to a net-zero future and help achieve our climate goals.”

Through the CleanBC Go Electric Fleets program and in support of B.C. businesses that own and operate fleet vehicles, NRCan has invested $1.54 million through ZEVIP to top up rebates. Fleet operators can get combined rebates from NRCan and the Province for a Level 2 charging station as much as 75% to a maximum of $5,000 of purchase and installation costs, and 75% to a maximum of $75,000 for a direct-current, fast-charging station. As many as 450 EV chargers will be installed through the program.

CleanBC is a pathway to a more prosperous, balanced and sustainable future. It supports government’s commitment to climate action to meet B.C.’s emission targets and build a cleaner, stronger economy.

Quick Facts:

  • A direct-current fast charger on the BC Electric Highway allows an EV to get 100-300 kilometres of range from 30 minutes of charging.
  • Faster chargers, which give more range in less time, are coming out every year.
  • A Level 2 charger allows an EV to get approximately 30 kilometres of range per hour of charging.
  • It uses approximately the same voltage as a clothes dryer and is usually installed in homes, workplaces or for fleets to get a faster charge than a regular outlet, or in public places where people might park for a longer time.
  • A key CleanBC action is to strengthen the Zero-Emission Vehicles Act to require light-duty vehicle sales to be 26% zero-emission vehicles (ZEVs) by 2026, 90% by 2030 and 100% by 2035, five years ahead of the original target.
  • At the end of 2021, B.C. had more than 3,000 public EV charging stations and almost 80,000 registered ZEVs.

Learn More:

To learn more about home and workplace EV charging-station rebates, eligibility and application processes, visit: https://goelectricbc.gov.bc.ca/   

To learn more about the Fleets program, visit: https://pluginbc.ca/go-electric-fleets/    

To learn more about Natural Resources Canada’s Zero-Emission Vehicle Infrastructure Program, visit:
https://www.nrcan.gc.ca/energy-efficiency/transportation-alternative-fuels/zero-emission-vehicle-infrastructure-program/21876


Related News

View more

Sign Up for Electricity Forum’s Newsletter

Stay informed with our FREE Newsletter — get the latest news, breakthrough technologies, and expert insights, delivered straight to your inbox.

Electricity Today T&D Magazine Subscribe for FREE

Stay informed with the latest T&D policies and technologies.
  • Timely insights from industry experts
  • Practical solutions T&D engineers
  • Free access to every issue

Live Online & In-person Group Training

Advantages To Instructor-Led Training – Instructor-Led Course, Customized Training, Multiple Locations, Economical, CEU Credits, Course Discounts.

Request For Quotation

Whether you would prefer Live Online or In-Person instruction, our electrical training courses can be tailored to meet your company's specific requirements and delivered to your employees in one location or at various locations.