NFPA 70E Training
Our customized live online or in‑person group training can be delivered to your staff at your location.

- Live Online
- 6 hours Instructor-led
- Group Training Available
Regular Price:
$199
Coupon Price:
$149
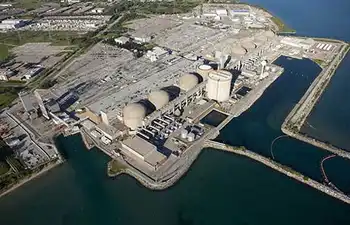
Russia's nuclear energy monopoly Rosatom has agreed on the construction of a new power plant in Russia's European enclave of Kaliningrad, the company said.
Rosatom chief Sergei Kiriyenko inked the deal on August 27 for the construction of the plant about 120 km from the capital of the Baltic Sea exclave between Poland and Lithuania.
The plant will have two reactors with a total capacity of 2300 MW by the first stage of construction in 2015. When plans for the plant were announced in April, Kiriyenko highlighted the export potential of the project.
The Rosatom head also said the company was prepared to allow up to 49 per cent of the plant to be held by foreign investors. But the plan for a nuclear plant in the European enclave has provoked protests among neighbouring countries over environmental and safety concerns.
Related News
Ontario Supports Plan to Safely Continue Operating the Pickering Nuclear Generating Station
Pickering Nuclear Generating Station Refurbishment will enable OPG to deliver reliable, clean electricity in Ontario,…
View more
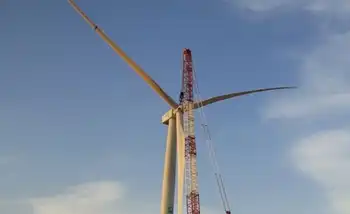
Saudis set to 'boost wind by over 6GW'
Saudi Arabia Wind Power Market set to lead the Middle East, driven by Vision 2030…
View more
ERCOT Issues RFP to Procure Capacity to Alleviate Winter Concerns
ERCOT Winter Capacity RFP seeks up to 3,000 MW through generation and demand response to…
View more
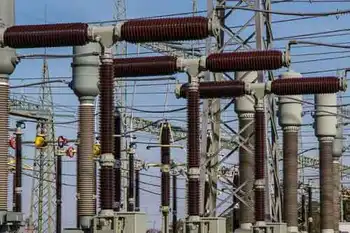
Smart grid and system improvements help avoid more than 500,000 outages over the summer
ComEd Smart Grid Reliability drives outage reduction across Illinois, leveraging smart switches, grid modernization, and…
View more
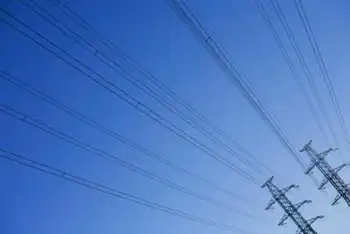
California Skirts Blackouts With Heat Wave to Test Grid Again
California Heatwave Power Crisis strains CAISO as record demand triggers emergency alerts, demand response, and…
View more
U.S. Electric Vehicle Market Share Dips in Q1 2024
U.S. EV Market Share Dip Q1 2024 reflects slower BEV adoption, rising PHEV demand, affordability…
View more
Sign Up for Electricity Forum’s Newsletter
Stay informed with our FREE Newsletter — get the latest news, breakthrough technologies, and expert insights, delivered straight to your inbox.
Electricity Today T&D Magazine Subscribe for FREE

Stay informed with the latest T&D policies and technologies.
- Timely insights from industry experts
- Practical solutions T&D engineers
- Free access to every issue
