Substation Relay Protection Training
Our customized live online or in‑person group training can be delivered to your staff at your location.

- Live Online
- 12 hours Instructor-led
- Group Training Available
Regular Price:
$699
Coupon Price:
$599
LONDON
—
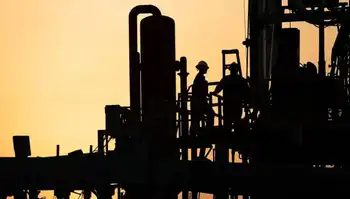
Oil and Gas Profitability Decline reflects shale-driven oversupply, OPEC-Russia dynamics, LNG exports, renewables growth, and weak demand, signaling compressed margins for producers, stressed petrodollar budgets, and shifting energy markets post-Covid.
What This Means
A sustained squeeze on hydrocarbon margins from agile shale supply, weaker OPEC leverage, and expanding renewables.
Shale supply agility caps prices, eroding OPEC+ leverage and margins.
Cheap wind, solar, and storage curb demand growth in power and transport.
Fewer petrodollars strain producer budgets and pension-heavy equities.
Any rebound is cyclical; structural profitability decline persists.
The oil-price crash of March 2020 will probably not last long. As in 2014, when the oil price dropped below $50 from $110 in a few weeks, this one will trigger a temporary collapse of the US shale industry. Unless the coronavirus outbreak causes Armageddon, cheap oil will also support policymakers’ efforts to help the global economy.
But there will be at least one important and lasting difference this time round — and it has major market and geopolitical implications.
The oil price crash is a foretaste of where the whole energy sector was going anyway — and that is down.
It may not look that way at first. Saudi Arabia will soon realise, as it did in 2015, that its lethal decision to pump more oil is not only killing US shale but its public finances as well. Riyadh will soon knock on Moscow’s door again. Once American shale supplies collapse, Russia will resume co-operation with Saudi Arabia.
With the world economy recovering from the Covid-19 crisis by then, and with electricity demand during COVID-19 shifting, moderate supply cuts by both countries will accelerate oil market recovery. In time, US shale producers will return too.
Yet this inevitable bounceback should not distract from two fundamental factors that were already remaking oil and gas markets. First, the shale revolution has fundamentally eroded industry profitability. Second, the renewables’ revolution will continue to depress growth in demand.
The combined result has put the profitability of the entire global hydrocarbon industry under pressure. That means fewer petrodollars to support oil-producing countries’ national budgets, including Canada's oil sector exposures. It also means less profitable oil companies, which traditionally make up a large segment of stock markets, an important component of so many western pension funds.
Start with the first factor to see why this is so. Historically, the geological advantages that made oil from countries such as Saudi Arabia so cheap to produce were unique. Because oil and gas were produced at costs far below the market price, the excess profits, or “rent”, enjoyed by the industry were very large.
Furthermore, collusion among low-cost producers has been a winning strategy. The loss of market share through output cuts was more than compensated by immediately higher prices. It was the raison d’être of Opec.
The US shale revolution changed all this, exposing the limits of U.S. energy dominance narratives. A large oil-producing region emerged with a remarkable ability to respond quickly to price changes and shrink its costs over time. Cutting back cheap Opec oil now only increases US supplies, with little effect on world prices.
That is why Russia refused to cut production this month. Even if its cuts did boost world prices — doubtful given the coronavirus outbreak’s huge shock to demand — that would slow the shrinkage of US shale that Moscow wants.
Shale has affected the natural gas industry even more. Exports of US liquefied natural gas now put an effective ceiling on global prices, and debates over a clean electricity push have intensified when gas prices spike.
On top of all this, there is also the renewables’ revolution, though a green revolution has not been guaranteed in the near term. Around the world, wind and solar have become ever-cheaper options to generate electricity. Storage costs have also dropped and network management improved. Even in the US, renewables are displacing coal and gas. Electrification of vehicle fleets will damp demand further, as U.S. electricity, gas, and EVs face evolving pressures.
Eliminating fossil fuel consumption completely would require sustained and costly government intervention, and reliability challenges such as coal and nuclear disruptions add to the complexity. That is far from certain. Meanwhile, though, market forces are depressing the sector’s usual profitability.
The end of oil and gas is not immediately around the corner. Still, the end of hydrocarbons as a lucrative industry is a distinct possibility. We are seeing that in dramatic form in the current oil price crash. But this collapse is merely a message from the future.
Related News
Related News

On the road to 100 per cent renewables
US Climate Alliance 100% Renewables 2035 accelerates clean energy, electrification, and decarbonization, replacing coal and…
View more

Alberta Carbon tax is gone, but consumer price cap on electricity will remain
Alberta Electricity Rate Cap stays despite carbon tax repeal, keeping the Regulated Rate Option at…
View more
Ukraine Prepares for Winter Amid Energy Challenges
Ukraine Winter Energy Resilience focuses on energy security, grid repairs, renewable power, EU support, heating…
View more

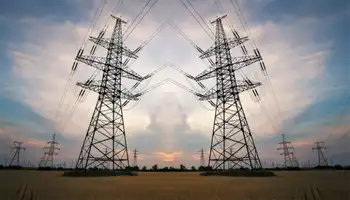
London's Newest Electricity Tunnel Goes Live
London Electricity Tunnel strengthens grid modernization with high-voltage cabling from major substations, increasing redundancy, efficiency,…
View more
Pickering nuclear station is closing as planned, despite calls for refurbishment
Ontario Pickering Nuclear Closure will shift supply to natural gas, raising emissions as the electricity…
View more
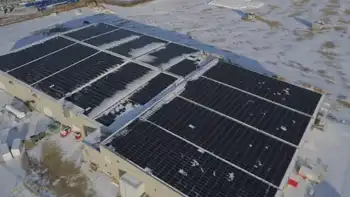
Solar-powered pot: Edmonton-area producer unveils largest rooftop solar array
Freedom Cannabis solar array powers an Acheson cannabis facility with 4,574 rooftop panels, a 1,830-kilowatt…
View more
Sign Up for Electricity Forum’s Newsletter
Stay informed with our FREE Newsletter — get the latest news, breakthrough technologies, and expert insights, delivered straight to your inbox.
Electricity Today T&D Magazine Subscribe for FREE

Stay informed with the latest T&D policies and technologies.
- Timely insights from industry experts
- Practical solutions T&D engineers
- Free access to every issue

