OPOWER, Xcel launch energy-reporting program

By Business Wire


NFPA 70b Training - Electrical Maintenance

Our customized live online or in‑person group training can be delivered to your staff at your location.

  • Live Online
  • 12 hours Instructor-led
  • Group Training Available
Regular Price:
$599
Coupon Price:
$499
Reserve Your Seat Today
OPOWER, the energy efficiency and smart grid software company, announced that Xcel Energy has launched a new energy efficiency program based on the OPOWER Home Energy Reports.

Fifty-thousand randomly selected homeowners in the St. Paul, Minn., area will be participating in a Home Energy Reporting program that provides residential customers with valuable information that can help them improve the energy efficiency in their homes and save on monthly natural gas and electricity bills.

All 50,000 program participants will receive access to this information through a web portal, with 35,000 of the participants also receiving paper reports through the mail.

“OPOWER Home Energy Reports have been successful in generating energy and costs savings at utilities across the country and in Minnesota by arming consumers with insights on easy steps they can take to become more energy efficient in their homes,” said Laura McCarten, regional vice president for Northern States Power Co.-Minnesota, an Xcel Energy company. “Over the next eighteen months, Xcel Energy will evaluate the impact on overall energy consumption, review consumer feedback and optimize our approach before a wider rollout.”

The OPOWER Home Energy Reports are created using advanced analytics that evaluate customersÂ’ energy usage patterns, combined with behavioral science techniques proven to motivate action. Each report provides a detailed analysis of individual monthly energy use as compared to similar households within the same geographic location, while recommending specific energy efficiency tips for every customer based on their household characteristics.

“We’re delighted to begin the new year with a partnership with Xcel Energy, a recognized leader in energy efficiency and smart grid technology, and a utility dedicated to delivering the latest in technology to its customers,” said Alex Laskey, president and co-founder of OPOWER. “Xcel Energy customers in the St. Paul, Minnesota, area can now better understand their energy usage via household-specific tips which explain the steps needed to manage their energy consumption and realize significant savings.”

In addition to deploying OPOWERÂ’s Home Energy Reporting platform, Xcel Energy is relying on OPOWERÂ’s Insight Engine, a customer segmentation and usage analysis software module, to guide a simultaneous deployment of in-home devices at Xcel Energy providing an additional form of energy use feedback for select customers. Both deployments are part of Xcel EnergyÂ’s large-scale energy efficiency pilot program approved by the Minnesota Office of Energy Security and aimed at assessing the energy savings and cost effectiveness of various types of usage feedback over the next eighteen months. Xcel Energy will use the findings from this pilot to inform its long-term, smart grid based customer engagement and energy efficiency strategy.

Related News

Britain breaks record for coal-free power generation - but what does this mean for your energy bills?

UK Coal-Free Electricity Record highlights rapid growth in renewables as National Grid phases out coal; wind, solar, and offshore projects surge, green tariffs expand, and energy comparison helps consumers switch to cheaper, cleaner deals.


Key Points

Britain's longest coal-free run, enabled by renewables, lower demand, and grid shifts for cheaper, greener tariffs.

✅ Record set after two months without coal-fired generation

✅ Renewables outpace fossil fuels; wind and solar dominate

✅ Green tariffs expand; prices at three-year lows


On Wednesday 10 June, Britain hit a significant landmark: the UK went for two full months without burning coal to generate power – that's the longest period since the 1880s, following earlier milestones such as a full week without coal power in the recent past.

According to the National Grid, Britain has now run its electricity network without burning coal since midnight on the 9 April. This coal-free period has beaten the country’s previous record of 18 days, six hours and 10 minutes, which was set in June 2019, even though low-carbon generation stalled in 2019 according to analyses.

With such a shift in Britain’s drive for renewables and lower electricity demand following the coronavirus lockdown, as Britain recorded its cleanest electricity during lockdown to date, now may be the perfect time to do an online energy comparison and switch to a cheaper, greener deal.

Only a decade ago, around 40 per cent of Britain’s electricity came from coal generation, but since then the country has gradually shifted towards renewable energy, with the coal share at record lows in the system today. When Britain was forced into lockdown in response to the coronavirus pandemic, electricity demand dropped sharply, and the National Grid took the four remaining coal-fired plants off the network.

Over the past 10 years, Britain has invested heavily in renewable energy. Back in 2010, only 3 per cent of the country's electricity came from wind and solar, and many people remained sceptical. However, now, the UK has the biggest offshore wind industry in the world. Plus, last year, construction of the world’s single largest wind farm was completed off the coast of Yorkshire.

At the same time, Drax – Britain’s biggest power plant – has started to switch from burning coal to burning compressed wooden pellets instead, reflecting the UK's progress as it keeps breaking its coal-free energy record again across the grid. By this time next year, the plant hopes to have phased out coal entirely.

So far this year, renewables have generated more power than all fossil fuels put together, the BBC reports, and the energy dashboard shows the current mix in real time. Renewables have been responsible for 37 per cent of electricity supplied to the network, with wind and solar surpassing nuclear for the first time, while fossil fuels have accounted for 35 per cent. During the same period, nuclear accounted for 18 per cent and imports made up the remaining 10 per cent.

What does this mean for consumers?

As the country’s electricity supply moves more towards renewables, customers have more choice than ever before. Most of the ‘Big Six’ energy companies now have tariffs that offer 100 per cent green electricity. On top of this, specialist green energy suppliers such as Bulb, Octopus and Green Energy UK make it easier than ever to find a green energy tariff.

The good news is that our energy comparison research suggests that green energy doesn’t have to cost you more than a traditional fixed-price energy contract would. In fact, some of the cheapest energy suppliers are actually green companies.

At present, energy bills are at three-year lows, which means that now is the perfect time to switch supplier. As prices remain low and renewables begin to dominate the marketplace, more switchers will be drawn to green energy deals than ever before.

However, if you’re interested in choosing a green energy supplier, make sure that you look at the company's fuel mix. This way, you’ll be able to see whether they are guaranteeing the usage of green energy, or whether they’re just offsetting your usage. All suppliers must report how their energy is generated to Ofgem, so you’ll easily be able to compare providers.

You may find that you pay more for a supplier that generates its own energy from renewables, or pay less if the supplier simply matches your usage by buying green energy. You can decide which option is right for you after comparing the prices.


Related News

View more

In 2021, 40% Of The Electricity Produced In The United States Was Derived From Non-Fossil Fuel Sources

Renewable Electricity Generation is accelerating the shift from fossil fuels, as wind, solar, and hydro boost the electric power sector, lowering emissions and overtaking nuclear while displacing coal and natural gas in the U.S. grid.


Key Points

Renewable electricity generation is power from non-fossil sources like wind, solar, and hydro to cut emissions.

✅ Driven by wind, solar, and hydro adoption

✅ Reduces fossil fuel dependence and emissions

✅ Increasing share in the electric power sector


The transition to electric vehicles is largely driven by a need to reduce our reliance on fossil fuels and reduce emissions associated with burning fossil fuels, while declining US electricity use also shapes demand trends in the power sector. In 2021, 40% of the electricity produced by the electric power sector was derived from non-fossil fuel sources.

Since 2007, the increase in non-fossil fuel sources has been largely driven by “Other Renewables” which is predominantly wind and solar. This has resulted in renewables (including hydroelectric) overtaking nuclear power’s share of electricity generation in 2021 for the first time since 1984. An increasing share of electricity generation from renewables has also led to a declining share of electricity from fossil fuel sources like coal, natural gas, and petroleum, with renewables poised to eclipse coal globally as deployment accelerates.

Includes net generation of electricity from the electric power sector only, and monthly totals can fluctuate, as seen when January power generation jumped on a year-over-year basis.

Net generation of electricity is gross generation less the electrical energy consumed at the generating station(s) for station service or auxiliaries, and the projected mix of sources is sensitive to policies and natural gas prices over time. Electricity for pumping at pumped-storage plants is considered electricity for station service and is deducted from gross generation.

“Natural Gas” includes blast furnace gas and other manufactured and waste gases derived from fossil fuels, while in the UK wind generation exceeded coal for the first time in 2016.

“Other Renewables” includes wood, waste, geo-thermal, solar and wind resources among others.

“Other” category includes batteries, chemicals, hydrogen, pitch, purchased steam, sulfur, miscellaneous technologies, and, beginning in 2001, non-renewable waste (municipal solid waste from non-biogenic sources, and tire-derived fuels), noting that trends vary by country, with UK low-carbon generation stalling in 2019.


Related News

View more

Solar + Wind = 10% of US Electricity Generation in 1st Half of 2018

US Electricity Generation H1 2018 saw wind and solar gains but hydro declines, as natural gas led the grid mix and coal fell; renewables' share, GWh, emissions, and capacity additions shaped the power sector.


Key Points

It is the H1 2018 US power mix, where natural gas led, coal declined, and wind and solar grew while hydro fell.

✅ Natural gas reached 32% of generation, highest share

✅ Coal fell; renewables roughly tied nuclear at ~20%

✅ Wind and solar up; hydro output down vs 2017


To complement our revival of US electricity capacity reports, here’s a revival of our reports on US electricity generation.

As with the fresh new capacity report, things are not looking too bright when it comes to electricity generation. There’s still a lot of grey — in the bar charts below, in the skies near fossil fuel power plants, and in the human and planetary outlook based on how slowly we are cutting fossil fuel electricity generation.

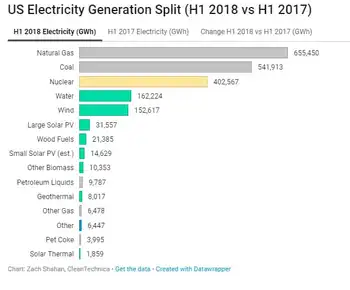
As you can see in the charts above, wind and solar energy generation increased notably from the first half of 2017 to the first half of 2018, and the EIA expected larger summer solar and wind generation in subsequent months, reinforcing that momentum.

A large positive when it comes to the environment and human health is that coal generation dropped a great deal year over year — by even more than renewables increased, though the EIA later noted an increase in coal-fired generation in a subsequent year, complicating the trend. However, on the down side, natural gas soared as it became the #1 source of electricity generation in the United States (32% of US electricity). Furthermore, coal was still solidly in the #2 position (27% of US electricity). Renewables and nuclear were essentially in a tie at 19.8% of generation, with renewables just a tad above nuclear.

Actually, combined with an increase in nuclear power generation, natural gas electricity production increased so much that the renewable energy share of electricity generation actually dropped in the first half of 2018 versus the first half of 2017, even amid declining electricity use in some periods. It was 19.8% this year and 20% last year.

Again, solar and wind saw a significant growth in its market share, from 9% to 9.9%, but hydro brought the whole category down due to a decrease from 9% to 8%.

The visuals above are probably the best way to examine it all. The H1 2018 chart was still dominated by fossil fuels, which together accounted for approximately 60% of electricity generation, even though by 2021 non-fossil sources supplied about 40% of U.S. electricity, highlighting the longer-term shift. In H1 2017, the figure was 59.7%. Furthermore, if you switch to the “Change H1 2018 vs H1 2017 (GWh)” chart, you can watch a giant grey bar representing natural gas take over the top of the chart. It almost looks like it’s part of the border of the chart. The biggest glimmer of positivity in that chart is seeing the decline in coal at the bottom.

What will the second half of the year bring? Well, the gigantic US electricity generation market shifts slowly, even as monthly figures can swing, as January generation jumped 9.3% year over year according to the EIA, reminding us about volatility. There is so much base capacity, and power plants last so long, that it takes a special kind of magic to create a rapid transition to renewable energy. As you know from reading this quarter’s US renewable energy capacity report, only 43% of new US power capacity in the first half of the year was from renewables. The majority of it was from natural gas. Along with other portions of the calculation, that means that electricity generation from natural gas is likely to increase more than electricity generation from renewables.

Jump into the numbers below and let us know if you have any more thoughts.


Related News

View more

Norway Considers Curbing Electricity Exports to Avoid Shortages

Norway Electricity Export Limits weigh hydro reservoirs, energy security, EU-UK interconnectors, and record power prices amid Russia gas cuts; Statnett grid constraints and subsidies debate intensify as reservoir levels fall, threatening winter supply.


Key Points

Rules to curb Norway's power exports when reservoirs are very low, protecting supply security and easing extreme prices.

✅ Triggered by low hydro levels and record day-ahead prices

✅ Considers EU/UK cables, Statnett operations, seasonal thresholds

✅ Aims to secure winter supply and expand subsidies


Norway, one of Europe’s biggest electricity exporters, is considering measures to limit power shipments to prevent domestic shortages amid surging prices, according to local media reports.

The government may propose a rule to limit exports if the water level for Norway’s hydro reservoirs drops to “very low” levels, to ensure security of supply, said Energy Minister Terje Aasland, according NTB newswire. The limit would take account of seasonality and would differ across the about 1,800 hydro reservoirs, he said. 

Russia’s gas supply cuts in retaliation for European sanctions over the war in Ukraine have triggered the continent’s worst energy crisis in decades, with demand surging for cheap Norwegian hydro electricity. Yet the government faces increasing calls from the public and opposition to limit flows abroad. Prices are near record levels in some parts of the Nordic nation as hydro-reservoir levels have plunged in the south after a drier-than-normal spring. 

The government has been under pressure to do something about exports since before April. Flows on the cables are regulated by deals with both the European Union and the UK energy market and Norway can’t simply cut flows. It’s the latest test of European solidarity and a wake-up call for Europe when it comes to energy supplies. Hungary is trying to ban energy exports after it declared an energy emergency.

Back in May, grid operator Statnett SF warned that Norway could face a strained power situation after less snowfall than usual during the winter. At the end of last week, the level of filling in Norwegian hydro reservoirs was 66.5%, compared with a median 74.9% for the corresponding time in 2002-2021, regulator NVE said. Day-ahead electricity prices in southwest Norway soared to a record 423 euros per megawatt-hour late last month, partly due to bottlenecks in the grid limiting supply from the northern regions.

The grid operator has been asked to present by Oct. 1 possible measures that need to be taken to secure supply and infrastructure security ahead of the winter. Statnett operates cables to the UK and Germany aimed at selling surplus electricity and would likely take a financial hit if curbs were introduced. “Operations of these will always follow current laws and regulations,” Irene Meldal, a company spokeswoman, said Friday by email. 

Premier Jonas Gahr Store signaled his minority government will file proposals that also include more subsidies to families and companies and align with Europe’s emergency price measures during August, according to an interview with TV2 on Thursday. Meanwhile, opposition politicians plan to hold an extraordinary parliament meeting to discuss boosting the subsidies.

Aasland will summon the parties’ representatives to a meeting on Monday on the electricity crisis, the Aftenposten newspaper reported on Friday, without citing anyone. He intends to inform the parties about the ongoing work and aims to “avoid rushed decisions” by the parliamentary majority.

Norway Faces Pressure to Curb Power Exports as Prices Surge (1)

The nation gets almost all of its electricity from its vast hydro resources. Historically, it has been able to export a hefty surplus and still have among the lowest prices in Europe. 


Related News

View more

Price Spikes in Ireland Fuel Concerns Over Dispatachable Power Shortages in Europe

ISEM Price Volatility reflects Ireland-Northern Ireland grid balancing pressures, driven by dispatchable power shortages, day-ahead market dynamics, renewable shortfalls, and interconnector constraints, affecting intraday trading, operational reserves, and cross-border electricity flows.


Key Points

ISEM price volatility is Irish power price swings from grid balancing stress and limited dispatchable capacity.

✅ One-off spike linked to plant outage and low renewables

✅ Day-ahead market settling; intraday trading integration pending

✅ Interconnectors and reserves vital to manage adequacy


Irish grid-balancing prices soared to €3,774 ($4,284) per megawatt-hour last month amid growing concerns over dispatchable power capacity across Europe.

The price spike, triggered by an alert regarding generation losses, came only four months after Ireland and Northern Ireland launched an Integrated Single Electricity Market (ISEM) designed to make trading more competitive and improve power distribution across the island.

Evie Doherty, senior consultant for Ireland at Cornwall Insight, a U.K.-based energy consultancy, said significant price volatility was to be expected while ISEM is still settling down, aligning with broader 2019 grid edge trends seen across markets.

When the U.K. introduced a single market for Great Britain, called British Electricity Trading and Transmission Arrangements, in 2005, it took at least six months for volatility to subside, Doherty said.

In the case of ISEM, “it will take more time to ascertain the exact drivers behind the high prices,” she said. “We are being told that the day-ahead market is functioning as expected, but it will take time to really be able to draw conclusions on efficiency.”

Ireland and Northern Ireland have been operating with a single market “very successfully” since 2007, said Doherty. Although each jurisdiction has its own regulatory authority, they make joint decisions regarding the single market.

ISEM, launched in October 2018, was designed to help include Ireland and Northern Ireland day-ahead electricity prices in a market pricing system called the European Union Pan-European Hybrid Electricity Market Integration Algorithm.

In time, ISEM should also allow the Irish grids to participate in European intraday markets, and recent examples like Ukraine's grid connection underline the pace of integration efforts across Europe. At present, they are only able to do so with Great Britain. “The idea was to...integrate energy use and create more efficient flows between jurisdictions,” Doherty said.

EirGrid, the Irish transmission system operator, has reported that flows on its interconnector with Northern Ireland are more efficient than before, she said.

The price spike happened when the System Operator for Northern Ireland issued an alert for an unplanned plant outage at a time of low renewable output and constraints on the north-south tie-line with Ireland, according to a Cornwall Insight analysis.


Not an isolated event

Although it appears to have been a one-off event, there are increasing worries that a shortage of dispatchable power could lead to similar situations elsewhere across Europe, as seen in Nordic grid constraints recently.

Last month, newspaper Frankfurter Allgemeine Zeitung (FAZ) reported that German industrial concerns had been forced to curtail more than a gigawatt of power consumption to maintain operational reserves on the grid in December, after renewable production fell short of expectations and harsh weather impacts strained systems elsewhere.

Paul-Frederik Bach, a Danish energy consultant, has collected data showing that this was not an isolated incident. The FAZ report said German aluminum smelters had been forced to cut back on energy use 78 times in 2018, he noted.

Energy availability was also a concern last year in Belgium, where six out of seven nuclear reactors had been closed for maintenance. The closures forced Belgium to import 23 percent of its electricity from neighboring countries, Bach reported.

In a separate note, Bach revealed that 11 European countries that were net importers of energy had boosted their imports by 26 percent between 2017 and 2018. It is important to note that electricity imports do not necessarily imply a shortage of power, he stated.

However, it is also true that many European grid operators are girding themselves for a future in which dispatchable power is scarcer than today.

EirGrid, for example, expects dispatchable generation and interconnection capacity to drop from 10.6 gigawatts in 2018 to 9 gigawatts in 2027.

The Swedish transmission system operator Svenska Kraftnät, meanwhile, is forecasting winter peak power deficits could rise from 400 megawatts currently to 2.5 gigawatts in 2020-21.

Research conducted by the European Network of Transmission System Operators for Electricity, suggests power adequacy will fall across most of Europe up to 2025, although perhaps not to a critical degree.

The continent’s ability to deal with the problem will be helped by having more efficient trading systems, Bach told GTM. That means developments such as ISEM could be a step in the right direction, despite initial price volatility.

In the long run, however, Europe will need to make sure market improvements are accompanied by investments in HVDC technology and interconnectors and reserve capacity. “Somewhere there must be a production of electricity, even when there is no wind,” said Bach. 


Related News

View more

Thermal power plants’ PLF up on rising demand, lower hydro generation

India Coal Power PLF rose as capacity utilisation improved on rising peak demand and hydropower shortfall; thermal plants lifted plant load factor, IPPs lagged, and generation beat program targets amid weak rainfall and slower snowmelt.


Key Points

Coal plant load factor in India rose in May on higher demand and weak hydropower, with generation beating targets.

✅ PLF rose to 65.3% as demand climbed

✅ Hydel generation fell 14% YoY on poor rainfall

✅ IPP PLF at 57.8%, below 60% debt comfort


Capacity utilisation levels of coal-based power plants improved in May because of a surge in electricity demand and lower generation from hydroelectric sources. The plant load factor (PLF) of thermal power plants went up to 65.3% in the month, 1.7 percentage points higher than the year-ago period.

While PLFs of central and state government-owned plants were 75.5% and 64.5%, respectively, the same for independent power producers (IPPs) stood at 57.8%, even as coal and electricity shortages eased across the market. Though PLFs of IPPs were higher than May 2017 levels, it failed to cross the 60% mark, which eases debt servicing capabilities of power generation assets.

Thermal power plants generated 96,580 million units (MU) in May, 4% more than the programme set for the month and 5.2% higher than last year, partly supported by higher imported coal volumes in the market. On the other hand, hydel plants produced 10,638 MU, 10% lower than the target, reflecting a 14% decline from last year.

#google#

Peak demand of power on the last day of the month was 1,62,132 MW, 4.3% higher than the demand registered in the same day a year ago, underscoring India's position as the third-largest electricity producer globally.

According to sources, hydropower plants have been generating lesser than expected electricity due to inadequate rainfall and snow melting at a slower pace than previous years, even as the US reported a power generation jump year on year. Data for power generation from renewable sources have not been made available yet.


Related News

View more

Sign Up for Electricity Forum’s Newsletter

Stay informed with our FREE Newsletter — get the latest news, breakthrough technologies, and expert insights, delivered straight to your inbox.

Electricity Today T&D Magazine Subscribe for FREE

Stay informed with the latest T&D policies and technologies.
  • Timely insights from industry experts
  • Practical solutions T&D engineers
  • Free access to every issue

Live Online & In-person Group Training

Advantages To Instructor-Led Training – Instructor-Led Course, Customized Training, Multiple Locations, Economical, CEU Credits, Course Discounts.

Request For Quotation

Whether you would prefer Live Online or In-Person instruction, our electrical training courses can be tailored to meet your company's specific requirements and delivered to your employees in one location or at various locations.