Protective Relay Training - Basic
Our customized live online or in‑person group training can be delivered to your staff at your location.

- Live Online
- 12 hours Instructor-led
- Group Training Available
Regular Price:
$699
Coupon Price:
$599
BERN
—
Advanced Traffic Light System for Geothermal Safety models fracture growth and friction with rock physics, geophones, and supercomputers to predict induced seismicity during hydraulic stimulation, enabling real-time risk control for ETH Zurich and SED.
Story Summary
ATLS uses rock physics, geophones, and HPC to forecast induced seismicity in real time during geothermal stimulation.
Real-time seismic risk forecasts during hydraulic stimulation
Uses rock physics, friction, and fracture modeling on HPC
Supports ETH Zurich and SED field tests in Iceland and Bedretto
The Swiss Earthquake Service and ETH Zurich want to make geothermal energy safer, so news piece from Switzerland earlier this month. This is to be made possible by new software, including machine learning, and the computing power of supercomputers. The first geothermal tests have already been carried out in Iceland, and more will follow in the Bedretto laboratory.
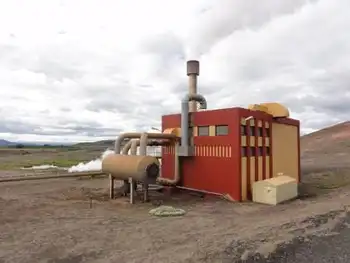
In areas with volcanic activity, the conditions for operating geothermal plants are ideal. In Iceland, the Hellisheidi power plant makes an important contribution to sustainable energy use, alongside innovations like electricity from snow in cold regions.
Deep geothermal energy still has potential. This is the basis of the 2050 energy strategy. While the inexhaustible source of energy in volcanically active areas along fault zones of the earth’s crust can be tapped with comparatively little effort and, where viable, HVDC transmission used to move power to demand centers, access on the continents is often much more difficult and risky. Because the geology of Switzerland creates conditions that are more difficult for sustainable energy production.
Improve the water permeability of the rock
On one hand, you have to drill four to five kilometers deep to reach the correspondingly heated layers of earth in Switzerland. It is only at this depth that temperatures between 160 and 180 degrees Celsius can be reached, which is necessary for an economically usable water cycle. On the other hand, the problem of low permeability arises with rock at these depths. “We need a permeability of at least 10 millidarcy, but you can typically only find a thousandth of this value at a depth of four to five kilometers,” says Thomas Driesner, professor at the Institute of Geochemistry and Petrology at ETH Zurich.
In order to improve the permeability, water is pumped into the subsurface using the so-called “fracture”. The water acts against friction, any fracture surfaces shift against each other and tensions are released. This hydraulic stimulation expands fractures in the rock so that the water can circulate in the hot crust. The fractures in the earth’s crust originate from tectonic tensions, caused in Switzerland by the Adriatic plate, which moves northwards and presses against the Eurasian plate.
In addition to geothermal energy, the “Advanced Traffic Light System” could also be used in underground construction or in construction projects for the storage of carbon dioxide.
Quake due to water injection
The disadvantage of such hydraulic stimulations are vibrations, which are often so weak or cannot be perceived without measuring instruments. But that was not the case with the geothermal projects in St. Gallen 2013 and Basel 2016. A total of around 11,000 cubic meters of water were pumped into the borehole in Basel, causing the pressure to rise. Using statistical surveys, the magnitudes 2.4 and 2.9 defined two limit values ??for the maximum permitted magnitude of the earthquakes generated. If these are reached, the water supply is stopped.
In Basel, however, there was a series of vibrations after a loud bang, with a time delay there were stronger earthquakes, which startled the residents. In both cities, earthquakes with a magnitude greater than 3 have been recorded. Since then it has been clear that reaching threshold values ??determines the stop of the water discharge, but this does not guarantee safety during the actual drilling process.
Simulation during stimulation
The Swiss Seismological Service SED and the ETH Zurich are now pursuing a new approach that can be used to predict in real time, building on advances by electricity prediction specialists in Europe, during a hydraulic stimulation whether noticeable earthquakes are expected in the further course. This is to be made possible by the so-called “Advanced Traffic Light System” based on rock physics, a software developed by the SED, which carries out the analysis on a high-performance computer.
Geophones measure the ground vibrations around the borehole, which serve as indicators for the probability of noticeable earthquakes. The supercomputer then runs through millions of possible scenarios, similar to algorithms to prevent power blackouts during ransomware attacks, based on the number and type of fractures to be expected, the friction and tensions in the rock. Finally, you can filter out the scenario that best reflects the underground.
Further tests in the mountain
However, research is currently still lacking any real test facility for the system, because incorrect measurements must be eliminated and a certain data format adhered to before the calculations on the supercomputer. The first tests were carried out in Iceland last year, with more to follow in the Bedretto geothermal laboratory in late summer, where reliable backup power from fuel cell solutions can keep instrumentation running. An optimum can now be found between increasing the permeability of rock layers and an adequate water supply.
The new approach could make geothermal energy safer and ultimately help this energy source to become more accepted, while grid upgrades like superconducting cables improve efficiency. Research also sees areas of application wherever artificially caused earthquakes can occur, such as in underground mining or in the storage of carbon dioxide underground.


Related News
U.S. Launches $250 Million Program To Strengthen Energy Security For Rural Communities
DOE RMUC Cybersecurity Program supports rural, municipal, and small investor-owned utilities with grants, technical assistance,…
View more
Berlin Geothermal Plant in El Salvador Set to Launch This Year
El Salvador Geothermal Expansion boosts renewable energy with a 7 MW Berlin binary ORC plant,…
View more
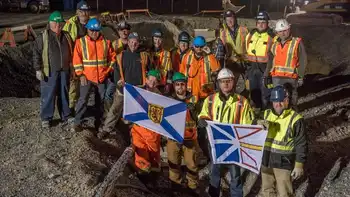
Maritime Link sends first electricity between Newfoundland, Nova Scotia
Maritime Link HVDC Transmission connects Newfoundland and Nova Scotia to the North American grid, enabling…
View more
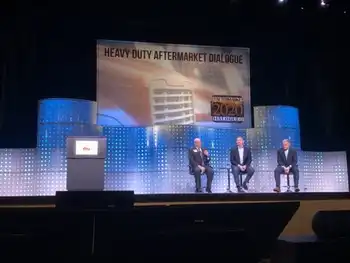
Electric vehicles to transform the aftermarket … eventually
Heavy-Duty Truck Electrification is disrupting the aftermarket as diesel declines: fewer parts, regenerative braking, emissions…
View more
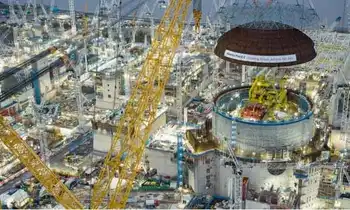
Setbacks at Hinkley Point C Challenge UK's Energy Blueprint
Hinkley Point C delays highlight EDF cost overruns, energy security risks, and wholesale power prices,…
View more
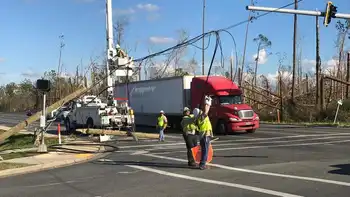
Crews have restored power to more than 32,000 Gulf Power customers
Gulf Power Hurricane Michael Response details rapid power restoration, grid rebuilding, and linemen support across…
View more
Sign Up for Electricity Forum’s Newsletter
Stay informed with our FREE Newsletter — get the latest news, breakthrough technologies, and expert insights, delivered straight to your inbox.
Electricity Today T&D Magazine Subscribe for FREE

Stay informed with the latest T&D policies and technologies.
- Timely insights from industry experts
- Practical solutions T&D engineers
- Free access to every issue
