NFPA 70E Training
Our customized live online or in‑person group training can be delivered to your staff at your location.

- Live Online
- 6 hours Instructor-led
- Group Training Available
Regular Price:
$199
Coupon Price:
$149
LOS ANGELES
—
Tesla Solar and Powerwall Discount offers a ~10% installation price cut amid PG&E blackouts, helping California homeowners with solar panels, battery storage, and backup power, while supporting renewable energy and resilient Supercharger infrastructure.
The Important Points
A ~10% installation discount on Tesla solar panels and Powerwall batteries to boost backup power during PG&E blackouts.
~10% off installation for solar plus Powerwall
Offer open to all buyers, not limited to PG&E outage areas
Enhances home backup power and grid resilience during blackouts
Tesla adding Powerpacks at Superchargers in affected regions
Lease options from $45/month help lower upfront costs
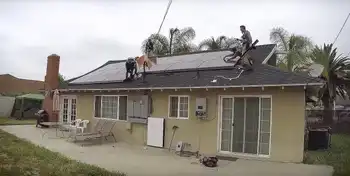
Pacific Gas & Electric’s (PG&E) shutoff of electric supply to residents in California’s Bay Area has caught the attention of Tesla and SpaceX CEO Elon Musk, who, while highlighting a huge future for Tesla Energy in coming years, has announced that he would be offering a price reduction of approximately 10% for a solar panel and Tesla Powerwall battery installation. The discount will be available to anyone interested in powering their homes with solar energy, not just the 800,000 affected homes in the Bay Area.
After initially tweeting a link to Tesla’s Solar page on Tesla.com, Musk added that he would be offering a “~10% price reduction” in installation price for solar panels and Powerwall batteries for anyone, as California explores EVs for grid stability during emergencies, including those who have lost power in response to PG&E’s power shutoff. The blackout induced by the California-based power company is a part of an effort to reduce the possibility of wildfires. PG&E lines were the cause of multiple fires in the past, so the company is taking every necessary precaution to reduce the probability of its lines causing another fire in the future.
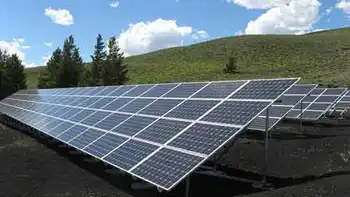
Tesla Solar recently offered a subscription program that would allow homeowners to lease panels for a fraction of the cost. The service is available to both residential and commercial customers, and costs as little as $45 a month in some states, particularly appealing in California where EV sales top 20% recently. The option to lease solar panels carries no long-term contracts that would tie down customers to a lengthy commitment.
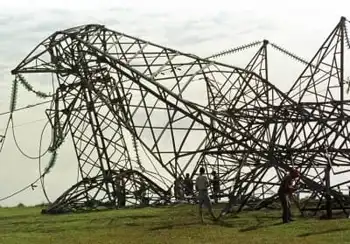
Wildfires have always been an issue in California. Currently, fires are ripping through Los Angeles county, presumably caused by the winds of the Autumn season. The effort to reduce the environmental impact of forest fires in the state has been increasingly more prevalent over the years. But 2019 is a different story, underscoring that California may need a much bigger grid to support electrification, considering the previous year was noted as the deadliest wildfire season in California’s history. Over 8,500 fires destroyed over 1.89 million acres of land burned due to fires, causing the California Department of Forestry and Fire Protection to spend $432 million through the end of August 2018, according to the Associated Press.
In reaction to the news of the power shutoffs, Tesla added words of advice to vehicle affected owners on its app. The company posted a message encouraging drivers to keep their vehicles charged to 100% and highlighted that EVs can power homes for up to three days during outages, in order to prevent interruptions in driving. Those who are driving ICE vehicles are feeling the effects of the blackout too, as gas stations in California’s affected region have begun to shut down. Musk also tweeted that he would be installing Tesla Powerpacks at all Supercharger stations in the affected region, a move that can help ease strain on state power grids during outages, in order to allow owners to charge their vehicles.
In addition to the efforts that Tesla has already put into place, Musk plans to transition all Supercharger stations to solar power as soon as possible. But the sunny climate of California offers residents a great opportunity to move from gas and electric, even as some warn of a looming green car wreck in the state, to a more eco-friendly, sun-powered option. Tesla solar will completely eliminate power blackouts that are used to control wildfires in California.
Related News
Related News
Energy-hungry Europe to brighten profit at US solar equipment makers
European Solar Inverter Demand surges as photovoltaics and residential solar expand during the clean energy…
View more
New Power Grid “Report Card” Reveal Dangerous Vulnerabilities
U.S. Power Grid D+ Rating underscores aging infrastructure, rising outages, cyber threats, EMP and solar…
View more
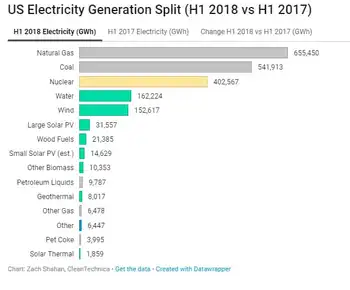
Solar + Wind = 10% of US Electricity Generation in 1st Half of 2018
US Electricity Generation H1 2018 saw wind and solar gains but hydro declines, as natural…
View more

Alberta sets new electricity usage record during deep freeze
Alberta Electricity Demand Record surges during a deep freeze, as AESO reports peak load in…
View more
France hopes to keep Brussels sweet with new electricity pricing scheme
France Electricity Pricing Mechanism aligns with EU rules, leveraging nuclear energy and EDF profits, avoiding…
View more
FERC needs to review capacity market performance, GAO recommends
FERC Capacity Markets face scrutiny as GAO flags inconsistent data on resource adequacy and costs,…
View more
Sign Up for Electricity Forum’s Newsletter
Stay informed with our FREE Newsletter — get the latest news, breakthrough technologies, and expert insights, delivered straight to your inbox.
Electricity Today T&D Magazine Subscribe for FREE

Stay informed with the latest T&D policies and technologies.
- Timely insights from industry experts
- Practical solutions T&D engineers
- Free access to every issue
