Substation Relay Protection Training
Our customized live online or in‑person group training can be delivered to your staff at your location.

- Live Online
- 12 hours Instructor-led
- Group Training Available
Regular Price:
$699
Coupon Price:
$599
The recent spell of subzero weather has meant higher-than-normal seasonal demand for electricity across Wisconsin and the Midwest, the region's utilities say.
But while usage is up, about 7 percent to 8 percent above the Midwest's historical seasonal use, as furnaces in homes and businesses run more frequently and for pro-longed periods of time to keep occupants warm, demands are no where near summer peaks when outdoor temperatures are in the upper 90s.
"There is high demand but it's nowhere near what we'd see in the summer months," said Carl Dombek, spokesman for the Indianapolis-based Midwest Independent Transmission System Operator. MITSO is a power transmission grid that covers a 15-state area, which includes Wisconsin and a portion of Canada.
Dombek said that February 5 usage in MITSO's service area was about 81,000 megawatts. While that is higher than normal for winter, it doesn't come close to MITSO's record of 136,000 megawatts set in late July.
The Midwest has a generating capacity of about 144,142 megawatts.
Kerry Spees, spokesman for Wisconsin Public Service Corp. in Green Bay, which has about 420,000 electric customers in northeast and north central Wisconsin, said WPS' energy demand from customers peaked at about 7 p.m. February 5. He said roughly 1,932 megawatts of electricity was used at that time.
"We're normally at around 1,800 (megawatts) during a normal winter day," Spees said. "And today we're using less than yesterday (February 5), because it isn't as cold out."
Spees said WPS' record electricity demand was set July 17 when customer usage topped 2,425 megawatts. WPS itself has generating capacity of about 2,000 megawatts but has power agreements with other utilities so it can meet its customers' demands.
Spees said WPS will have additional generating capacity of its own once its new coal-burning, 500-megawatt plant comes online near Wausau in 2008.
We Energies in Milwaukee, which serves southeast Wisconsin and the Fox Valley, said its typical daily winter demand for electricity is around 4,000 megawatts.
Rick James, spokesman for We Energies, said usage in recent days has increased to about the mid-4,000 range but nowhere near its record usage of 6,505 megawatts set on July 31. We Energies record usage for winter was 5,066 megawatts set in February 1996.
"We are seeing a marginal uptick right now in electricity demand," James said. "The reason for that of course is that people are running their furnaces more. But demand still is 20 to 30 percent more in the summer because air conditioners draw more power than a blower on a forced-air furnace."
The operator of the power grid for the mid-Atlantic and parts of the Midwest said it reached an all-time record for winter electricity use amid frigid weather on the East Coast.
Valley Forge, Pa.-based PJM Interconnection, which operates the power grid in 13 states and Washington, D.C., said it set an all-time record for winter electricity use recently, with demand rising above 112,500 megawatts.
The previous record for winter use, set in December 2005, was 110,414 megawatts.
The all-time record for summer use on the PJM grid, 144,644 megawatts, was set during a heat wave last August.
Related News
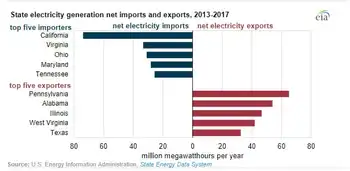
EIA: Pennsylvania exports the most electricity, California imports the most from other states
U.S. Electricity Trade by State, 2013-2017 highlights EIA grid patterns, interstate imports and exports, cross-border…
View more
California Regulators Face Calls for Action as Electricity Bills Soar
California Electricity Rate Hikes strain households as CPUC weighs fixed charges, utility profit caps, and…
View more
California Skirts Blackouts With Heat Wave to Test Grid Again
California Heatwave Power Crisis strains CAISO as record demand triggers emergency alerts, demand response, and…
View more
European Power Hits Records as Plants Start to Buckle in Heat
European Power Crisis intensifies as record electricity prices, nuclear output cuts, gas supply strain, heatwave…
View more
California lawmakers plan to overturn income-based utility charges
California income-based utility charges face bipartisan pushback as the PUC weighs fixed fees for PG&E,…
View more
UK National Grid Commissions 2GW Substation
UK 2-GW Substation strengthens National Grid power transmission in Kent, enabling offshore wind integration, voltage…
View more
Sign Up for Electricity Forum’s Newsletter
Stay informed with our FREE Newsletter — get the latest news, breakthrough technologies, and expert insights, delivered straight to your inbox.
Electricity Today T&D Magazine Subscribe for FREE

Stay informed with the latest T&D policies and technologies.
- Timely insights from industry experts
- Practical solutions T&D engineers
- Free access to every issue

