Protective Relay Training - Basic
Our customized live online or in‑person group training can be delivered to your staff at your location.

- Live Online
- 12 hours Instructor-led
- Group Training Available
Regular Price:
$699
Coupon Price:
$599
WASHINGTON
—
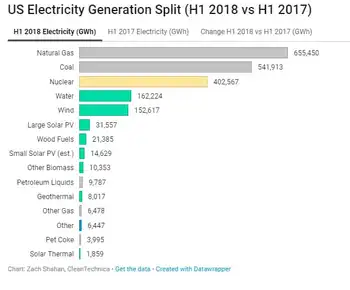
US Electricity Generation H1 2018 saw wind and solar gains but hydro declines, as natural gas led the grid mix and coal fell; renewables' share, GWh, emissions, and capacity additions shaped the power sector.
The Main Points
It is the H1 2018 US power mix, where natural gas led, coal declined, and wind and solar grew while hydro fell.
Natural gas rose to 32% of US generation, leading the mix.
Coal declined YoY but remained second at 27% of US electricity.
Renewables were 19.8% vs 20% prior year; wind+solar 9.9%, hydro 8%.
Fossil fuels were ~60% in H1 2018; shift is gradual despite volatility.
To complement our revival of US electricity capacity reports, here’s a revival of our reports on US electricity generation.
As with the fresh new capacity report, things are not looking too bright when it comes to electricity generation. There’s still a lot of grey — in the bar charts below, in the skies near fossil fuel power plants, and in the human and planetary outlook based on how slowly we are cutting fossil fuel electricity generation.
As you can see in the charts above, wind and solar energy generation increased notably from the first half of 2017 to the first half of 2018, and the EIA expected larger summer solar and wind generation in subsequent months, reinforcing that momentum.
A large positive when it comes to the environment and human health is that coal generation dropped a great deal year over year — by even more than renewables increased, though the EIA later noted an increase in coal-fired generation in a subsequent year, complicating the trend. However, on the down side, natural gas soared as it became the #1 source of electricity generation in the United States (32% of US electricity). Furthermore, coal was still solidly in the #2 position (27% of US electricity). Renewables and nuclear were essentially in a tie at 19.8% of generation, with renewables just a tad above nuclear.
Actually, combined with an increase in nuclear power generation, natural gas electricity production increased so much that the renewable energy share of electricity generation actually dropped in the first half of 2018 versus the first half of 2017, even amid declining electricity use in some periods. It was 19.8% this year and 20% last year.
Again, solar and wind saw a significant growth in its market share, from 9% to 9.9%, but hydro brought the whole category down due to a decrease from 9% to 8%.
The visuals above are probably the best way to examine it all. The H1 2018 chart was still dominated by fossil fuels, which together accounted for approximately 60% of electricity generation, even though by 2021 non-fossil sources supplied about 40% of U.S. electricity, highlighting the longer-term shift. In H1 2017, the figure was 59.7%. Furthermore, if you switch to the “Change H1 2018 vs H1 2017 (GWh)” chart, you can watch a giant grey bar representing natural gas take over the top of the chart. It almost looks like it’s part of the border of the chart. The biggest glimmer of positivity in that chart is seeing the decline in coal at the bottom.
What will the second half of the year bring? Well, the gigantic US electricity generation market shifts slowly, even as monthly figures can swing, as January generation jumped 9.3% year over year according to the EIA, reminding us about volatility. There is so much base capacity, and power plants last so long, that it takes a special kind of magic to create a rapid transition to renewable energy. As you know from reading this quarter’s US renewable energy capacity report, only 43% of new US power capacity in the first half of the year was from renewables. The majority of it was from natural gas. Along with other portions of the calculation, that means that electricity generation from natural gas is likely to increase more than electricity generation from renewables.
Jump into the numbers below and let us know if you have any more thoughts.
Related News
Related News

Top Senate Democrat calls for permanent renewable energy, storage, EV tax credits
Clean Energy Tax Incentives could expand under Democratic proposals, including ITC, PTC, and EV tax…
View more

Ontario Providing Electricity Relief to Families, Small Businesses and Farms During COVID-19
Ontario TOU Electricity Rate Relief offers 24/7 fixed off-peak pricing at 10.1¢/kWh, suspending time-of-use tiers…
View more
City officials take clean energy message to Georgia Power, PSC
Georgia Cities Clean Energy IRP Coalition unites Savannah, Atlanta, Decatur, and Athens-Clarke to shape Georgia…
View more

China's Path to Carbon Neutrality
China Unified Power Market enables carbon neutrality through renewable integration, cross-provincial electricity trading, smart grid…
View more

Alberta breaks summer electricity record, still far short of capacity
Alberta Electricity Peak Demand surged to 10,638 MW, as AESO reported record summer load from…
View more

Opinion: Now is the time for a western Canadian electricity grid
Western Canada Electric Grid could deliver interprovincial transmission, reliability, peak-load support, reserve sharing, and wind…
View more
Sign Up for Electricity Forum’s Newsletter
Stay informed with our FREE Newsletter — get the latest news, breakthrough technologies, and expert insights, delivered straight to your inbox.
Electricity Today T&D Magazine Subscribe for FREE

Stay informed with the latest T&D policies and technologies.
- Timely insights from industry experts
- Practical solutions T&D engineers
- Free access to every issue
