Xcel Energy closer to doing away with impediments to wind-generated electricity

By Pioneer Press


NFPA 70e Training

Our customized live online or in‑person group training can be delivered to your staff at your location.

  • Live Online
  • 6 hours Instructor-led
  • Group Training Available
Regular Price:
$199
Coupon Price:
$149
Reserve Your Seat Today
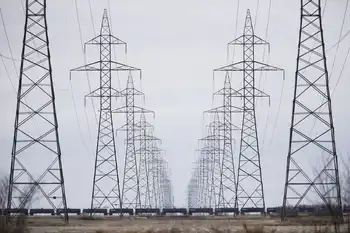
Xcel Energy moved closer to eliminating a transmission bottleneck that has hampered the use of wind-generated electricity in Minnesota.

The Minneapolis-based electric and natural gas utility said Minnesota environmental regulators have approved routes for two transmission lines linking wind-powered generators on Buffalo Ridge near Pipestone with the rest of Xcel's distribution system.

Xcel still needs approval from South Dakota regulators and easements from landowners along both proposed lines before construction on the $86 million project can begin. The project is the largest transmission line approved in Minnesota in approximately 20 years, according to Xcel.

Xcel says the new transmission lines are needed because existing lines between Buffalo Ridge and the rest of its system are unable to carry more power.

Wind farms on Buffalo Ridge are able to produce approximately 500 megawatts of power, but the existing lines can transmit 425 megawatts, said Pam Rasmussen, an Xcel official who worked on obtaining the permits from the Minnesota Environmental Quality Board.

The new lines would boost capacity to 825 megawatts. One megawatt is enough to power 1,000 homes, though wind power is less reliable and thus Buffalo Ridge is able to power approximately 150,000 homes, according to Xcel.

The state of Minnesota has mandated that Xcel get 10 percent of its energy from renewable sources by 2015; it now gets 6 percent from those sources.

The company agreed to that requirement in 2003 in exchange for extending the useful life of its Prairie Island nuclear plant by allowing more storage of radioactive waste there. Xcel currently is the No. 2 provider of wind power in the country, with about 830 megawatts.

One of the new lines would be approximately 86 miles long and largely follow Interstate 90 between an Xcel substation near Lakefield and Sioux Falls. The second line would connect a substation at Buffalo Ridge with a new substation in Nobles County, Minn., approximately 40 miles to the southeast.

Xcel hopes to begin construction next year, Rasmussen said.

Related News

Beating Covid Is All About Electricity

Hospital Electricity Reliability underpins ICU operations, ventilators, medical devices, and diagnostics, reducing power outages risks via grid power and backup generators, while energy poverty and blackouts magnify COVID-19 mortality in vulnerable regions.


Key Points

Hospital electricity reliability is steady power that keeps ICU care, ventilators and medical devices operating.

✅ ICU loads: ventilators, monitors, infusion pumps, diagnostics

✅ Grid power plus backup generators minimize outage risk

✅ Energy poverty increases COVID-19 mortality and infection


Robert Bryce, Contributor

During her three-year career as a registered nurse, my friend, C., has cared for tuberculosis patients as well as ones with severe respiratory problems. She’s now caring for COVID-19 patients at a hospital in Ventura County, California, where debates about keeping the lights on continue amid the state’s energy transition. Is she scared about catching the virus? “No,” she replied during a phone call on Thursday. “I’m pretty unflappable.”

What would scare her? She quickly replied, “a power outage,” a threat that grows during summer blackouts when heat waves drive demand. About a year ago, while working in Oregon, the hospital she was working in lost power for about 45 minutes. “It was terrifying,” she said. 

C., who wasn’t authorized by her hospital to talk to the media, and thus asked me to only use the initial of her first name, said that COVID-19 patients are particularly reliant on electrical devices. She quickly ticked off the machines: “The bed, the IV machine, vital signs monitor, heart monitor, the sequential compression devices...” COVID-19 patients are hooked up to a minimum of five electrical devices, she said, and if the virus-stricken patient needs high-pressure oxygen or a ventilator, the number of electrical devices could be two or three times that number. “You name it, it plugs in,” she said.  

Today In: Energy

The virus has infected some 2.2 million people around the world and killed more than 150,000,including more than 32,000 people here in the U.S. While those numbers are frightening, it is apparent that the toll would be far higher without adequate supplies of reliable electricity. Modern healthcare systems depend on electricity. Hospitals are particularly big consumers. Power demand in hospitals is about 36 watts per square meter, which is about six times higher than the electricity load in a typical American home, and utilities are turning to AI to adapt to electricity demands during surges. 

Beating the coronavirus is all about electricity. Indeed, nearly every aspect of coronavirus detection, testing, and treatment requires juice. Second, it appears that the virus is more deadly in places where electricity is scarce or unreliable. Finally, if there are power outages in virus hotspots or hospitals, a real risk in a grid with more blackouts than other developed countries, the damage will be even more severe. 

As my nurse friend in Ventura County made clear, her ability to provide high-quality care for patients is wholly dependent on reliable electricity. The thermometers used to check for fever are powered by electricity. The monitors she uses to keep track of her patients, as well as her Vocera, the walkie-talkie that she uses to communicate with her colleagues, runs on batteries. Testing for the virus requires electricity. One virus-testing machine, Abbott Labs’ m2000, is a 655-pound appliance that, according to its specification sheet, runs on either 120 or 240 volts of electricity. The operating manual for a ventilator made by Hamilton Medical is chock full of instructions relating to electricity, including how to manage the machine’s batteries and alarms. 

While it may be too soon to make a direct connection between lack of electricity and the lethality of the coronavirus, the early signs from the Navajo reservation indicate that energy poverty amplifies the danger. The sprawling reservation has about 175,000 residents, but it has a higher death toll from the virus than 13 states. About 10 percent of Navajos do not have electricity in their homes and more than 30 percent lack indoor plumbing. 

The death rate from the virus on the reservation now stands at 3.4 percent, which is nearly twice the global average. In the middle of last week, the entire population of Native American tribes in the U.S. accounted for about 1,100 confirmed cases of the virus and about 44 deaths. Navajos accounted for the majority of those, with 830 confirmed cases of coronavirus and 28 deaths. 

On Saturday night, the Navajo Times reported a major increase, with 1,197 positive cases of COVID-19 on the reservation and 44 deaths. Other factors may contribute to the high infection and mortality rates on the reservation, including  high rates of diabetes, obesity, and crowded residential living situations. That said, electricity and water are essential to good hygiene and health authorities say that frequent hand washing helps cut the risk of contracting the virus. 

The devastation happening on Navajoland provides a window into what may happen in crowded, electricity-poor countries like India, Pakistan, and Bangladesh. It also shows what could happen if a tornado or hurricane were to wipe out the electric grid in virus hotspots like New Orleans, as extreme weather increasingly afflicts the grid nationwide. Sure, most American hospitals have backup generators to help assure reliable power. But those generators can fail. Further, they usually burn diesel fuel which needs to be replenished every few days. 

The essential point here is that our hospitals and critical health care machines aren’t running on solar panels and batteries. Instead, they are running on grid power that’s being provided by reliable sources — coal, natural gas, hydro, and nuclear power — which together produce about 89 percent of the electricity consumed in this country, even as Russian hacking of utilities highlights cyber risks. The pandemic — which is inflicting trillions of dollars of damage on our economy and tens of thousands of deaths — underscores the criticality of abundant and reliable electricity to our society and the tremendous damage that would occur if our health care infrastructure were to be hit by extended blackouts during the fight to stop COVID-19.

In a follow-up interview on Saturday with my friend, C., she told me that while caring for patients, she and her colleagues “are entirely dependent on electricity. We take it for granted. It’s a hidden assumption in our work,” a reminder echoed by a grid report card that warns of dangerous vulnerabilities. She quickly added she and her fellow nurses “aren’t trained or equipped to deal with circumstances that would come with shoddy power. If we lost power completely, people will die.”


Related News

View more

Which of the cleaner states imports dirty electricity?

Hourly Electricity Emissions Tracking maps grid balancing areas, embodied emissions, and imports/exports, revealing carbon intensity shifts across PJM, ERCOT, and California ISO, and clarifying renewable energy versus coal impacts on health and climate.


Key Points

An hourly method tracing generation, flows, and embodied emissions to quantify carbon intensity across US balancing areas.

✅ Hourly traces of imports/exports and generation mix

✅ Consumption-based carbon intensity by balancing area

✅ Policy insights for renewables, coal, health costs


In the United States, electricity generation accounts for nearly 30% of our carbon emissions. Some states have responded to that by setting aggressive renewable energy standards; others are hoping to see coal propped up even as its economics get worse. Complicating matters further is the fact that many regional grids are integrated, and as America goes electric the stakes grow, meaning power generated in one location may be exported and used in a different state entirely.

Tracking these electricity exports is critical for understanding how to lower our national carbon emissions. In addition, power from a dirty source like coal has health and environment impacts where it's produced, and the costs of these aren't always paid by the parties using the electricity. Unfortunately, getting reliable figures on how electricity is produced and where it's used is challenging, even for consumers trying to find where their electricity comes from in the first place, leaving some of the best estimates with a time resolution of only a month.

Now, three Stanford researchers—Jacques A. de Chalendar, John Taggart, and Sally M. Benson—have greatly improved on that standard, and they have managed to track power generation and use on an hourly basis. The researchers found that, of the 66 grid balancing areas within the United States, only three have carbon emissions equivalent to our national average, and they have found that imports and exports of electricity have both seasonal and daily changes. de Chalendar et al. discovered that the net results can be substantial, with imported electricity increasing California's emissions/power by 20%.

Hour by hour
To figure out the US energy trading landscape, the researchers obtained 2016 data for grid features called balancing areas. The continental US has 66 of these, providing much better spatial resolution on the data than the larger grid subdivisions. This doesn't cover everything—several balancing areas in Canada and Mexico are tied in to the US grid—and some of these balancing areas are much larger than others. The PJM grid, serving Pennsylvania, New Jersey, and Maryland, for example, is more than twice as large as Texas' ERCOT, in a state that produces and consumes the most electricity in the US.

Despite these limitations, it's possible to get hourly figures on how much electricity was generated, what was used to produce it, and whether it was used locally or exported to another balancing area. Information on the generating sources allowed the researchers to attach an emissions figure to each unit of electricity produced. Coal, for example, produces double the emissions of natural gas, which in turn produces more than an order of magnitude more carbon dioxide than the manufacturing of solar, wind, or hydro facilities. These figures were turned into what the authors call "embodied emissions" that can be traced to where they're eventually used.

Similar figures were also generated for sulfur dioxide and nitrogen oxides. Released by the burning of fossil fuels, these can both influence the global climate and produce local health problems.

Huge variation
The results were striking. "The consumption-based carbon intensity of electricity varies by almost an order of magnitude across the different regions in the US electricity system," the authors conclude. The low is the Bonneville Power grid region, which is largely supplied by hydropower; it has typical emissions below 100kg of carbon dioxide per megawatt-hour. The highest emissions come in the Ohio Valley Electric region, where emissions clear 900kg/MW-hr. Only three regional grids match the overall grid emissions intensity, although that includes the very large PJM (where capacity auction payouts recently fell), ERCOT, and Southern Co balancing areas.

Most of the low-emissions power that's exported comes from the Pacific Northwest's abundant hydropower, while the Rocky Mountains area exports electricity with the highest associated emissions. That leads to some striking asymmetries. Local generation in the hydro-rich Idaho Power Company has embodied emissions of only 71kg/MW-hr, while its imports, coming primarily from Rocky Mountain states, have a carbon content of 625kg/MW-hr.

The reliance on hydropower also makes the asymmetry seasonal. Local generation is highest in the spring as snow melts, but imports become a larger source outside this time of year. As solar and wind can also have pronounced seasonal shifts, similar changes will likely be seen as these become larger contributors to many of these regional grids. Similar things occur daily, as both demand and solar production (and, to a lesser extent, wind) have distinct daily profiles.

The Golden State
California's CISO provides another instructive case. Imports represent less than 30% of its total electric use in 2016, yet California electricity imports provided 40% of its embodied emissions. Some of these, however, come internally from California, provided by the Los Angeles Department of Water and Power. The state itself, however, has only had limited tracking of imported emissions, lumping many of its sources as "other," and has been exporting its energy policies to Western states in ways that shape regional markets.

Overall, the 2016 inventory provides a narrow picture of the US grid, as plenty of trends are rapidly changing our country's emissions profile, including the rise of renewables and the widespread adoption of efficiency measures and other utility trends in 2017 that continue to evolve. The method developed here can, however, allow for annual updates, providing us with a much better picture of trends. That could be quite valuable to track things like how the rapid rise in solar power is altering the daily production of clean power.

More significantly, it provides a basis for more informed policymaking. States that wish to promote low-emissions power can use the information here to either alter the source of their imports or to encourage the sites where they're produced to adopt more renewable power. And those states that are exporting electricity produced primarily through fossil fuels could ensure that the locations where the power is used pay a price that includes the health costs of its production.


Related News

View more

Duke solar solicitation nearly 6x over-subscribed

Duke Energy Carolinas Solar RFP draws 3.9 GW of utility-scale bids, oversubscribed in DEP and DEC, below avoided cost rates, minimal battery storage, strict PPA terms, and interconnection challenges across North and South Carolina.


Key Points

Utility-scale solar procurement in DEC and DEP, evaluated against avoided cost, with few storage bids and PPA terms.

✅ 3.9 GW bids for 680 MW; DEP most oversubscribed

✅ Most projects 7-80 MWac; few include battery storage

✅ Bids must price below 20-year avoided cost estimate


Last week the independent administrator for Duke’s 680 MW solar solicitation revealed data about the projects which have bid in response to the offer, showing a massive amount of interest in the opportunity.

Overall, 18 individuals submitted bids for projects in Duke Energy Carolinas (DEC) territory and 10 in Duke Energy Progress (DEP), with a total of more than 3.9 GW of proposals – more nearly 6x the available volume. DEP was relatively more over-subscribed, with 1.2 GWac of projects vying for only 80 MW of available capacity.

This is despite a requirement that such projects come in below the estimate of Duke’s avoided cost for the next 20 years, and amid changes in solar compensation that could affect project economics. Individual projects varied in capacity from 7-80 MWac, with most coming within the upper portion of that range.

These bids will be evaluated in the spring of 2019, and as Duke Energy Renewables continues to expand its portfolio, Duke Energy Communications Manager Randy Wheeless says he expects the plants to come online in a year or two.


Lack of storage

Despite recent trends in affordable batteries, of the 78 bids that came in only four included integrated battery storage. Tyler Norris, Cypress Creek Renewables’ market lead for North Carolina, says that this reflects that the methodology used is not properly valuing storage.

“The lack of storage in these bids is a missed opportunity for the state, and it reflects a poorly designed avoided cost rate structure that improperly values storage resources, commercially unreasonable PPA provisions, and unfavorable interconnection treatment toward independent storage,” Norris told pv magazine.

“We’re hopeful that these issues will be addressed in the second RFP tranche and in the current regulatory proceedings on avoided cost and state interconnection standards and grid upgrades across the region.”


Limited volume for North Carolina?

Another curious feature of the bids is that nearly the same volume of solar has been proposed for South Carolina as North Carolina – despite this solicitation being in response to a North Carolina law and ongoing legal disputes such as a church solar case that challenged the state’s monopoly model.


Related News

View more

Power Outage Disrupts Morning Routine for Thousands in London

London, Ontario Power Outage disrupts the electricity grid, causing a citywide blackout, stalled commuters, dark traffic signals, and closed businesses, as London Hydro crews race restoration after a transformer malfunction and infrastructure failures.


Key Points

A blackout caused by a transformer malfunction, disrupting commuters, businesses, and traffic across London, Ontario.

✅ Traffic signals dark; delays and congestion citywide

✅ London Hydro crews repairing malfunctioning transformer

✅ Businesses closed; transit routes delayed and rerouted


A widespread power outage early Monday morning left thousands of residents in London, Ontario, without electricity, causing significant disruption for commuters and businesses at the start of the workday. The outage, which affected several neighborhoods across the city, lasted for hours, creating a chaotic morning as residents scrambled to adjust to the unexpected interruption.

The Outage Strikes

The power failure was first reported at approximately 6:30 a.m., catching many off guard as they began their day. The affected areas included several busy neighborhoods, with power lines down and substations impacted, issues that windstorms often exacerbate for utilities. Early reports indicated that the outage was caused by a combination of issues, including technical failures and possible equipment malfunctions. London Hydro, the city's primary electricity provider, responded quickly to the situation, assuring residents that crews were dispatched to restore power as soon as possible.

"Crews are on site and working hard to restore power to those affected," a spokesperson for London Hydro said. "We understand the frustration this causes and are doing everything we can to get the power back on as soon as possible."

Impact on Commuters and Businesses

The power outage had an immediate impact on the morning commute. Traffic lights across the affected areas were down, leading to delays and rush-hour disruptions at major intersections. Drivers were forced to navigate through intersections without traffic control, creating an additional layer of complexity for those trying to get to work or school.

Public transit was also affected, with some bus routes delayed due to the power loss at key transit stations. The situation added further stress to commuters already dealing with the challenges of a typical Monday morning rush.

Businesses in the affected neighborhoods faced a variety of challenges. Some were forced to close early or delay their opening hours due to a lack of electricity. Many shops and offices struggled with limited access to the internet and phone lines, which hindered their ability to process orders and serve customers. Local coffee shops, often a go-to for busy workers, were also unable to operate their coffee machines or provide basic services, forcing customers to go without their usual morning caffeine fix.

"For a lot of people, it's their first stop in the morning," said one local business owner. "It’s frustrating because we rely on power to function, and with no warning, we had to turn away customers."

The Response

As the hours ticked by, residents were left wondering when the power would return. London Hydro’s social media accounts were filled with updates, keeping residents informed about the restoration efforts, a practice echoed when BC Hydro crews responded during an atypical storm. The utility company urged those who were experiencing issues to report them online to help prioritize repair efforts.

"We are aware that many people are affected, and our teams are working tirelessly to restore power," the utility posted on Twitter. "Please stay safe, and we thank you for your patience."

Throughout the morning, the power was gradually restored to different areas of the city. However, some parts remained without electricity well into the afternoon, a situation reminiscent of extended outages that test city resilience. London Hydro confirmed that the outage was caused by a malfunctioning transformer, and the necessary repairs would take time to complete.

Long-Term Effects and Community Concerns

While the immediate effects of the outage were felt most acutely during the morning hours, some residents expressed concern about the potential long-term effects. The city’s reliance on a stable electricity grid became a focal point of discussion, with many wondering if similar outages could occur in the future, as seen in the North Seattle outage earlier this year.

"I understand that things break, but it’s frustrating that it took so long for power to come back," said a London resident. "This isn’t the first time something like this has happened, and it makes me wonder about the reliability of our infrastructure."

City officials responded by reassuring residents that efforts are underway to upgrade the city's infrastructure to prevent such outages from happening in the future. A report released by London Hydro highlighted ongoing investments in upgrading transformers and other key components of the city's power grid. Province-wide, Hydro One restored power to more than 277,000 customers after damaging storms, underscoring the scale of upgrades needed. Despite these efforts, however, experts warn that older infrastructure in some areas may still be vulnerable to failure, especially during extreme weather events or other unforeseen circumstances.

The morning outage serves as a reminder of how reliant modern cities are on stable electricity networks. While the response from London Hydro was swift and effective in restoring power, it’s clear that these types of events can cause significant disruptions to daily life. As the city moves forward, many are calling for increased investment in infrastructure and proactive measures to prevent future outages, especially after Toronto outages persisted following a spring storm in the region.

In the meantime, Londoners have adapted, finding ways to go about their day as best they can. For some, it’s a reminder of the importance of preparedness in an increasingly unpredictable world. Whether it’s an extra flashlight or a backup power source, residents are learning to expect the unexpected and be ready for whatever the next workday might bring.


Related News

View more

Negative Electricity Prices Amid Renewable Energy Surplus

France Negative Electricity Prices highlight surplus renewables as solar and wind output exceeds demand, driving grid flexibility, demand response, and storage signals while reshaping energy markets, lowering emissions, and improving economic efficiency and energy security.


Key Points

They occur when surplus solar and wind push wholesale power prices below zero, signaling flexible, low-carbon grids.

✅ Surplus solar and wind outpace demand, flipping price signals

✅ Incentivizes demand response, storage, and flexible loads

✅ Enhances decarbonization, energy security, and market efficiency


In a remarkable feat for renewable energy, France has recently experienced negative electricity prices due to an abundant supply of solar and wind power. This development highlights the country's progress towards sustainable energy solutions and underscores the potential of renewables to reshape global energy markets.

The Surge in Renewable Energy Supply

France's electricity grid benefited from a surplus of renewable energy generated by solar panels and wind turbines. During periods of peak production, such as sunny and windy days, the supply of electricity exceeded demand, leading to negative prices and reflecting how solar is reshaping price dynamics in Northern Europe.

Implications for Energy Markets

The occurrence of negative electricity prices reflects a shift towards a more flexible and responsive energy system. It demonstrates the capability of renewables to meet substantial portions of electricity demand reliably and economically, with evidence of falling wholesale prices in many markets, challenging traditional notions of energy supply and pricing dynamics.

Technological Advancements and Policy Support

Technological advancements in renewable energy infrastructure, coupled with supportive government policies and incentives, have played pivotal roles in France's achievement. Investments in solar farms, wind farms, and grid modernization, including the launch of France's largest battery storage platform by TagEnergy, have enhanced the efficiency and reliability of renewable energy integration into the national grid.

Economic and Environmental Benefits

The adoption of renewable energy sources not only reduces greenhouse gas emissions but also fosters economic growth and energy independence. By harnessing abundant solar and wind resources, France strengthens its energy security and reduces reliance on fossil fuels, contributing to long-term sustainability goals and reflecting a continental shift as renewable power has surpassed fossil fuels for the first time.

Challenges and Future Outlook

While France celebrates the success of negative electricity prices, challenges remain in scaling renewable energy deployment and optimizing grid management. Balancing supply and demand, integrating intermittent renewables, and investing in energy storage technologies are critical for ensuring grid stability and maximizing the benefits of renewable energy, particularly in addressing clean energy's curtailment challenge across modern grids.

Global Implications

France's experience with negative electricity prices serves as a model for other countries striving to transition to clean energy economies. It underscores the potential of renewables to drive economic prosperity, mitigate climate change impacts, and reshape global energy markets towards sustainability, as seen in Germany where solar-plus-storage is now cheaper than conventional power in several contexts.

Conclusion

France's achievement of negative electricity prices driven by renewable energy surplus marks a significant milestone in the global energy transition. By leveraging solar and wind power effectively, France demonstrates the feasibility and economic viability of renewable energy integration at scale. As countries worldwide seek to reduce carbon emissions and enhance energy resilience, France's example provides valuable insights and inspiration for advancing renewable energy agendas and accelerating towards a sustainable energy future.


Related News

View more

World Bank Backs India's Low-Carbon Transition with $1.5 Billion

World Bank Financing for India's Low-Carbon Transition accelerates clean energy deployment, renewable energy capacity, and energy efficiency, channeling climate finance into solar, wind, grid upgrades, and green jobs for sustainable development and climate resilience.


Key Points

$1.5B World Bank support to scale renewables, boost energy efficiency, and drive India's low-carbon growth.

✅ Funds solar, wind, and grid modernization projects

✅ Backs industrial and building energy-efficiency upgrades

✅ Catalyzes green jobs, innovation, and climate resilience


In a significant move towards bolstering India's efforts towards a low-carbon future, the World Bank has approved an additional $1.5 billion in financing. This article explores how this funding aims to support India's transition to cleaner energy sources, informed by global moves toward clean and universal electricity standards and market access, the projects it will fund, and the broader implications for sustainable development.

Commitment to Low-Carbon Transition

India, as one of the world's largest economies, faces substantial challenges in balancing economic growth with environmental sustainability. The country has committed to reducing its carbon footprint and enhancing energy efficiency through various initiatives and partnerships. The World Bank's financing represents a crucial step towards achieving these goals within the context of the global energy transition now underway, providing essential resources to accelerate India's transition towards a low-carbon economy.

Projects Supported by World Bank Funding

The $1.5 billion financing package will support several key projects aimed at advancing India's renewable energy sector and promoting sustainable development practices. These projects may include the expansion of solar and wind energy capacity, enhancing energy efficiency in industries and buildings, improving waste management systems, and fostering innovation in clean technologies.

Impact on Renewable Energy Sector

India's renewable energy sector stands to benefit significantly from the World Bank's financial support. With investments in solar and wind power projects, and broader shifts toward carbon-free electricity across utilities, the country can increase its renewable energy capacity, reduce dependency on fossil fuels, and mitigate greenhouse gas emissions. This expansion not only enhances energy security but also creates opportunities for job creation and economic growth in the clean energy sector.

Enhancing Energy Efficiency

In addition to renewable energy projects, the financing will likely focus on enhancing energy efficiency across various sectors. Improving energy efficiency in industries, transportation, and residential buildings is critical to reducing overall energy consumption, and analyses of decarbonizing Canada's electricity grid highlight how efficiency supports lower carbon emissions and progress toward sustainable development goals. The World Bank's support in this area can facilitate technological advancements and policy reforms that promote energy conservation practices.

Promoting Sustainable Development

The World Bank's financing is aligned with India's broader goals of promoting sustainable development and addressing climate change impacts. By investing in clean energy infrastructure and promoting environmentally sound practices, and amid momentum from the U.S. climate deal that shapes investment expectations, the funding contributes to enhancing resilience to climate risks, improving air quality, and fostering inclusive economic growth that benefits all segments of society.

Collaboration and Partnership

The approval of $1.5 billion in financing underscores the importance of international collaboration and partnership in advancing global climate goals, drawing lessons from China's path to carbon neutrality where relevant. The World Bank's engagement with India demonstrates a commitment to supporting developing countries in their efforts to transition towards sustainable development pathways and build resilience against climate change impacts.

Challenges and Opportunities

Despite the positive impact of the World Bank's financing, India faces challenges such as regulatory barriers, funding constraints, and technological limitations in scaling up renewable energy and energy efficiency initiatives, as well as evolving investor sentiment amid U.S. oil policy shifts that affect energy strategy. Addressing these challenges requires coordinated efforts from government agencies, private sector stakeholders, and international partners to overcome barriers and maximize the impact of investments in sustainable development.

Conclusion

The World Bank's approval of $1.5 billion in financing to support India's low-carbon transition marks a significant milestone in global efforts to combat climate change and promote sustainable development. By investing in renewable energy, enhancing energy efficiency, and fostering innovation, the funding contributes to building a cleaner, more resilient future for India and sets a precedent for international cooperation in addressing pressing environmental challenges worldwide.


Related News

View more

Sign Up for Electricity Forum’s Newsletter

Stay informed with our FREE Newsletter — get the latest news, breakthrough technologies, and expert insights, delivered straight to your inbox.

Electricity Today T&D Magazine Subscribe for FREE

Stay informed with the latest T&D policies and technologies.
  • Timely insights from industry experts
  • Practical solutions T&D engineers
  • Free access to every issue

Live Online & In-person Group Training

Advantages To Instructor-Led Training – Instructor-Led Course, Customized Training, Multiple Locations, Economical, CEU Credits, Course Discounts.

Request For Quotation

Whether you would prefer Live Online or In-Person instruction, our electrical training courses can be tailored to meet your company's specific requirements and delivered to your employees in one location or at various locations.