UK Wind and Tidal Power Auction signals strong CfD support for offshore wind, tidal stream projects, investor certainty, and clean electricity, accelerating the net-zero transition, boosting jobs, and strengthening UK energy security and grid integration.
Key Points
A CfD auction awarding contracts for wind and tidal projects to scale clean power and advance UK net-zero.
✅ Offshore wind dominates CfD awards
✅ Tidal stream gains predictable, reliable capacity
✅ Jobs, investment, and grid integration accelerate
In a significant development for the UK’s renewable energy sector, the latest auction for renewable energy contracts has underscored a transformative shift towards wind and tidal power. As reported by The Guardian, the auction results reveal a strong commitment to expanding these technologies, with new contracts adding 10 GW to the UK grid, marking a pivotal moment in the UK’s transition to cleaner energy sources.
The Auction’s Impact
The renewable energy auction, which took place recently, has allocated contracts for a substantial increase in wind and tidal power projects. This auction, part of the UK’s Contracts for Difference (CfD) scheme, is designed to support the development of low-carbon energy technologies by providing financial certainty to investors. By offering fixed prices for the electricity generated by these projects, the CfD scheme aims to stimulate investment and accelerate the deployment of renewable energy sources.
The latest results are particularly notable for the significant share of contracts awarded to offshore wind farms and tidal power projects, highlighting how offshore wind is powering up the UK as policy and investment priorities continue to shift. This marks a shift from previous auctions, where solar power and onshore wind were the dominant technologies. The move towards supporting offshore wind and tidal power reflects the UK’s strategic focus on harnessing its abundant natural resources to drive the transition to a low-carbon energy system.
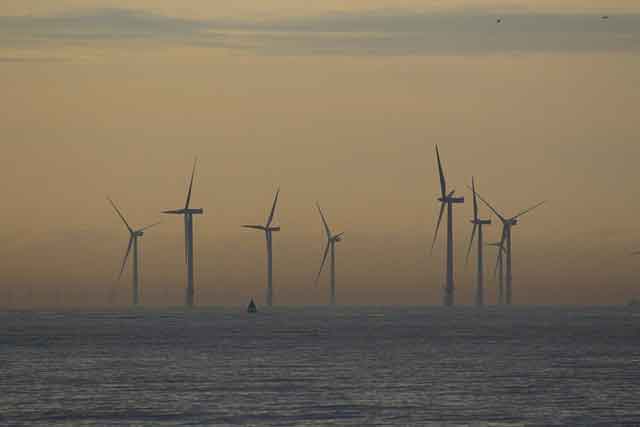
Offshore Wind Power: A Major Contributor
Offshore wind power has emerged as a major player in the UK’s renewable energy landscape, within a global market projected to become a $1 trillion business over the coming decades. The recent auction results highlight the continued growth and investment in this sector.
The UK has been a global leader in offshore wind development, with several large-scale projects already operational and more in the pipeline. The auction has further cemented this position, underscoring what the U.S. can learn from the U.K. in scaling offshore wind capacity, with new projects set to contribute significantly to the country’s renewable energy capacity. These projects are expected to deliver substantial amounts of clean electricity, supporting the UK’s goal of achieving net-zero emissions by 2050.
Tidal Power: An Emerging Frontier
Tidal power, although less developed compared to wind and solar, is gaining momentum as a promising renewable energy source, with companies harnessing oceans and rivers to demonstrate practical potential. The auction results have allocated contracts to several tidal power projects, signaling growing recognition of the potential of this technology.
Tidal power harnesses the energy from tidal movements and currents, which are highly predictable and consistent, and a market outlook for wave and tidal energy points to emerging growth drivers and investment. This makes it a reliable complement to intermittent sources like wind and solar power. The inclusion of tidal power projects in the auction reflects the UK’s commitment to diversifying its renewable energy portfolio and exploring all available options for achieving energy security and sustainability.
Economic and Environmental Benefits
The expansion of wind and tidal power projects through the recent auction offers numerous economic and environmental benefits. From an economic perspective, these projects are expected to create thousands of jobs in construction, maintenance, and manufacturing. They also stimulate investment in local economies and support the growth of the green technology sector.
Environmentally, the increased deployment of wind and tidal power contributes to significant reductions in greenhouse gas emissions. Offshore wind farms and tidal power projects produce clean electricity with minimal environmental impact, helping to mitigate the effects of climate change and improve air quality.
Challenges and Future Outlook
Despite the positive outcomes of the auction, there are challenges to address. Offshore wind farms and tidal power projects require substantial upfront investment and face technical and logistical challenges. Issues such as grid integration, environmental impact assessments, and supply chain constraints need to be carefully managed to ensure the successful deployment of these projects.
Looking ahead, the UK’s renewable energy strategy will continue to evolve as new technologies and innovations emerge, and growth despite Covid-19 underscores sector resilience. The success of the latest auction demonstrates the growing confidence in wind and tidal power and sets the stage for further advancements in renewable energy.
The UK government’s commitment to supporting these technologies through initiatives like the CfD scheme is crucial for achieving long-term energy and climate goals. As the country progresses towards its net-zero target, the continued expansion of wind and tidal power will play a key role in shaping a sustainable and resilient energy future.
Conclusion
The latest renewable energy auction represents a significant milestone in the UK’s transition to a low-carbon energy system. By awarding contracts to wind and tidal power projects, the auction underscores the country’s commitment to harnessing diverse and reliable sources of renewable energy. The expansion of offshore wind and the emerging role of tidal power highlight the UK’s strategic approach to achieving energy security, reducing emissions, and driving economic growth. As the renewable energy sector continues to evolve, the UK remains at the forefront of global efforts to build a sustainable and clean energy future.
Related News