COP24 Climate Talks in Poland gather nearly 200 nations to finalize the Paris Agreement rulebook, advance the Talanoa Dialogue, strengthen emissions reporting and transparency, and align finance, technology transfer, and IPCC science for urgent mitigation.
Key Points
UNFCCC summit in Katowice to finalize Paris rules, enhance transparency, and drive stronger emissions cuts.
✅ Paris rulebook on reporting, transparency, markets, and timelines
✅ Talanoa Dialogue to assess gaps and raise ambition by 2020
✅ Finance and tech transfer for developing countries under UNFCCC
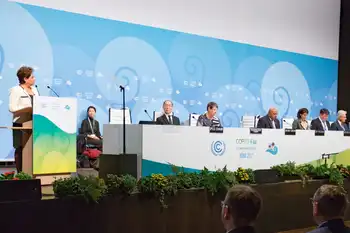
Delegates from nearly 200 countries have assembled this month in Katowice, Poland — the heart of coal country — to try to move the ball forward on battling climate change.
It’s now the 24th annual meeting, or “COP” — conference of the parties — under the landmark U.N. Framework Convention on Climate Change, which the United States signed under then-President George H.W. Bush in 1992. More significantly, it’s the third such meeting since nations adopted the Paris climate agreement in 2015, widely seen at the time as a landmark moment in which, at last, developed and developing countries would share a path toward cutting greenhouse gas emissions, as Obama's clean energy push sought to lock in momentum.
But the surge of optimism that came with Paris has faded lately. The United States, the second largest greenhouse gas emitter, said it would withdraw from the agreement, though it has not formally done so yet. Many other countries are off target when it comes to meeting their initial round of Paris promises — promises that are widely acknowledged to be too weak to begin with. And emissions have begun to rise after a brief hiatus that had lent some hope of progress.
The latest science, meanwhile, is pointing toward increasingly dire outcomes. The amount of global warming that the world already has seen — 1 degree Celsius, 1.8 degrees Fahrenheit — has upended the Arctic, is killing coral reefs and may have begun to destabilize a massive part of Antarctica. A new report from the U.N.'s Intergovernmental Panel on Climate Change (IPCC), requested by the countries that assembled in Paris to be timed for this year’s meeting, finds a variety of increasingly severe effects as soon as a rise of 1.5 degrees Celsius arrives — an outcome that can’t be avoided without emissions cuts so steep that they would require societal transformations without any known historical parallel, the panel found.
It’s in this context that countries are meeting in Poland, with expectations and stakes high.
So what’s on the agenda in Poland?
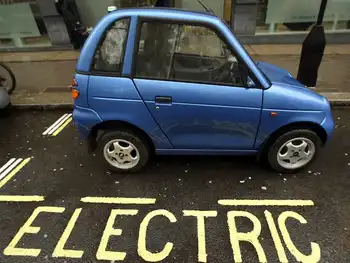
The answer starts with the Paris agreement, which was negotiated three years ago, has been signed by 197 countries and is a mere 27 pages long. It covers a lot, laying out a huge new regime not only for the world as a whole to cut its greenhouse gas emissions, but for each individual country to regularly make new emissions-cutting pledges, strengthen them over time, report emissions to the rest of the world and much more. It also addresses financial obligations that developed countries have to developing countries, including how to achieve clean and universal electricity at scale, and how technologies will be transferred to help that.
But those 27 pages leave open to interpretation many fine points for how it will all work. So in Poland, countries are performing a detailed annotation of the Paris agreement, drafting a “rule book” that will span hundreds of pages.
That may sound bureaucratic, but it’s key to addressing many of the flash points. For instance, it will be hard for countries to trust that their fellow nations are cutting emissions without clear standards for reporting and vetting. Not everybody is ready to accept a process like the one followed in the United States, which not only publishes its emissions totals but also has an independent review of the findings.
“A number of the developing countries are resisting that kind of model for themselves. They see it as an intrusion on their sovereignty,” said Alden Meyer, director of strategy and policy at the Union of Concerned Scientists and one of the many participants in Poland this week. “That’s going to be a pretty tough issue at the end of the day.”
It’s hardly the only one. Also unclear is what countries will do after the time frames on their current emissions-cutting promises are up, which for many is 2025 or 2030. Will all countries then start reporting newer and more ambitious promises every five years? Every 10 years?
That really matters when five years of greenhouse gas emissions — currently about 40 billion tons of carbon dioxide annually — are capable of directly affecting the planet’s temperature.
What can we expect each day?
The conference is in its second week, when higher-level players — basically, the equivalent of cabinet-level leaders in the United States — are in Katowice to advance the negotiations.
As this happens, several big events are on the agenda. On Tuesday and Wednesday is the “Talanoa Dialogue,” which will bring together world leaders in a series of group meetings to discuss these key questions: “Where are we? Where do we want to go? How do we get there?”
Friday is the last day of the conference, but pros know these events tend to run long. On Friday — or after — we will be waiting for an overall statement or decision from the meeting which may signal how much has been achieved.
What is the “Talanoa Dialogue”?
“Talanoa” is a word used in Fiji and in many other Pacific islands to refer to “the sharing of ideas, skills and experience through storytelling.” This is the process that organizers settled on to fulfill a plan formed in Paris in 2015.
That year, along with signing the Paris agreement, nations released a decision that in 2018 there should be a “facilitative dialogue" among the countries “to take stock” of where their efforts stood to reduce greenhouse gas emissions. This was important because going into that Paris meeting, it was already clear that countries' promises were not strong enough to hold global warming below a rise of 2 degrees Celsius (3.6 degrees Fahrenheit) above preindustrial temperatures.
This dialogue, in the Talanoa process, was meant to prompt reflection and maybe even soul searching about what more would have to be done. Throughout the year, “inputs” to the Talanoa dialogue — most prominently, the recent report by the United Nations' Intergovernmental Panel on Climate Change on the meaning and consequences of 1.5 degrees Celsius of warming —have been compiled and synthesized. Now, over two days in Poland, countries' ministers will assemble to share stories in small groups about what is working and what is not and to assess where the world as a whole is on achieving the required greenhouse gas emissions reductions.
What remains to be seen is whether this process will culminate in any kind of product or statement that calls clearly for immediate, strong ramping up of climate change promises across the world.
With the clock ticking, will countries do anything to increase their ambition at this meeting?
If negotiating the Paris rule book sounds disappointingly technical, well, you’re not the only one feeling that way. Pressure is mounting for countries to accomplish something more than that in Poland — to at minimum give a strong signal that they understand that the science is looking worse and worse, and the world’s progress on the global energy transition isn’t matching that outlook.
“The bigger issue is how we’re going to get to an outcome on greater ambition,” said Lou Leonard, senior vice president for climate and energy at the World Wildlife Fund, who is in Poland observing the talks. “And I think the first week was not kind on moving that part of the agenda forward.”
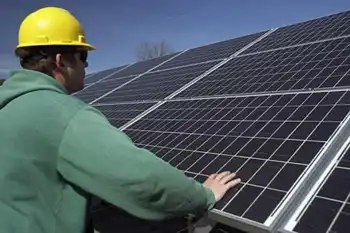
Most countries are not likely to make new emissions-cutting promises this week. But there are two ways that the meeting could give a strong statement that countries should — or will — come up with new promises at least by 2020. That’s when extremely dramatic emissions cuts would have to start, including progress toward net-zero electricity by mid-century, according to the recent report on 1.5 degrees Celsius of warming.
The first is the aforementioned “Talanoa dialogue” (see above). It’s possible that the outcome of the dialogue could be a statement acknowledging that the world isn’t nearly far enough along and calling for much stronger steps.
There will also be a decision text released for the meeting as a whole, which could potentially send a signal. Leonard said he hopes that would include details for the next steps that will put the world on a better course.
“We have to create milestones, and the politics around it that will pressure countries to do something that quite frankly they don’t want to do,” he said. “It’s not going to be easy. That’s why we need a process that will help make it happen. And make the most of the IPCC report that was designed to come out right now so it could do this for us. That’s why we have it, and it needs to serve that role.”
The United States says it will withdraw from the agreement, so what role is it playing in Poland?
Despite President Trump’s pledge to withdraw, the United States remains in the Paris agreement (for now) and has sent a delegation of 44 people to Poland, largely from the State Department but also from the Environmental Protection Agency, Energy Department and even the White House, while domestically a historic U.S. climate law has recently passed to accelerate clean energy. Many of these career government officials remain deeply engaged in hashing out details of the agreement.
Still, the country as a whole is being cast in an antagonistic role in the talks.
Related News