Electricity prices rise more than double EU average in first half of 2021
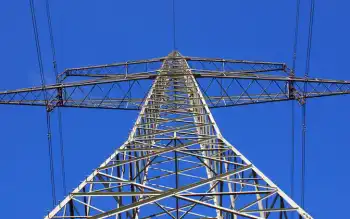

power lines

Arc Flash Training - CSA Z462 Electrical Safety

Our customized live online or in‑person group training can be delivered to your staff at your location.

  • Live Online
  • 6 hours Instructor-led
  • Group Training Available
Regular Price:
$249
Coupon Price:
$199
Reserve Your Seat Today

Estonia energy prices 2021 show sharp electricity hikes versus the EU average, mixed natural gas trends, kWh tariffs on Nord Pool spiking, and VAT, taxes, and support measures shaping household bills.


Key Points

EU-high electricity growth, early gas dip, then Nord Pool spikes; taxes, VAT, and subsidies shaped energy bills.

✅ Electricity up 7% on year; EU average 2.8% in H1 2021.

✅ Gas fell 1% in H1; later spiked with global market.

✅ VAT, taxes, excise and aid impacted household costs.


Estonia saw one of the highest rates in growth of electricity prices in the first half of 2021, compared with the same period in key trends in 2020 across Europe. These figures were posted before the more recent, record level of electricity and natural gas prices; the latter actually dropped slightly in Estonia in the first half of the year.

While electricity prices rose 7 percent on year in the first half of 2021 in Estonia, the average for the EU as a whole, where energy prices drove inflation across the bloc, stood at 2.8 percent over the same period, BNS reports.

Hungary (€10 per 100 Kwh) and Bulgaria (€10.20 per 100 Kwh) saw the lowest electricity prices EU-wide, while at €31.9 per KWH, Germany's power prices posted the most expensive rate, while Denmark, Belgium and Ireland also had high prices, in excess of €25 per Kwh.

Slovenia saw the highest electricity price rise, at 15 percent, and even the United States' electricity prices saw their steepest rise in decades during the same era, while Estonia was in third place, joint with Romania at 7 percent as noted, and behind Poland (8 percent).

Lithuania, on the other hand, experienced the third highest electricity price fall over the first half of 2021, compared with the same period in 2020, at 6 percent, behind only Cyprus (7 percent) and the Netherlands (10 percent, largely due to a tax cut).

Urmas Reinsalu: VAT on electricity, gas and heating needs to be lowered
The EU average price of electricity was €21.9 percent per Kwh, with taxes and excise accounting for 39 percent of this, even as prices in Spain surged across the day-ahead market.

Estonia has also seen severe electricity price rises in the second half of the year so far, with records set and then promptly broken several times earlier in October, while an Irish electricity provider raised prices amid similar pressures, and a support package for low income households rolled out for the winter season (October to March next year). The price on the Nord Pool market as of €95.01 per Kwh; a day earlier it had stood at €66.21 per Kwh, while on October 19 the price was €140.68 per Kwh.

Gas prices
Natural gas prices to household, meanwhile, dropped in Estonia over the same period, at a sharper rate (1 percent) than the EU average (0.5 percent), according to Eurostat.

Gas prices across the EU were lowest in Lithuania (€2.8 per 100 Kwh) and highest in the Netherlands (€9.6 per KWH), while the highest growth was seen in Denmark (19 percent), in the first half of 2021.

Natural gas prices dropped in 20 member states, however, with the largest drop again coming in Lithuania (23 percent).

The average price of natural gas EU-side in the first half of 2021 was €6.4, and taxes and excise duties accounted on average for 36 percent of the total.

The second half of the year has seen steep gas price rises in Estonia, largely the result of increases on the world market, though European gas benchmarks later fell to pre-Ukraine war levels.

Related News

Website Providing Electricity Purchase Options Offered Fewer Choices For Spanish-speakers

Texas PUC Spanish Power to Choose mandates bilingual parity in deregulated electricity markets, ensuring equal access to plans, transparent pricing, consumer protection, and provider listings for Spanish speakers, mirroring the English site offerings statewide.


Key Points

PUC mandate requiring identical Spanish and English plan listings for fair access in the deregulated power market.

✅ Orders parity across English and Spanish plan listings

✅ Increases transparency in a deregulated electricity market

✅ Deadline set for providers to post on both sites


The state’s Public Utility Commission has ordered that the Spanish-language version of the Power to Choose website provide the same options available on the English version of the site, a move that comes as shopping for electricity is getting cheaper statewide.

Texas is one of a handful of states with a deregulated electricity market, with ongoing market reforms under consideration to avoid blackouts. The idea is to give consumers the option to pick power plans that they think best fit their needs. Customers can find available plans on the state’s Power To Choose website, or its Spanish-language counterpart, Poder de Escoger. In theory, those two sites should have the exact same offerings, so no one is disadvantaged. But the Texas Public Utility Commission found that wasn’t the case.

Houston Chronicle business reporter Lynn Sixel has been covering this story. She says the Power to Choose website is important for consumers facing the difficult task of choosing an electric provider in a deregulated state, where electricity complaints have recently reached a three-year high for Texans.

“There are about 57 providers listed on the [English] Power to Choose website, and news about retailers like Griddy underscores how varied the offerings can be across providers. [Last week] there were only 23 plans on the Spanish Power to Choose site,” Sixel says. “If you speak Spanish and you’re looking for a low-cost plan, as of last week, it would have been difficult to find some of the really great offers.”

Mustafa Tameez, managing director of Outreach Strategists, a Houston firm that consults with companies and nonprofits on diversity, described this issue as a type of redlining.

“He’s referring to a practice that banks would use to circle areas on maps in which the bank decided they did not want to lend money or would charge higher rates,” Sixel says. “Typically it was poor minority neighborhoods. Those folks would not get the same great deals that their Anglo neighbors would get.”

DeAnn Walker, chairman of the Public Utility Commission, said she was not at all happy about the plans listings in a meeting Friday, against a backdrop where Texas utilities have recently backed out of a plan to create smart home electricity networks.

“She gave a deadline of 8 a.m. Monday morning for any providers who wanted to put their plans on the Power to Choose website, must put them on both the Spanish language and the English language versions,” Sixel says. “All the folks that I talked to really had no idea that there were different plans on both sites and I think that there was sort of an assumption.”


Related News

View more

EIA expects solar and wind to be larger sources of U.S. electricity generation this summer

US Summer Electricity Outlook 2022 projects rising renewable energy generation as utility-scale solar and wind capacity additions surge, while coal declines and natural gas shifts amid higher fuel prices and regional supply constraints.


Key Points

An EIA forecast of summer 2022 power: more solar and wind, less coal, and shifting gas use amid higher fuel prices.

✅ Solar +10 million MWh; wind +8 million MWh vs last summer

✅ Coal generation -20 million MWh amid supply constraints, retirements

✅ Gas prices near $9/MMBtu; slight national gen decline


In our Summer Electricity Outlook, a supplement to our May 2022 Short-Term Energy Outlook, we expect the largest increases in U.S. electric power sector generation this summer will come from renewable energy sources such as wind and solar generation. These increases are the result of new capacity additions. We forecast utility-scale solar generation between June and August 2022 will grow by 10 million megawatthours (MWh) compared with the same period last summer, and wind generation will grow by 8 million MWh. Forecast generation from coal and natural gas declines by 26 million MWh this summer, although natural gas generation could increase in some electricity markets where coal supplies are constrained.

For recent context, overall U.S. power generation in January rose 9.3% year over year, the EIA reports.

Wind and solar power electric-generating capacity has been growing steadily in recent years. By the start of June, we estimate the U.S. electric power sector will have 65 gigawatts (GW) of utility-scale solar-generating capacity, a 31% increase in solar capacity since June 2021. Almost one-third of this new solar capacity will be built in the Texas electricity market. The electric power sector will also have an estimated 138 GW of wind capacity online this June, which is a 12% increase from last June.

Along with growth in renewables capacity, we expect that an additional 6 GW of new natural gas combined-cycle generating capacity will come online by June 2022, an increase of 2% from last summer. Despite this increase in capacity, we expect natural gas-fired electricity generation at the national level will be slightly (1.3%) lower than last summer.

We forecast the price of natural gas delivered to electric generators will average nearly $9 per million British thermal units between June and August 2022, which would be more than double the average price last summer. The higher expected natural gas prices and growth in renewable generation will likely lead to less natural gas-fired generation in some regions of the country.

In contrast to renewables and natural gas, the electricity industry has been steadily retiring coal-fired power plants over the past decade. Between June 2021 and June 2022, the electric power sector will have retired 6 GW (2%) of U.S. coal-fired generating capacity.

In previous years, higher natural gas prices would have resulted in more coal-fired electricity generation across the fleet. However, coal-fired power plants have been limited in their ability to replenish their historically low inventories in recent months as a result of mine closures, rail capacity constraints, and labor market tightness. These coal supply constraints, along with continued retirement of generating capacity, contribute to our forecast that U.S. coal-fired generation will decline by 20 million MWh (7%) this summer. In some regions of the country, these coal supply constraints may lead to increased natural gas-fired electricity generation despite higher natural gas prices.


Related News

View more

Ottawa sets out to protect its hydro heritage

Ottawa Hydro Substation Heritage Designation highlights Hydro Ottawa's 1920s architecture, Art Deco facades, and municipal utility history, protecting key voltage-reduction sites in Glebe, Carling-Merivale, Holland, King Edward, and Old Ottawa South.


Key Points

A city plan to protect Hydro Ottawa's 1920s substations for architecture, utility role, and civic electrical heritage.

✅ Protects five operating voltage-reduction sites citywide

✅ Recognizes Art Deco and early 20th century utility architecture

✅ Allows emergency demolition to ensure grid safety


The city of Ottawa is looking to designate five hydro substations built nearly a century ago as heritage structures, a move intended to protect the architectural history of Ottawa's earliest forays into the electricity business, even as Ottawa electricity consumption has shifted in recent years.

All five buildings are still used by Hydro Ottawa to reduce the voltage coming from transmission lines before the electricity is transmitted to homes and businesses, and when severe weather causes outages, Sudbury Hydro crews work to reconnect service across communities.

Electricity came to Ottawa in 1882 when two carbon lamps were installed on LeBreton Flats, heritage planner Anne Fitzpatrick told the city's built heritage subcommittee on Tuesday. It became a lucrative business, and soon a privately owned monopoly that drew public scrutiny similar to debates over retroactive charges in neighboring jurisdictions.

In 1905, city council held a special meeting to buy the electrical company, which led to a dramatic drop in electricity rates for residents, a contrast with recent discussions about peak hydro rates for self-isolating customers.

The substations are now owned by Hydro Ottawa, which agreed to the heritage designations on the condition it not be prevented from emergency demolitions if it needs to address incidents such as damaging storms in Ontario while it works to "preserve public safety and the continuity of critical hydro electrical services."

Built in 1922, the substation at the intersection of Glebe and Bronson avenues was the first to be built by the new municipal electrical department, long before modern battery storage projects became commonplace on Ontario's grid.

The largest of the substations being protected dates back to 1929 and is found at the corner of Carling Avenue and Merivale Road. It was built to accommodate a growing population in areas west of downtown including Hintonburg and Mechanicsville.

The substation on Holland Avenue near the Queensway is different from the others because it was built in 1924 to serve the Ottawa Electric Railway Company. The streetcar company operated from 1891 to 1959, and urban electrical infrastructure can face failures such as the Hydro-Québec manhole fire that left thousands without power.

This substation on King Edward Avenue was built in 1931 and designed by architect William Beattie, who also designed York Street Public School in Lowertown and the substation on Carling Avenue. 

The last substation to be built in a 'bold and decorative style' is at 39 Riverdale Ave. in Old Ottawa South, according to city staff. It was designed in an Art Deco style by prominent architect J. Albert Ewart, who was also behind the Civic Hospital and nearby Southminster Church on Bank Street.


Related News

View more

Utilities see benefits in energy storage, even without mandates

Utility Battery Storage Rankings measure grid-connected capacity, not ownership, highlighting MW, MWh, and watts per customer across PJM, MISO, and California IOUs, featuring Duke Energy, IPL, ancillary services, and frequency regulation benefits.


Key Points

Rankings that track energy storage connected to utility grids, comparing MW, MWh, and W/customer rather than ownership.

✅ Ranks by MW, MWh, and watts per customer, not asset ownership

✅ Highlights PJM, MISO cases and California IOUs' deployments

✅ Examples: Duke Energy, IPL, IID; ancillary services, frequency response


The rankings do not tally how much energy storage a utility built or owns, but how much was connected to their system. So while IPL built and owns the storage facility in its territory, Duke does not own the 16 MW of storage that connected to its system in 2016. Similarly, while California’s utilities are permitted to own some energy storage assets, they do not necessarily own all the storage facilities connected to their systems.

Measured by energy (MWh), IPL ranked fourth with 20 MWh, and Duke Energy Ohio ranked eighth with 6.1 MWh.

Ranked by energy storage watts per customer, IPL and Duke actually beat the California utilities, ranking fifth and sixth with 42 W/customer and 23 W/customer, respectively.

Duke ready for next step

Given Duke’s plans, including projects in Florida that are moving ahead, the utility is likely to stay high in the rankings and be more of a driving force in development. “Battery technology has matured, and we are ready to take the next step,” Duke spokesman Randy Wheeless told Utility Dive. “We can go to regulators and say this makes economic sense.”

Duke began exploring energy storage in 2012, and until now most of its energy storage efforts were focused on commercial projects in competitive markets where it was possible to earn revenues. Those included its 36 MW Notrees battery storage project developed in partnership with the Department of Energy in 2012 that provides frequency regulation for the Electric Reliability Council of Texas market and two 2 MW storage projects at its retired W.C. Beckjord plant in New Richmond, Ohio, that sells ancillary services into the PJM Interconnection market.

On the regulated side, most of Duke’s storage projects have had “an R&D slant to them,” Wheeless said, but “we are moving beyond the R&D concept in our regulated territory and are looking at storage more as a regulated asset.”

“We have done the demos, and they have proved out,” Wheeless said. Storage may not be ready for prime time everywhere, he said, but in certain locations, especially where it can it can be used to do more than one thing, it can make sense.

Wheeless said Duke would be making “a number of energy storage announcements in the next few months in our regulated states.” He could not provide details on those projects.

More flexible resources
Location can be a determining factor when building a storage facility. For IPL, serving the wholesale market was a driving factor in the rationale to build its 20 MW, 20 MWh storage facility in Indianapolis.

IPL built the project to address a need for more flexible resources in light of “recent changes in our resource mix,” including decreasing coal-fired generation and increasing renewables and natural gas-fired generation, as other regions plan to rely on battery storage to meet rising demand, Joan Soller, IPL’s director of resource planning, told Utility Dive in an email. The storage facility is used to provide primary frequency response necessary for grid stability.

The Harding Street storage facility in May. It was the first energy storage project in the Midcontinent ISO. But the regulatory path in MISO is not as clear as it is in PJM, whereas initiatives such as Ontario storage framework are clarifying participation. In November, IPL with the Federal Energy Regulatory Commission, asking the regulator to find that MISO’s rules for energy storage are deficient and should be revised.

Soller said IPL has “no imminent plans to install energy storage in the future but will continue to monitor battery costs and capabilities as potential resources in future Integrated Resource Plans.”

California legislative and regulatory push

In California, energy storage did not have to wait for regulations to catch up with technology. With legislative and regulatory mandates, including CEC long-duration storage funding announced recently, as a push, California’s IOUs took high places in SEPA’s rankings.

Southern California Edison and San Diego Gas & Electric were first and fourth (63.2 MW and 17.2 MW), respectively, in terms of capacity. SoCal Ed and SDG&E were first and second (104 MWh and 28.4 MWh), respectively, and Pacific Gas and Electric was fifth (17 MWh) in terms of energy.

But a public power utility, the Imperial Irrigation District (IID), ended up high in the rankings – second in capacity (30 MW) and third  in energy (20 MWh) – even though as a public power entity it is not subject to the state’s energy storage mandates.

But while IID was not under state mandate, it had a compelling regulatory reason to build the storage project. It was part of a settlement reached with FERC over a September 2011 outage, IID spokeswoman Marion Champion said.

IID agreed to a $12 million fine as part of the settlement, of which $9 million was applied to physical improvements of IID’s system.

IID ended up building a 30 MW, 20 MWh lithium-ion battery storage system at its El Centro generating station. The system went into service in October 2016 and in May, IID used the system’s 44 MW combined-cycle natural gas turbine at the generating station.

Passing savings to customers
The cost of the storage system was about $31 million, and based on its experience with the El Centro project, Champion said IID plans to add to the existing batteries. “We are continuing to see real savings and are passing those savings on to our customers,” she said.

Champion said the battery system gives IID the ability to provide ancillary services without having to run its larger generation units, such as El Centro Unit 4, at its minimum output. With gas prices at $3.59 per million British thermal units, it costs about $26,880 a day to run Unit 4, she said.

IID’s territory is in southeastern California, an area with a lot of renewable resources. IID is also not part of the California ISO and acts as its own balancing authority. The battery system gives the utility greater operational flexibility, in addition to the ability to use more of the surrounding renewable resources, Champion said.

In May, IID’s board gave the utility’s staff approval to enter into contract negotiations for a 7 MW, 4 MWh expansion of its El Centro storage facility. The negotiations are ongoing, but approval could come in the next couple months, Champion said.

The heart of the issue, though, is “the ability of the battery system to lower costs for our ratepayers,” Champion said. “Our planning section will continue to utilize the battery, and we are looking forward to its expansion,” she said.” I expect it will play an even more important role as we continue to increase our percentage of renewables.”


Related News

View more

Latvia eyes electricity from Belarus nuclear plant

Latvia Astravets electricity imports weigh AST purchases from the Belarusian nuclear plant, impacting the Baltic grid, Lithuania market, energy security, and cross-border trading as Latvia seeks to mitigate supply risks and stabilize power flows.


Key Points

Proposed AST purchases of power from Belarus's Astravets plant to bolster Baltic grid supply via Lithuania.

✅ AST evaluates imports to mitigate supply risk

✅ Energy could enter Lithuania via existing trading route

✅ Debate centers on nuclear safety and Baltic grid impacts


Latvia’s electricity transmission system operator, AST, is looking at the possibility of purchasing electricity from the soon-to-be completed Belarusian nuclear power plant in Astravets, at a time when Ukraine's electricity exports have resumed in the region, long criticised by the Lithuanian government, Belsat TV has reported.

According to the Latvian media, the Latvian government is seeking to mitigate the risk of a possible drop in electricity supplies amid price spikes in Ireland highlighting dispatchable power concerns, given that energy trading between the Baltic states and third parties is currently carried out only through the Belarusian-Lithuanian border, including Latvian imports from Lithuania.

If AST starts importing electricity from the Belarusian plant to Latvia, in a pattern similar to Georgia's electricity imports during peak demand, the energy is expected to enter the Lithuanian market as well.

Such cross-border flows also mirror responses to Central Asia's electricity shortages seen recently.

The Lithuanian government has repeatedly criticised the nuclear power over national security and environmental safety concerns, as well as a number of emergencies that took place during construction, particularly as Europe is losing nuclear power and confronting energy security challenges.

Debates over infrastructure and safety have also intensified by projects like power lines to reactivate Zaporizhzhia in Ukraine.

The first Astravets reactor, which is being built close to the Lithuanian border in the Hrodno region, is expected to be operational by the end of 2019, a year that saw Belgium's nuclear exports rise across Europe.


Related News

View more

Planning for our electricity future should be led by an independent body

Nova Scotia Integrated Resource Plan evaluates NSPI supply options, UARB oversight, Muskrat Falls imports, coal retirements, wind and biomass expansion, transmission upgrades, storage, and least-cost pathways to decarbonize the grid for ratepayers.


Key Points

A 25-year roadmap assessing supply, imports, costs, and emissions to guide least-cost decarbonization for Nova Scotia.

✅ Compares wind, biomass, gas, imports, and storage costs

✅ Addresses coal retirements, emissions caps, and reliability

✅ Recommends transmission upgrades and Muskrat Falls utilization


Maintaining a viable electricity network requires good long-term planning and, as a recent grid operations report notes, ongoing operational improvements. The existing stock of generating assets can become obsolete through aging, changes in fuel prices or environmental considerations. Future changes in demand must be anticipated.

Periodically, an integrated resource plan is created to predict how all this will add up during the ensuing 25 years. That process is currently underway and is led by Nova Scotia Power Inc. (NSPI) and will be submitted for approval to the Utilities and Review Board (UARB).

Coal-fired plants are still the largest single source of electricity in Nova Scotia. They need to be replaced with more environmentally friendly sources when they reach the end of their useful lives. Other sources include wind, hydroelectricity from rivers, biomass, as seen in increased biomass use by NS Power, natural gas and imports from other jurisdictions.

Imports are used sparingly today but will be an important source when the electricity from Muskrat Falls comes on stream. That project has big capacity. It can produce all the power needed in Newfoundland and Labrador (NL), where Quebec's power ambitions influence regional flows, plus the amount already committed to Nova Scotia, and still have a lot left over.

Some sources of electricity are more valuable than others. The daily amount of power from wind and solar cannot be controlled. Fuel-based sources and hydro can.

Utilities make their profits by providing the capital necessary to build infrastructure. Most of the money is borrowed but a portion, typically 30 per cent, usually comes from NSPI or a sister company. On that they receive a rate of return of nine per cent. Nova Scotia can borrow money today at less than two per cent.

The largest single investment of that type is the $1.577-billion Maritime Link connecting power from Newfoundland to Nova Scotia. It continues through to the New Brunswick border to facilitate exports to the United States. NSPI’s sister company, NSP Maritime Link Inc. (NSPML), is making nine per cent on $473 million of the cost.

There is little unexploited hydro capacity in Nova Scotia and there will not be any new coal-fired plants. Large-scale solar is not competitive in Nova Scotia’s climate. Nova Scotia’s needs would not accommodate the amount of nuclear capacity needed to be cost-effective, even as New Brunswick explores small reactors in its strategy.

So the candidates for future generating resources are wind, natural gas, biomass (though biomass criticism remains) and imports from other jurisdictions. Tidal is a promising opportunity but is still searching for a commercially viable technology. 

NSPI is commendably transparent about its process (irp.nspower.ca). At this stage there is little indication of the conclusions they are reaching but that will presumably appear in due course.

The mountains of detail might obscure the fact that NSPI is not an unbiased arbiter of choices for the future.

It is reported that they want to prematurely close the Trenton 5 coal plant in 2023-25. It is valued at $88.5 million. If it is closed early, ratepayers will still have to pay off the remaining value even though the plant will be idle. NSPI wants to plan a decommissioning of five of its other seven plants. There is a federal emissions constraint but retiring coal plants earlier than needed will cost ratepayers a lot.

Whenever those plants are closed, there will be a need for new sources of power. NSPI is proposing to plan for new investments in new transmission infrastructure to facilitate imports. Other possibilities would be additional wind farms, consistent with the shift to more wind and solar projects, thermal plants that burn natural gas or biomass, or storage for excess wind power that arrives before it can be used. The investment in storage could be anywhere from $20 million to $200 million.

These will add to the asset burden funded by ratepayers, even as industrial customers seek discounts while still paying for shuttered coal infrastructure.

External sources of new power will not provide NSPI the same opportunity: wind power by independent producers might be less expensive because they are willing to settle for less than nine per cent or because they are more efficient. Buying more power from Muskrat Falls will use transmission infrastructure we are already paying for. If a successful tidal technology is found, it will not be owned by NSPI or a sister company, which are no longer trying to perfect the technology.

This is not to suggest that NSPI would misrepresent the alternatives. But they can tilt the discussion in their favour. How tough will they be negotiating for additional Muskrat Falls power when it hurts their profits? Arguing for premature coal retirement on environmental grounds is fair game but whether the cost should be accepted is a political choice. 

NSPI is in a conflict of interest. We need a different process. An independent body should author the integrated resource plan. They should be fully informed about NSPI’s views.

They should communicate directly with Newfoundland and Labrador for Muskrat power, with independent wind producers, and with tidal power companies. The UARB cannot do any of these things.

The resulting plan should undergo the same UARB review that NSPI’s version would. This enhances the likelihood that Nova Scotians will get the least-cost alternative.


Related News

View more

Sign Up for Electricity Forum’s Newsletter

Stay informed with our FREE Newsletter — get the latest news, breakthrough technologies, and expert insights, delivered straight to your inbox.

Electricity Today T&D Magazine Subscribe for FREE

Stay informed with the latest T&D policies and technologies.
  • Timely insights from industry experts
  • Practical solutions T&D engineers
  • Free access to every issue

Live Online & In-person Group Training

Advantages To Instructor-Led Training – Instructor-Led Course, Customized Training, Multiple Locations, Economical, CEU Credits, Course Discounts.

Request For Quotation

Whether you would prefer Live Online or In-Person instruction, our electrical training courses can be tailored to meet your company's specific requirements and delivered to your employees in one location or at various locations.