NL Hydro electricity credit delivers a one-time on-bill rebate from the rate stabilization fund, linked to oil prices and the Holyrood plant, via the Public Utilities Board, with payment deferrals and interest relief for customers.
Key Points
A one-time on-bill credit from the rate stabilization fund to cut power costs as oil prices remain low.
✅ One-time on-bill credit via the Public Utilities Board
✅ Funded by surplus in the rate stabilization fund
✅ Deferrals and 15 months interest assistance available
Most people who pay electricity bills will get a one-time credit as early as July.
The provincial government on Thursday outlined a new directive to the Public Utilities Board to provide a one-time credit for customers whose electricity rates are affected by the price of oil, part of an effort to shield ratepayers from Muskrat Falls overruns through recent agreements.
Electricity customers who are not a part of the Labrador interconnected system, including those using diesel on the north coast of Labrador, will receive the credit.
The credit, announced at a press conference Thursday morning, will come from the rate stabilization fund and comes as many customers have begun paying for Muskrat Falls on their bills, which has an estimated surplus of about $50 million because low oil prices mean NL Hydro has spent less on fuel for the Holyrood thermal generating station.
Normally a surplus would be paid out over a year, but customers this year will get the credit in a lump sum, as early as July, with the amount varying based on electricity usage.
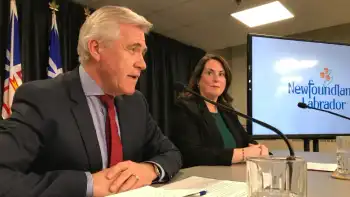
"Given the difficult times many are finding themselves in, we believe an upfront, one-time on-bill credit would be much more helpful for customers than a small monthly decrease over the next 12 months," said Natural Resources Minister Siobhan Coady at the provincial government's announcement Thursday morning.
Premier Dwight Ball said with many households and businesses experiencing financial hardship, the one-time credit is meant to make life a little easier, noting that Nova Scotia's premier has urged regulators to reject a major hike elsewhere.
"We have requested that the board of commissioners of the Public Utilities Board, even as Nova Scotia's regulator approved a 14% increase recently, adopt a policy so that a credit will be dispersed immediately," Ball said.
"This is to help people when they need it the most.… We're doing what we can to support you."
The provincial government estimates someone whose power costs an average of $200 a month would get a one-time credit of about $130. Details of the plan will be left to the PUB.
Deferred payments allowed
Ball said the credit will make a "significant impact" on customers' July bills.
Both businesses and residential customers will also be able to defer payments, similar to Alberta's deferral program that shifted costs for unpaid bills, with up to $2.5 million in interest being waived on overdue accounts. Customers will be required to make agreed-upon monthly payments to their account, and there will be interest assistance for 15 months, beginning June 1.
Coady said customers can renegotiate their bills and defer payments, with the province picking up the tab for the interest.
"You can speak to a customer service agent and they will make accommodations, but you have to continue to make some version of a monthly payment," Coady
"The interest that may be accrued is going to be paid for by the provincial government, so if you're a business, a person, and you're having difficulty and you can't make what I would say is your normal payment, call your utility, make some arrangements."
Labrador's interconnected grid isn't affected by the price of oil, but those customers can take advantage of the interest relief.
Relief policies already put in place during the pandemic, like not disconnecting customers and providing options for more flexible bill payments, will continue, as utilities such as Hydro One reconnecting customers demonstrate in Ontario.
Credit not enough to support customers: PCs
While Ball said his government is doing what they can to help ratepayers, the opposition doesn't believe the announcement does enough to support those who need it.
Tony Wakeham, the Progressive Conservative MHA for Stephenville-Port au Port, said in a statement Thursday the credit simply gives people's money back to them, after the NL Consumer Advocate called an 18% rate hike unacceptable, and Newfoundland Power stands to benefit.
"The Liberal government would like ratepayers to believe that they are getting electricity rate relief, but in reality, customers would have been entitled to receive the value of this credit anyway over a 12-month period. Furthermore, in providing a one-time credit, Newfoundland Power will also be able to collect an administrative fee, adding to their revenues," Wakeham said in the statement.
"People and businesses in this province are struggling to pay their utility bills, and the Liberal government should help them by putting extra money into their pockets, not by recycling an already existing program to the benefit of a large corporation."
Wakeham called on government to direct the PUB to lower Newfoundland Power's guaranteed rate of return to give cash refunds to customers, and for Newfoundland Power to waive its fees.
Related News