US Electricity Demand Outlook examines EIA forecasts, GDP decoupling, energy efficiency, electrification, electric vehicles, grid load growth, and weather variability to frame long term demand trends and utility planning scenarios.
Key Points
An analysis of EIA projections showing demand decoupling from GDP, with EV adoption and efficiency shaping future grid load.
✅ EIA lowers load growth; demand decouples from GDP.
✅ Efficiency and sector shifts depress kWh sales.
✅ EV adoption could revive load and capacity needs.
Electricity producers and distributors are in an unusual business. The product they provide is available to all customers instantaneously, literally at the flip of a switch. But the large amount of equipment, both hardware and software to do this takes years to design, site and install.
From a long range planning perspective, just as important as a good engineering design is an accurate sales projections. For the US electric utility industry the most authoritative electricity demand projec-tions come from the Department of Energy’s Energy Information Administration (EIA). EIA's compre-hensive reports combine econometric analysis with judgment calls on social and economic trends like the adoption rate of new technologies that could affect future electricity demand, things like LED light-ing and battery powered cars, and the rise of renewables overtaking coal in generation.
Before the Great Recession almost a decade ago, the EIA projected annual growth in US electricity production at roughly 1.5 percent per year. After the Great Recession began, the EIA lowered its projections of US electricity consumption growth to below 1 percent. Actual growth has been closer to zero. While the EIA did not antici-pate the last recession or its aftermath, we cannot fault them on that.
After the event, though, the EIA also trimmed its estimates of economic growth. For the 2015-2030 period it now predicts 2.1 percent economic and 0.3 percent electricity growth, down from previously projections of 2.7 percent and 1.3 percent respectively. (See Figures 1 and 2.)

Table 1. EIA electric generation projections by year of forecast (kWh billions)

Table 2. EIA forecast of GDP by year of forecast (billion 2009 $)
Back in 2007, the EIA figured that every one percent increase in economic activity required a 0.48 percent in-crease in electric generation to support it. By 2017, the EIA calculated that a 1 percent growth in economic activity now only required a 0.14 percent increase in electric output. What accounts for such a downgrade or disconnect between electricity usage and economic growth? And what factors might turn the numbers
around?
First, the US economy lost energy intensive heavy industry like smelting, steel mills and refineries; patterns in China's electricity sector highlight how industrial shifts can reshape power demand. A more service oriented economy (think health care) relies more heavily on the movement of data or information and uses far less power than a manufacturing-oriented economy.
A small volcano in Argentina is about to fuel the next tech boom – and a little known company is going to be right at the center. Early investors stand to gain incredible profits and you can too. Read the report.
Second, internet shopping has hurt so-called "brick and mortar" retailers. Despite the departure of heavy industry, in years past a burgeoning US commercial sector increased its demand and usage of electricity to offset the industrial decline. But not anymore. Energy efficiency measures as well as per-haps greater concern about global warming and greenhouse gas emissions and have cut into electricity sales. “Do more with less” has the right ring to it.
But there may be other components to the ongoing decline in electricity usage. Academic studies show that electricity usage seems to increase with income along an S curve, and flattens out after a certain income level. That is, if you earn $1 billion per year you do not (or cannot) use ten times a much electricity as someone earning only $100 million.
But people at typical, middle income levels increase or decrease electricity usage when incomes rise or fall. The squeeze on middle income families was discussed often in the late presidential campaign. In recent decades an increasing percentage of income has gone to a small percentage of the population at the top of the income scale. This trend probably accounts for some weakness in residential sales. This suggests that government policy addressing income inequality would also boost electricity sales.
Population growth affects demand for electricity as well as the economy as a whole. The EIA has made few changes in its projections, showing 0.7 percent per year population growth in 2015- 2030 in both the 2007 and 2017 forecasts. Recent studies, however, have shown a drop in the birth rate to record lows. More troubling, from a national health perspective is that the average age of death may have stopped rising. Those two factors point to lower population growth, especially if the government also restricts immi-gration. Thus, the US may be approaching a period of rather modest population growth.
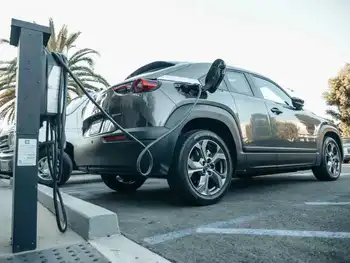
All of the above factors point to minimal sales growth for electricity producers in the US--perhaps even lower than the seemingly conservative EIA estimates. But the cloud on the horizon has a silver lining in the shape of an electric car. Both the United Kingdom and France have set dates to end of production of automobiles with internal combustion engines. Several European car makers have declared that 20 percent of their output will be electric vehicles by the early 2020s. If we adopt automobiles powered by electricity and not gasoline or diesel, electricity sales would increase by one third. For the power indus-try, electric vehicles represent the next big thing.
We don’t pretend to know how electric car sales will progress. But assume vehicle turnover rates re-main at the current 7 percent per year and electric cars account for 5 percent of sales in the first five years (as op-posed to 1 percent now), 20 percent in the next five years and 50 percent in the third five year period. Wildly optimistic assumptions? Maybe. By 2030, electric cars would constitute 28 percent of the vehicle fleet. They would add about 10 percent to kilowatt hour sales by that date, assuming that battery efficiencies do not improved by then. Those added sales would require increased electric generation output, with low-emissions sources expected to cover almost all the growth globally. They would also raise long term growth rates for 2015-2030 from the present 0.3 percent to 1.0 percent. The slow upturn in demand should give the electric companies time to gear up so to speak.
In the meantime, weather will continue to play a big role in electricity consumption. Record heat-induced demand peaks are being set here in the US even as surging global demand puts power systems under strain worldwide.
Can we discern a pattern in weather conditions 15 years out? Maybe we can, but that is one topic we don’t expect a government agency to tackle in public right now. Meantime, weather will affect sales more than anything else and we cannot predict the weather. Or can we?
Related News