Alberta utility receives approval for transmission line

By ATCO Electric


Electrical Testing & Commissioning of Power Systems

Our customized live online or in‑person group training can be delivered to your staff at your location.

  • Live Online
  • 12 hours Instructor-led
  • Group Training Available
Regular Price:
$599
Coupon Price:
$499
Reserve Your Seat Today
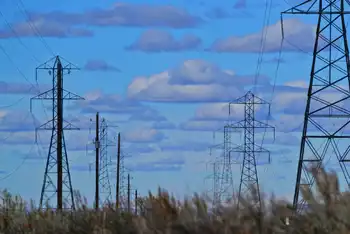
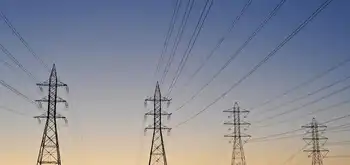
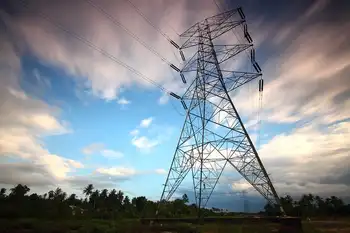
​ATCO Electric has received approval from the Alberta Utilities Commission AUC to build the Eastern Alberta Transmission Line. The 500-kilovolt direct current line, and its associated converter stations and facilities, extends from the Gibbons area northeast of Edmonton to an area near Brooks in southeast Alberta. It adds additional capacity to Alberta’s existing electricity transmission system.

In developing the application, ATCO Electric conducted an extensive public engagement process that included information campaigns, open houses and thousands of individual meetings with landowners. The information gained through this process was instrumental in defining the preferred and alternate routes submitted by ATCO Electric and, ultimately, the route approved by the AUC.

“I want to extend my thanks to the landowners that participated in the process. The decision is the result of three years of hard work and consultation and directly reflects the input that we received throughout the process,” said Sett Policicchio, President, ATCO Electric Capital Projects Division. “We look forward to continuing to work together with these landowners and the communities of eastern Alberta as we begin to build this critically important piece of infrastructure for Alberta.”

When complete, the Eastern Alberta Transmission Line will reinforce the reliability, increase the capacity and improve the efficiency of the Alberta grid. The line will help meet the growing demand for electricity in the province, allowing it to flow from where it is generated to where it is needed.

Related News

US Automakers Will Build 30,000 Electric Vehicle Chargers

Automaker EV Fast-Charging Network will deploy 30,000 DC fast chargers across US and Canada, supporting CCS and NACS, integrating Tesla compatibility, easing range anxiety, and expanding highway and urban charging infrastructure with amenities and uptime.


Key Points

A $1B joint venture by seven automakers to build 30,000 DC fast chargers with CCS and NACS across the US and Canada.

✅ 30,000 DC fast chargers by 2030 across US and Canada

✅ Supports CCS and NACS; Tesla compatibility planned

✅ Launching mid-2024; focus on highways, urban hubs, amenities


Seven major automakers announced a plan on Wednesday to nearly double the number of fast chargers in the United States in an effort to address one of the main reasons that people hesitate to buy electric cars, even as the age of electric cars accelerates.

The carmakers — BMW Group, General Motors, Honda, Hyundai, Kia, Mercedes-Benz Group and Stellantis — will initially invest at least $1 billion in a joint venture that will build 30,000 charging ports on major highways and other locations in the United States and Canada.

The United States and Canada have about 36,000 fast chargers — those that can replenish a drained battery in 30 minutes or less. In some sparsely populated areas, such chargers can be hundreds of miles apart. Surveys show that fear about not being able to find a charger during longer journeys is a major reason that some car buyers are reluctant to buy electric vehicles.

Sales of electric vehicles have risen quickly in the United States as the market hits an inflection point, but there are signs that demand is softening. As a result, Tesla, Ford and other carmakers have cut prices in recent months and are offering incentives. Popular models that had long waiting lists last year are now available in a few days or weeks.

Major carmakers are investing billions of dollars to manufacture electric vehicles and batteries and to establish supplier networks. Having staked their futures on the technology, they have a strong incentive to ensure that electric vehicles catch on with car buyers, even as gas-electric hybrids help bridge the transition.

The chargers installed by the joint venture will have plugs designed for the connections used by most carmakers other than Tesla, as well as the standard developed by Tesla, amid fights for control over charging, that Ford, G.M. and other companies have said they intend to switch to in 2025.

“The better experience people have, the faster E.V. adoption will grow,” Mary T. Barra, the chief executive of General Motors, said in a statement.

The seven automakers plan to formalize the joint venture and announce its name by the end of the year, Chris Martin, a Honda spokesman, said. The first chargers will begin operating around the middle of 2024, he said, with all 30,000 in place by the end of the decade.

The joint venture is open to adding other partners, he said. Among major automakers, Ford was a notable absence from the announcement on Wednesday. The company said in a statement on Wednesday that it would continue to iThe partnership also does not include Volkswagen. The company is a majority shareholder of Electrify America, one of the largest fast-charging providers.

Tesla accounts for more than half the fast chargers in the United States and has said it will open its networks to other car brands, though, so far, it has only made fewer than 100 ports available. Owners of Ford and G.M. vehicles, among others, will be able to connect to 12,000 Tesla fast chargers using an adapter beginning next year. In 2025, Ford and G.M. plan to make models designed to take the Tesla plug without an adapter.

The decision by the seven carmakers to form the joint venture is an indication that they do not intend to rely solely on Tesla, which dominates sales of electric vehicles, for charging.

The chargers being built by the joint venture will be concentrated in urban areas and along major highways, especially those used most heavily by vacationers and other travelers, the companies said in a joint statement. Charging stations will be close to restrooms, restaurants and other amenities. The partners said they would try to take advantage of federal and state funds available for charging infrastructure amid questions about whether the U.S. has the power to charge it at scale.

Most electric vehicle owners charge at home and rarely need to use public chargers. Home chargers typically replenish batteries overnight. Most public chargers, about 125,000 in the United States and Canada, also operate relatively slowly — taking four to 10 hours to do the job.nvest in its own network, which allows Ford owners to charge from a variety of providers with one mobile phone app.


Related News

View more

India Electricity Prices are Spiking

India spot electricity prices surged on Q3 demand, lifting power tariffs in the spot market as discoms scrambled for supply; Sembcorp SGPL boosted PLF and short-term PPA realizations, benefiting from INR per kWh peaks.


Key Points

India spot electricity prices hit Q3 records amid demand spikes, lifting tariffs and aiding Sembcorp SGPL via PLF gains.

✅ Record 10.6 cents/kWh average; 15-minute peak 20.7 cents/kWh

✅ SGPL shifted output to short-term PPA at 7.3 cents/kWh

✅ PLF ramped above 90%, cutting core losses by 30-40%


Electricity prices in India, now the third-largest electricity producer globally, bolted to a record high of 10.6 cents/kWh (INR5.1/kWh) in Q3.

A jolt in Indian spot electricity prices could save Sembcorp Industries' Indian business from further losses, even though demand has occasionally slumped in recent years, UOB Kay Hian said.

The firm said spot electricity prices in India bolted to a record high of 10.6 cents/kWh (INR5.1/kWh) in Q3 and even hit a 15-minute peak of 20.7 cents/kWh (9.9/kWh). The spike was due to a power supply crunch on higher electricity demand from power distribution companies, alongside higher imported coal volumes as domestic supplies shrank.

As an effect, Sembcorp Industries' Sembcorp Gayatri Power Limited's (SGPL) losses of $26m in Q1 and $29m in Q2 could narrow down by as much as 30-40%.

On a net basis, SGPL will recognise a significantly higher electricity tariff in 3Q17. By tactically shutting down its Unit #3 for maintenance, Unit #4 effectively had its generation contracted out at the higher short-term PPA tariff of around 7.3 cents/kWh (Rs3.5/kWh).

SGPL also capitalised on the price spike in 3Q17 as it ramped up its plant load factor (PLF) to more than 90%.

“On the back of this, coupled with the effects of reduced finance costs, we expect SGPL’s 3Q17 quarterly core loss to shrink by 30-40% from previous quarters,” UOB Kay Hian said.

Whilst electricity prices have corrected to 7.1 cents/kWh (INR3.4/kWh), the firm said it could still remain elevated on structural factors, even as coal and electricity shortages ease nationwide.

Sembcorp Industries' India operations brought in a robust performance for Q3. PLF for Thermal Powertech Corporation India Limited (TPCIL) hit 91%, whilst it reached 73% for SGPL, echoing the broader trend of thermal PLF up across the sector.


Related News

View more

Utility giant Electricite de France acquired 50pc stake in Irish offshore wind farm

Codling Bank Offshore Wind Project will deliver a 1.1 GW offshore wind farm off the Wicklow coast, as EDF Renewables and Fred Olsen Renewables invest billions to support Ireland's CAP 2030 and cut carbon emissions.


Key Points

A 1.1 GW offshore wind farm off Co Wicklow, led by EDF and Fred Olsen, advancing Ireland's CAP 2030 targets.

✅ Up to 1.1 GW capacity; hundreds of turbines off Co Wicklow

✅ EDF Renewables partners with Fred Olsen Renewables

✅ Investment well over €2bn, supporting 70% electricity by 2030


It’s been previously estimated that the entire Codling Bank project, which will eventually see hundreds of wind turbines, such as a huge offshore wind turbine now coming to market, erected about 13km off the Co Wicklow coast, could be worth as much as €100m. The site is set to generate up to 1.1 gigawatts of electricity when it’s eventually operational.

It’s likely to cost well over €2bn to develop, and with new pipelines abroad where Long Island offshore turbine proposals are advancing, scale economies are increasingly relevant.

The other half of the project is owned by Norway’s Fred Olsen Renewables, with tens of millions of euro already reportedly spent on surveys and other works associated with the scheme. Initial development work started in 2003.

Mr Barrett will now continue to focus on his non-Irish renewable projects, at a time when World Bank wind power support is accelerating in developing countries, said Hazel Shore, the company that sold the stake. It added that Johnny Ronan and Conor Ronan, the developer’s brother, will retain an equity interest in the Codling project.

“The Hazel Shore shareholders remain committed to continuing their renewable and forestry businesses,” noted the firm, whose directors include Paddy Teahon, a former secretary of the Department of the Taoiseach and chairman of the National Offshore Wind Association of Ireland.

The French group’s EDF Renewables subsidiary will now partner with the Norwegian firm to develop and build the Codling Bank project, in a sector widely projected to become a $1 trillion business over the coming decades.

EDF pointed out that the acquisition of the Codling Bank stake comes after the government committed to reducing carbon emissions. A Climate Action Plan launched last year will see renewable projects generating 70pc of Ireland’s electricity by 2030, with more than a third of Irish electricity to be green within four years according to recent analysis. Offshore wind is expected to deliver at least 3.5GW of power in support of the objective.

Bruno Bensasson, EDF Group senior executive vice-president of renewable energies and the CEO of EDF Renewables said the French group is “committed to contributing to the Irish government’s renewables goals”.

“This important project clearly strengthens our strong ambition to be a leading global player in the offshore wind industry,” he added. “This is consistent with the CAP 2030 strategy that aims to double EDF’s renewable energy generation by 2030 and increase it to 50GW net.”

Matthieu Hue, the CEO of EDF Renewables UK and Ireland said the firm already has an office in Dublin and is looking for further renewable projects, as New York's biggest offshore wind farm moves ahead, underscoring momentum.

Last November, the ESB teamed up with EDF in Scotland, reflecting how UK offshore wind is powering up, with the Irish utility buying a 50pc stake in the Neart na Gaoithe offshore wind project. The massive wind farm is expected to generate up to 450MW of electricity and will cost about €2.1bn to develop.

EDF said work on that project is “well under way”.


Related News

View more

Parsing Ontario's electricity cost allocation

Ontario Global Adjustment and ICI balance hydro rates, renewable cost shift, and peak demand. Class A and Class B customers face demand response decisions amid pandemic occupancy uncertainty and volatile GA charges through 2022.


Key Points

A pricing model where GA costs and ICI peak allocation shape Class A/B bills, driven by renewables cost shifts.

✅ Renewable cost shift trims GA; larger Class A savings expected.

✅ Class A peak strategy returns; occupancy uncertainty persists.

✅ Class B faces volatile GA; limited levers beyond efficiency.


Ontario’s large commercial electricity customers can approach the looming annual decision about their billing structure for the 12 months beginning July 1 with the assurance of long-term relief on a portion of their costs, amid changes coming for electricity consumers that could affect planning. That’s to be weighed against uncertainties around energy demand and whether a locked-in cost allocation formula that looked favourable in pre-pandemic times will remain so until June 30, 2022.

“The biggest unknown is we just don’t know when the people are coming back,” Jon Douglas, director of sustainability with Menkes Property Management Services, reflected during a webinar sponsored by the Building Owners and Managers Association (BOMA) of Greater Toronto last week. “The occupancy in our office buildings this fall, and going into the new year, could really impact the outcome of the decision.”

After a year of operational upheaval and more modifications to provincial electricity pricing policies, BOMA Toronto’s regularly scheduled workshop ahead of the June 15 deadline for eligible customers to opt into the Industrial Conservation Initiative (ICI) program had a lot of ground to cover. Notably, beginning in January, all commercial customers have seen a reduction in the global adjustment (GA) component of their monthly hydro bills after the Ontario government shifted costs associated with contracted non-hydroelectric renewable supply to reduce the burden on industrial ratepayers from electricity rates to the general provincial account — a move that trims approximately $258 million per month from the total GA charged to industrial and commercial customers. However, they won’t garner the full benefit of that until 2022 since they’re currently repaying about $333 million in GA costs that were deferred in April, May and June of 2020.

Renewable cost shift pares the global adjustment
For now, Ontario government officials estimate the renewable cost shift equates to a 12 per cent discount relative to 2020 prices, even as typical bills may rise about 2% as fixed pricing ends in some cases. Once last year’s GA deferral is repaid at the end of 2021, they project the average Class A customer participating in the ICI program should realize a 16 per cent saving on the total hydro bill, while Class B customers paying the GA on a volumetric per kilowatt-hour (kWh) basis will see a slightly more moderate 15 per cent decrease.

“This is the biggest change to electricity pricing that’s happened since the introduction of ICI,” Tim Christie, director of electricity policy, economics and system planning for Ontario’s Ministry of Energy, Northern Development and Mines, told online workshop attendees. “The government is funding the out-of-market costs of renewables. It does tail off into the 2030s as those contracts (for wind, solar and biomass generation) expire, but over the next eight-ish years, it’s pretty steady at around just over $3 billion per year.”

Extrapolating from 2020 costs, he pegged average electricity costs at roughly 9.1 cents/kWh for Class A commercial customers and 13.2 cents/kWh for Class B, a point of concern for Ontario manufacturers facing high rates as well. However, energy management specialists suggest actual 2021 numbers haven’t proved that out.

“In commercial buildings, we’re averaging 10 to 12 cents for Class A in 2021, and we’re seeing more than that for about 14, 15 cents for Class B,” reported Scott Rouse, managing partner with the consulting firm, Energy@Work.

GA costs for Class B customers dropped nearly 30 per cent in the first four months of 2021 compared to the last four months of 2020, when they averaged 11.8 cents/kWh. Thus far, though, there have been significant month-to-month fluctuations, with a low of 5.04 cents/kWh in February and a high of 10.9 cents/kWh in April contributing to the four-month average of 8.3 cents/kWh.

“In 2020, system-wide GA very often averaged more than $1 billion per month,” Rouse said. “This February it dropped to $500 million, which was really quite surprising. So it is a very volatile cost.”

Although welcome, the renewable cost shift does alter the payback on energy-saving investments, particularly for demand response mechanisms like energy storage. When combined with pandemic-related uncertainty and a series of policy and program reversals alongside calls to clean up Ontario’s hydro policy in recent years, the industry’s appetite for some more capital-intensive technologies appears to be flagging.

“Volatility puts a pause on some of the innovation,” said Terry Flynn, general manager with BentallGreenOak and chair of BOMA Toronto’s energy committee. “It could be a leading edge, but it might be a bleeding edge that won’t bear any fruit because the way the commodity costs are structured will change.”

“There’s kind of a wait-and-see approach on some of these bigger investments,” Douglas concurred.

Industrial Conservation Initiative underpins commercial class divide
Turning to the ICI, Class A customers — defined as those with average monthly energy demand of at least 1 megawatt (MW) — encountered some unexpected changes to the program rules during 2020. Meanwhile, Class B customers — encompassing the vast share of commercial properties smaller than about 350,000 square feet — confront the persistent reality of electricity cost allocation that offloads the burden from larger players onto them.

Through the ICI, participating Class A customers pay a share of the global adjustment that’s prorated to their energy use during the five hours of the period from May 1 to April 30 when the highest overall system demand is recorded. This gives Class A customers the opportunity to lock in a favourable factor for calculating their share of monthly system-wide global adjustment costs if they can successful project and curtail energy loads during those five hours of peak demand. On the flipside, Class B customers pay the remainder of those system-wide costs, on a straightforward per-kWh basis, once Class A payments have been reconciled.

“Class B has sometimes been regarded as the forgotten middle child of the customer classes in Ontario where all the shifted costs in the system kind of pile up,” acknowledged Mark Olsheski, vice president, energy and environment, with Sussex Strategy Group. “Likewise, there can be big unpredictable and uncontrollable swings in the global adjustment rate from month to month and, outside of pure energy efficiency, there really is precious little opportunity or empowerment for a Class B customer to take actions to lower their bills.”

Nevertheless, COVID-19 presents a few extra hiccups for Class A customers this year. Conventionally, late May is when they receive notification of the cost allocation factor that would be used to determine their GA for the upcoming July 1 to June 30 period. This year, though, all current ICI participants will retain the factor they secured by responding to the five hours of peak demand during the 12 months from May 1, 2019 to April 30, 2020 after the Ontario government placed a temporary halt on the peak demand response aspect of the program last summer. Regardless, eligible ICI participants must formally opt into the program by June 15 or they will be billed as Class B customers.

Peak chasing resumes for summer 2021
Since peak demand hours conventionally occur from June to September, Class A customers will once again be studying forecasts intently and preparing to respond via Peak Perks as the heat wave season sets in. That should help alleviate some of the system stresses that arose last summer — prompting policy-makers to reject lobbying for a continued pause on peak demand response.

“The policy rationale was to allow consumers to focus on their operations when recovering from COVID as opposed to reducing peaks. The other issue was that we did not expect the peaks to be high last summer given COVID shutdowns,” Christie recounted. “But due to some hot weather, more people at home and also the lack of ICI response, we saw peaks we haven’t seen in many, many years come up last summer. So the peak hiatus has ended and this summer we’ll be back to responding to ICI as per normal.”

Among Class A customers, owners/managers of office and retail facilities generally have the most to lose from a billing formula tied to the energy demand of more densely occupied buildings in the summer of 2019. However, they could be much more competitively positioned for 2022-23 if their buildings remain below full occupancy and energy demand stays lower than usual this summer.

“Where we can improve is the IESO (Independent Electricity System Operator) and the LDCs (local distribution companies) need to help customers get their real-time data, especially in light of the phantom demand issue, interpret their bills and their Class A versus B scenarios much more easily and comprehensively,” urged Lee Hodgkinson, vice president, technical services, sustainability and ESG, with Dream Unlimited. “ I look for APIs (application programming interface) and direct data flow from the LDCs to the building owners so that we can access that data really easily.”

Given Class A’s historic advantages, few eligible ICI participants are expected to migrate out to Class B. From a sustainability perspective, there’s perhaps more cause to question how the ICI’s 1-MW threshold encourages strategies to move in the other direction.

“You could jack up demand in some buildings and get them into Class A basically by firing up the chillers on the weekend and then pouring cooling outside to get rid of it,” Douglas noted. “That has nothing to do with climate change strategy or sustainability, but it’s a cost- saving strategy, and, sometimes, when you look at the math, it’s hundreds of thousands of dollars you can save.”

Brian Hewson, vice president, consumer protection and industry performance with the Ontario Energy Board (OEB), confirmed the OEB is currently scrutinizing the discrepancy that leaves Class B as the only consumer group with no flexibility to curtail energy load during higher-priced periods, and will be providing advice to the Ministry of Energy. In the interim, that status does, at least, simplify tactics.

“Just reduce your kWh and it doesn’t matter what time of day because you’re paying that fixed rate for 24 hours a day. So if you can curb your demand at night, you get a big bang for your dollar,” Rouse advised.

“We do talk about rates a lot, but if you’re not using it, you’re not paying for it,” Flynn agreed. “A lot of our focus is still on really to try to reduce the number of kilowatts that we use. That seems to be the best thing to do.”


Related News

View more

Trump's Order Boosts U.S. Uranium and Nuclear Energy

Uranium Critical Mineral Reclassification signals a US executive order directing USGS to restore critical status, boosting nuclear energy, domestic uranium mining, streamlined permitting, federal support, and energy security amid import reliance and supply chain risks.


Key Points

A policy relisting uranium as a critical mineral to unlock funding, speed permits, and strengthen U.S. nuclear security.

✅ Directs Interior to have USGS reconsider uranium classification

✅ Speeds permits for domestic uranium mining projects

✅ Targets import dependence and strengthens energy security


In a strategic move to bolster the United States' nuclear energy sector, former President Donald Trump issued an executive order on January 20, 2025, directing the Secretary of the Interior to instruct the U.S. Geological Survey (USGS) to reconsider classifying uranium as a critical mineral. This directive aims to enhance federal support and streamline permitting processes for domestic uranium projects, thereby strengthening U.S. energy security objectives.

Reclassification of Uranium as a Critical Mineral

The USGS had previously removed uranium from its critical minerals list in 2022, categorizing it as a "fuel mineral" that did not qualify for such designation. The recent executive order seeks to reverse this decision, recognizing uranium's strategic importance in the context of the nation's energy infrastructure and geopolitical considerations.

Implications for Domestic Uranium Production

Reclassifying uranium as a critical mineral is expected to unlock federal funding and expedite the permitting process for uranium mining projects within the United States. This initiative is particularly pertinent given the significant decline in domestic uranium production over the past two decades. According to the U.S. Energy Information Administration, domestic production has decreased by 96%, from 4.8 million pounds in 2014 to approximately 121,296 pounds in the third quarter of 2024.

Current Uranium Supply Dynamics

Despite the push for increased domestic production, the U.S. remains heavily reliant on uranium imports. In 2022, 27% of U.S. uranium purchases were sourced from Canada, with an additional 57% imported from countries including Kazakhstan, Uzbekistan, Australia, and Russia; a recent ban on Russian uranium could further disrupt these supply patterns and heighten risks. This reliance on foreign sources has raised concerns about energy security, especially in light of recent geopolitical tensions.

Challenges and Considerations

While the executive order represents a significant step toward revitalizing the U.S. nuclear energy sector, several challenges persist, and energy dominance faces constraints that will shape implementation:

  • Regulatory Hurdles: Accelerating the permitting process for uranium mining projects involves navigating complex environmental and regulatory frameworks, though recent permitting reforms for geothermal hint at potential pathways, which can be time-consuming and contentious.

  • Market Dynamics: The uranium market is subject to global supply and demand fluctuations, and domestic producers may face competition from established international suppliers.

  • Infrastructure Development: Expanding domestic uranium production necessitates substantial investment in mining infrastructure and workforce development, areas that have been underfunded in recent years.

Broader Implications for Nuclear Energy Policy

The executive order aligns with a broader strategy to revitalize the U.S. nuclear energy industry, where ongoing nuclear innovation is critical to delivering stable, low-emission power. The increasing demand for nuclear energy is driven by the global push for zero-emissions energy sources and the need to support power-intensive technologies, such as artificial intelligence servers.

Former President Trump's executive order to reclassify uranium as a critical mineral, aligning with his broader energy agenda and a prior pledge to end the 'war on coal', signifies a pivotal moment for the U.S. nuclear energy sector. By potentially unlocking federal support, including programs advanced by the Nuclear Innovation Act, and streamlining permitting processes, this initiative aims to reduce dependence on foreign uranium sources and enhance national energy security. However, realizing these objectives will require addressing regulatory challenges, market dynamics, and infrastructure needs to ensure the successful revitalization of the domestic uranium industry.


Related News

View more

Offshore wind is set to become a $1 trillion business

Offshore wind power accelerates low-carbon electrification, leveraging floating turbines, high capacity factors, HVDC transmission, and hydrogen production to decarbonize grids, cut CO2, and deliver competitive, reliable renewable energy near demand centers.


Key Points

Offshore wind power uses offshore turbines to deliver low-carbon electricity with high capacity factors and falling costs.

✅ Sea-based wind farms with 40-50% capacity factors

✅ Floating turbines unlock deep-water, far-shore resources

✅ Enables hydrogen production and strengthens grid reliability


The need for affordable low-carbon technologies is greater than ever

Global energy-related CO2 emissions reached a historic high in 2018, driven by an increase in coal use in the power sector. Despite impressive gains for renewables, fossil fuels still account for nearly two-thirds of electricity generation, the same share as 20 years ago. There are signs of a shift, with increasing pledges to decarbonise economies and tackle air pollution, and with World Bank support helping developing countries scale wind, but action needs to accelerate to meet sustainable energy goals. As electrification of the global energy system continues, the need for clean and affordable low-carbon technologies to produce this electricity is more pressing than ever. This World Energy Outlook special report offers a deep dive on a technology that today has a total capacity of 23 GW (80% of it in Europe) and accounts for only 0.3% of global electricity generation, but has the potential to become a mainstay of the world's power supply. The report provides the most comprehensive analysis to date of the global outlook for offshore wind, its contributions to electricity systems and its role in clean energy transitions.


The offshore wind market has been gaining momentum

The global offshore wind market grew nearly 30% per year between 2010 and 2018, benefitting from rapid technology improvements. Over the next five years, about 150 new offshore wind projects are scheduled to be completed around the world, pointing to an increasing role for offshore wind in power supplies. Europe has fostered the technology's development, led by the UK offshore wind sector alongside Germany and Denmark. The United Kingdom and Germany currently have the largest offshore wind capacity in operation, while Denmark produced 15% of its electricity from offshore wind in 2018. China added more capacity than any other country in 2018.


The untapped potential of offshore wind is vast

The best offshore wind sites could supply more than the total amount of electricity consumed worldwide today. And that would involve tapping only the sites close to shores. The IEA initiated a new geospatial analysis for this report to assess offshore wind technical potential country by country. The analysis was based on the latest global weather data on wind speed and quality while factoring in the newest turbine designs. Offshore wind's technical potential is 36 000 TWh per year for installations in water less than 60 metres deep and within 60 km from shore. Global electricity demand is currently 23 000 TWh. Moving further from shore and into deeper waters, floating turbines could unlock enough potential to meet the world's total electricity demand 11 times over in 2040. Our new geospatial analysis indicates that offshore wind alone could meet several times electricity demand in a number of countries, including in Europe, the United States and Japan. The industry is adapting various floating foundation technologies that have already been proven in the oil and gas sector. The first projects are under development and look to prove the feasibility and cost-effectiveness of floating offshore wind technologies.


Offshore wind's attributes are very promising for power systems

New offshore wind projects have capacity factors of 40-50%, as larger turbines and other technology improvements are helping to make the most of available wind resources. At these levels, offshore wind matches the capacity factors of gas- and coal-fired power plants in some regions – though offshore wind is not available at all times. Its capacity factors exceed those of onshore wind and are about double those of solar PV. Offshore wind output varies according to the strength of the wind, but its hourly variability is lower than that of solar PV. Offshore wind typically fluctuates within a narrower band, up to 20% from hour to hour, than solar PV, which varies up to 40%.

Offshore wind's high capacity factors and lower variability make its system value comparable to baseload technologies, placing it in a category of its own – a variable baseload technology. Offshore wind can generate electricity during all hours of the day and tends to produce more electricity in winter months in Europe, the United States and China, as well as during the monsoon season in India. These characteristics mean that offshore wind's system value is generally higher than that of its onshore counterpart and more stable over time than that of solar PV. Offshore wind also contributes to electricity security, with its high availability and seasonality patterns it is able to make a stronger contribution to system needs than other variable renewables. In doing so, offshore wind contributes to reducing CO2 and air pollutant emissions while also lowering the need for investment in dispatchable power plants. Offshore wind also has the advantage of avoiding many land use and social acceptance issues that other variable renewables are facing.


Offshore wind is on track to be a competitive source of electricity

Offshore wind is set to be competitive with fossil fuels within the next decade, as well as with other renewables including solar PV. The cost of offshore wind is declining and is set to fall further. Financing costs account for 35% to 50% of overall generation cost, and supportive policy frameworks are now enabling projects to secure low cost financing in Europe, with zero-subsidy tenders being awarded. Technology costs are also falling. The levelised cost of electricity produced by offshore wind is projected to decline by nearly 60% by 2040. Combined with its relatively high value to the system, this will make offshore wind one of the most competitive sources of electricity. In Europe, recent auctions indicate that offshore wind will soon beat new natural gas-fired capacity on cost and be on a par with solar PV and onshore wind. In China, offshore wind is set to become competitive with new coal-fired capacity around 2030 and be on par with solar PV and onshore wind. In the United States, recent project proposals indicate that offshore wind will soon be an affordable option, even as the 1 GW timeline continues to evolve, with potential to serve demand centres along the country's east coast.

Innovation is delivering deep cost reductions in offshore wind, and transmission costs will become increasingly important. The average upfront cost to build a 1 gigawatt offshore wind project, including transmission, was over $4 billion in 2018, but the cost is set to drop by more than 40% over the next decade. This overall decline is driven by a 60% reduction in the costs of turbines, foundations and their installation. Transmission accounts for around one-quarter of total offshore wind costs today, but its share in total costs is set to increase to about one-half as new projects move further from shore. Innovation in transmission, for example through work to expand the limits of direct current technologies, will be essential to support new projects without raising their overall costs.


Offshore wind is set to become a $1 trillion business

Offshore wind power capacity is set to increase by at least 15-fold worldwide by 2040, becoming a $1 trillion business. Under current investment plans and policies, the global offshore wind market is set to expand by 13% per year, reflecting its growth despite Covid-19 in recent years, passing 20 GW of additions per year by 2030. This will require capital spending of $840 billion over the next two decades, almost matching that for natural gas-fired or coal-fired capacity. Achieving global climate and sustainability goals would require faster growth: capacity additions would need to approach 40 GW per year in the 2030s, pushing cumulative investment to over $1.2 trillion. 

The promising outlook for offshore wind is underpinned by policy support in an increasing number of regions. Several European North Seas countries – including the United Kingdom, Germany, the Netherlands and Denmark – have policy targets supporting offshore wind. Although a relative newcomer to the technology, China is quickly building up its offshore wind industry, aiming to develop a project pipeline of 10 GW by 2020. In the United States, state-level targets and federal incentives are set to kick-start the U.S. offshore wind surge in the coming years. Additionally, policy targets are in place and projects under development in Korea, Japan, Chinese Taipei and Viet Nam.

 The synergies between offshore wind and offshore oil and gas activities provide new market opportunities. Since offshore energy operations share technologies and elements of their supply chains, oil and gas companies started investing in offshore wind projects many years ago. We estimate that about 40% of the full lifetime costs of an offshore wind project, including construction and maintenance, have significant synergies with the offshore oil and gas sector. That translates into a market opportunity of $400 billion or more in Europe and China over the next two decades. The construction of foundations and subsea structures offers potential crossover business, as do practices related to the maintenance and inspection of platforms. In addition to these opportunities, offshore oil and gas platforms require electricity that is often supplied by gas turbines or diesel engines, but that could be provided by nearby wind farms, thereby reducing CO2 emissions, air pollutants and costs.


Offshore wind can accelerate clean energy transitions

Offshore wind can help drive energy transitions by decarbonising electricity and by producing low-carbon fuels. Over the next two decades, its expansion could avoid between 5 billion and 7 billion tonnes of CO2 emissions from the power sector globally, while also reducing air pollution and enhancing energy security by reducing reliance on imported fuels. The European Union is poised to continue leading the wind energy at sea in Europe industry in support of its climate goals: its offshore wind capacity is set to increase by at least fourfold by 2030. This growth puts offshore wind on track to become the European Union's largest source of electricity in the 2040s. Beyond electricity, offshore wind's high capacity factors and falling costs makes it a good match to produce low-carbon hydrogen, a versatile product that could help decarbonise the buildings sector and some of the hardest to abate activities in industry and transport. For example, a 1 gigawatt offshore wind project could produce enough low-carbon hydrogen to heat about 250 000 homes. Rising demand for low-carbon hydrogen could also dramatically increase the market potential for offshore wind. Europe is looking to develop offshore "hubs" for producing electricity and clean hydrogen from offshore wind.


It's not all smooth sailing

Offshore wind faces several challenges that could slow its growth in established and emerging markets, but policy makers and regulators can clear the path ahead. Developing efficient supply chains is crucial for the offshore wind industry to deliver low-cost projects. Doing so is likely to call for multibillion-dollar investments in ever-larger support vessels and construction equipment. Such investment is especially difficult in the face of uncertainty. Governments can facilitate investment of this kind by establishing a long-term vision for offshore wind and by drawing on U.K. policy lessons to define the measures to be taken to help make that vision a reality. Long-term clarity would also enable effective system integration of offshore wind, including system planning to ensure reliability during periods of low wind availability.

The success of offshore wind depends on developing onshore grid infrastructure. Whether the responsibility for developing offshore transmission lies with project developers or transmission system operators, regulations should encourage efficient planning and design practices that support the long-term vision for offshore wind. Those regulations should recognise that the development of onshore grid infrastructure is essential to the efficient integration of power production from offshore wind. Without appropriate grid reinforcements and expansion, there is a risk of large amounts of offshore wind power going unused, and opportunities for further expansion could be stifled. Development could also be slowed by marine planning practices, regulations for awarding development rights and public acceptance issues.

The future of offshore wind looks bright but hinges on the right policies

The outlook for offshore wind is very positive as efforts to decarbonise and reduce local pollution accelerate. While offshore wind provides just 0.3% of global electricity supply today, it has vast potential around the world and an important role to play in the broader energy system. Offshore wind can drive down CO2 emissions and air pollutants from electricity generation. It can also do so in other sectors through the production of clean hydrogen and related fuels. The high system value of offshore wind offers advantages that make a strong case for its role alongside other renewables and low-carbon technologies. Government policies will continue to play a critical role in the future of offshore wind and  the overall pace of clean energy transitions around the world.


Related News

View more

Sign Up for Electricity Forum’s Newsletter

Stay informed with our FREE Newsletter — get the latest news, breakthrough technologies, and expert insights, delivered straight to your inbox.

Electricity Today T&D Magazine Subscribe for FREE

Stay informed with the latest T&D policies and technologies.
  • Timely insights from industry experts
  • Practical solutions T&D engineers
  • Free access to every issue

Download the 2025 Electrical Training Catalog

Explore 50+ live, expert-led electrical training courses –

  • Interactive
  • Flexible
  • CEU-cerified