Spain's power demand in April plummets under COVID-19 lockdown


spain wind power

NFPA 70e Training

Our customized live online or in‑person group training can be delivered to your staff at your location.

  • Live Online
  • 6 hours Instructor-led
  • Group Training Available
Regular Price:
$199
Coupon Price:
$149
Reserve Your Seat Today

Spain Electricity Demand April 2020 saw a 17.3% year-on-year drop as COVID-19 lockdown curbed activity; renewables and wind power lifted the emission-free share, while combined cycle plants dominated islands, per REE data.


Key Points

A 17.3% y/y decline amid COVID-19 lockdown, with 47.9% renewables and wind at 21.3% of the national power mix.

✅ Mainland demand -17%; Balearic -27.6%; Canary -20.3%.

✅ Emission-free share: 49.7% on the peninsula in April.

✅ Combined cycle led islands; coal absent in Balearics.


Demand for electricity in Spain dropped by 17.3% year-on-year to an estimated 17,104 GWh in April, aligning with a 15% global daily demand dip during the pandemic, while the country’s economy slowed down under the national state of emergency and lockdown measures imposed to curb the spread of COVID-19.

According to the latest estimates by Spanish grid operator Red Electrica de Espana (REE), the decline in demand was registered across Spain’s entire national territory, similar to a 10% UK drop during lockdown. On the mainland, it decreased by 17% to 16,191 GWh, while on the Balearic and the Canary Islands it plunged by 27.6% and 20.3%, respectively.

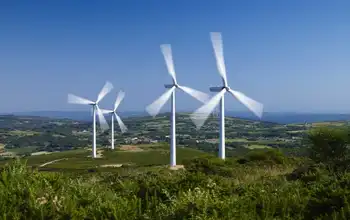
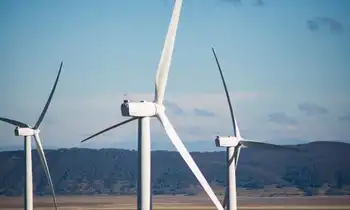
Renewables accounted for 47.9% of the total national electricity production in April, echoing Britain’s cleanest electricity trends during lockdown. Wind power production went down 20% year-on-year to 3,730 GWh, representing a 21.3% share in the total power mix.

During April, electricity generation in the peninsula was mostly based on emission-free technologies, reflecting an accelerated power-system transition across Europe, with renewables accounting for 49.7%. Wind farms produced 3,672 GWh, 20.1% less compared to April 2019, while contributing 22% to the power mix, even as global demand later surpassed pre-pandemic levels in subsequent periods.

In the Balearic Islands, electricity demand of 323,296 MWh was for the most part met by combined cycle power plants, even as some European demand held firm in later lockdowns, which accounted for 78.3% of the generation. Renewables and emission-free technologies had a combined share of 6.4%, while coal was again absent from the local power mix, completing now four consecutive months without contributing a single MWh.

In the Canary Islands system, demand for power decreased to 558,619 MWh, even as surging demand elsewhere strained power systems across the world. Renewables and emission-free technologies made up 14.3% of the mix, while combined cycle power plants led with a 45.3% share.


Related News

Related News

Tens of Thousands Left Without Power as 'Bomb Cyclone' Strikes B.C. Coast

British Columbia Bomb Cyclone disrupts coastal travel with severe wind gusts, heavy rainfall, widespread power outages, ferry cancellations, flooding, and landslides across Vancouver Island, straining emergency services and transport networks during the early holiday season.


Key Points

A rapidly intensifying storm hitting B.C.'s coast, causing damaging winds, heavy rain, power outages, and ferry delays.

✅ Wind gusts over 100 km/h and well above normal rainfall

✅ Power outages, flooded roads, and downed trees across the coast

✅ Ferry cancellations isolating communities and delaying supplies


A powerful storm, dubbed a "bomb cyclone," recently struck the British Columbia coast, wreaking havoc across the region. This intense weather system led to widespread disruptions, including power outages affecting tens of thousands of residents and the cancellation of ferry services, crucial for travel between coastal communities. The bomb cyclone is characterized by a rapid drop in pressure, resulting in extremely strong winds and heavy rainfall. These conditions caused significant damage, particularly along the coast and on Vancouver Island, where flooding and landslides led to fallen trees blocking roads, further complicating recovery efforts.

The storm's ferocity was especially felt in coastal areas, where wind gusts reached over 100 km/h, and rainfall totals were well above normal. The Vancouver region, already susceptible to storms during the winter months, faced dangerous conditions as power lines were downed, and transportation networks struggled to stay operational. Emergency services were stretched thin, responding to multiple weather-related incidents, including fallen trees, damaged infrastructure, and local flooding.

The ferry cancellations further isolated communities, especially those dependent on these services for essential supplies and travel. With many ferry routes out of service, residents had to rely on alternative transportation methods, which were often limited. The storm's timing, close to the start of the holiday season, also created additional challenges for those trying to make travel arrangements for family visits and other festive activities.

As cleanup efforts got underway, authorities warned that recovery would take time, particularly due to the volume of downed trees and debris. Crews worked to restore power and clear roads, while local governments urged people to stay indoors and avoid unnecessary travel, and BC Hydro's winter payment plan provided billing relief during outages. For those without power, the storm brought cold temperatures, and record electricity demand in 2021 showed how cold snaps strain the grid, making it crucial for families to find warmth and supplies.

In the aftermath of the bomb cyclone, experts highlighted the increasing frequency of such extreme weather events, driven in part by climate change and prolonged drought across the province. With the potential for more intense storms in the future, the region must be better prepared for these rapid weather shifts. Authorities are now focused on bolstering infrastructure to withstand such events, as all-time high demand has strained the grid recently, and improving early warning systems to give communities more time to prepare.

In the coming weeks, as British Columbia continues to recover, lessons learned from this storm will inform future responses to similar weather systems. For now, residents are advised to remain vigilant and prepared for any additional weather challenges, with recent blizzard and extreme cold in Alberta illustrating how conditions can deteriorate quickly.


Related News

View more

U.S. residential electricity bills increased 5% in 2022, after adjusting for inflation

U.S. Residential Electricity Bills rose on stronger demand, inflation, and fuel costs, with higher retail prices, kWh consumption, and extreme weather driving 2022 spikes; forecasts point to stable summer usage and slight price increases.


Key Points

They are average household power costs shaped by prices, kWh use, weather, and upstream fuel costs.

✅ 2022 bills up 13% nominal, 5% real vs. 2021

✅ Retail price rose 11%; consumption up 2% to 907 kWh

✅ Fuel costs to plants up 34%, pressuring rates


In nominal terms, the average monthly electricity bill for residential customers in the United States increased 13% from 2021 to 2022, rising from $121 a month to $137 a month. After adjusting for inflation—which reached 8% in 2022, a 40-year high—electricity bills increased 5%. Last year had the largest annual increase in average residential electricity spending since we began calculating it in 1984. The increase was driven by a combination of more extreme temperatures, which increased U.S. consumption of electricity for both heating and cooling, and higher fuel costs for power plants, which drove up retail electricity prices nationwide.

Residential electricity customers’ monthly electricity bills are based on the amount of electricity consumed and the retail electricity price. Average U.S. monthly electricity consumption per residential customer increased from 886 kilowatthours (kWh) in 2021 to 907 kWh in 2022, even as U.S. electricity sales have declined over the past seven years. Both a colder winter and a hotter summer contributed to the 2% increase in average monthly electricity consumption per residential customer in 2022 because customers used more space heating during the winter and more air conditioning during the summer, with some states, such as Pennsylvania, facing sharp winter rate increases.

Although we don’t directly collect retail electricity prices, we do collect revenues from electricity providers that allow us to determine prices by dividing by consumption, and industry reports show major utilities spending more on electricity delivery than on power production. In 2022, the average U.S. residential retail electricity price was 15.12 cents/kWh, an 11% increase from 13.66 cents/kWh in 2021. After adjusting for inflation, U.S. residential electricity prices went up by 2.5%.

Higher fuel costs for power plants drove the increase in residential retail electricity prices. The cost of fossil fuels—including natural gas prices, coal, and petroleum—delivered to U.S. power plants increased 34%, from $3.82 per million British thermal units (MMBtu) in 2021 to $5.13/MMBtu in 2022. The higher fuel costs were passed along to residential customers and contributed to higher retail electricity prices, and Germany power prices nearly doubled over a year in a related trend.

In the first three months of 2023, the average U.S. residential monthly electricity bill was $133, or 5% higher than for the same time last year, according to data from our Electric Power Monthly. The increase was driven by a 13% increase in the average U.S. residential retail electricity price, which was partly offset by a 7% decrease in average monthly electricity consumption per residential customer, and industry outlooks also see U.S. power demand sliding 1% on milder weather. This summer, we expect that typical household electricity bills will be similar to last year’s, with customers paying about 2% more on average. The slight increase in electricity costs forecast for this summer stems from higher retail electricity prices but similar consumption levels as last summer.


Related News

View more

Heat Exacerbates Electricity Struggles for 13,000 Families in America

Energy Poverty in Extreme Heat exposes vulnerable households to heatwaves, utility shutoffs, and unreliable grid infrastructure, straining public health. Community nonprofits, cooling centers, and policy reform aim to improve electricity access, resilience, and affordable energy.


Key Points

Without reliable, affordable power in heatwaves, health risks rise and cooling, food storage, and daily needs suffer.

✅ Risks: heat illness, dehydration, and indoor temperatures above 90F

✅ Causes: utility shutoffs, aging grid, unpaid bills, remote areas

✅ Relief: cooling centers, aid programs, weatherization, bill credits


In a particular pocket of America, approximately 13,000 families endure the dual challenges of sweltering heat and living without electricity, and the broader risk of summer shut-offs highlights how widespread these pressures have become across the country. This article examines the factors contributing to their plight, the impact of living without electricity during hot weather, and efforts to alleviate these hardships.

Challenges Faced by Families

For these 13,000 families, daily life is significantly impacted by the absence of electricity, especially during the scorching summer months. Without access to cooling systems such as air conditioners or fans, residents are exposed to dangerously high temperatures, which can lead to heat-related illnesses and discomfort, particularly among vulnerable populations such as children, the elderly, and individuals with health conditions, where electricity's role in public health became especially evident.

Causes of Electricity Shortages

The reasons behind the electricity shortages vary. In some cases, it may be due to economic challenges that prevent families from paying utility bills, resulting in disconnections. Other factors include outdated or unreliable electrical infrastructure in underserved communities, as reflected in a recent grid vulnerability report that underscores systemic risks, where maintenance and upgrades are often insufficient to meet growing demand.

Impact of Extreme Heat

During heatwaves, the lack of electricity exacerbates health risks and quality of life issues for affected families, aligning with reports of more frequent outages across the U.S. Furthermore, the absence of refrigeration and cooking facilities can compromise food safety and nutritional intake, further impacting household well-being.

Community Support and Resilience

Despite these challenges, communities and organizations often rally to support families living without electricity. Local nonprofits, community centers, and government agencies provide assistance such as distributing fans, organizing cooling centers, and delivering essentials like bottled water and non-perishable food items during heatwaves to alleviate immediate hardships and improve summer blackout preparedness in vulnerable neighborhoods.

Long-term Solutions

Addressing electricity access issues requires comprehensive, long-term solutions. These may include policy reforms to ensure equitable access to affordable energy, investments in upgrading infrastructure in underserved areas, and expanding financial assistance programs to help families maintain uninterrupted electricity service, in recognition that climate change risks increasingly stress the grid.

Advocacy and Awareness

Advocacy efforts play a crucial role in raising awareness about the challenges faced by families living without electricity and advocating for sustainable solutions. By highlighting these issues, community leaders, activists, and policymakers can work together to drive policy changes, secure funding for infrastructure improvements, and promote energy efficiency initiatives, drawing lessons from Canada's harsh-weather grid exposures that illustrate regional vulnerabilities.

Building Resilience

Building resilience in vulnerable communities involves not only improving access to reliable electricity but also enhancing preparedness for extreme weather events. This includes developing emergency response plans, educating residents about heat safety measures, and fostering community partnerships to support those in need during crises.

Conclusion

As temperatures rise and climate impacts intensify, addressing the plight of families living without electricity becomes increasingly urgent. By prioritizing equitable access to energy, investing in resilient infrastructure, and fostering community resilience, stakeholders can work towards ensuring that all families have access to essential services, even during the hottest months of the year. Collaborative efforts between government, nonprofit organizations, and community members are essential in creating sustainable solutions that improve quality of life and promote health and well-being for all residents.


Related News

View more

Clean energy jobs energize Pennsylvania: Clean Energy Employment Report

Pennsylvania Clean Energy Employment surges, highlighting workforce growth in energy efficiency, solar, wind, grid and storage, and alternative transportation, supporting COVID-19 recovery, high-wage jobs, manufacturing, construction, and statewide economic resilience.


Key Points

Jobs across clean power, efficiency, grid, storage, and advanced transport fueling Pennsylvania's workforce growth.

✅ 8.7% job growth from 2017-2019, outpacing statewide average

✅ 97,000+ employed across efficiency, solar, wind, grid, and fuels

✅ 75% earn above median; strong full-time opportunities


The 2020 Pennsylvania Clean Energy Employment Report has been released, and Gov. Tom Wolf is energized by it.

This "comes at an opportune time, as government and industry leaders look to strengthen Pennsylvania's workforce and economy in response to the challenges of the COVID-19 pandemic," Wolf said Monday in a prepared statement. "This detailed analysis of data and trends in clean energy employment ... demonstrates the sector was a top job generator statewide, and shows which industries were hiring and looking for trained workers."

Foremost among the findings, released Monday, is that the clean energy sector was responsible for adding 7,794 jobs from 2017 through 2019. That is an 8.7% average job growth rate, well above the 1.9% overall average in the state, according to a news release from Wolf's office.

This report lists employment data in five industries: energy efficiency; clean energy generation; alternative transportation; clean grid and storage; and clean fuels, while some cleaner states still import dirty electricity in regional markets.

The energy efficiency industry was the biggest clean energy employer in the state last year, with more than 71,400 state residents working in construction, technology and manufacturing jobs related to energy-efficient systems.

Solar energy workers comprised the largest share of the clean energy generation workforce – 35.4%, or 5,173 individuals. Solar employment increased 8.3% from 2017 to 2019, while there was a slight decline nationwide amid clean energy job losses reported in May.

Wind energy firms employed 2,937, and policy moves such as Ontario's clean electricity regulations signal broader market shifts, with more than 21% of those roles in manufacturing.

Job losses, though, were recorded in nuclear generation (minus 4.5%) and coal generation (minus 8.6%) over the two-year period, as electricity deregulation remains a point of debate in the sector. This mirrors national declines in both categories.

Federal efforts to support coal community revitalization are channeling clean energy projects to hard-hit regions.

Natural gas electric generation capacity doubled across Pennsylvania over the past decade; even as residents could face winter electricity price increases according to recent reports, employment still grew 13.4% from 2017 through 2019. But increasing output from unconventional wells has outpaced demand, sparking reductions in siting and drilling for new wells.

The Clean Energy Employment Report was released along with – and as part of – the 2020 Pennsylvania Energy Employment Report, which asserts that energy remains a large employer in the state, and new clean energy funding announcements underscore the sector's momentum. As of the last quarter of 2019, according to the larger report, energy accounted for 269,031 jobs, or 4.5% of the overall statewide workforce.

Wolf, in summary, said: "This report shows that workforce training investment decisions can benefit Pennsylvanians right now and position the state going forward to grow and improve livelihoods, the economy and our environment."


Related News

View more

Portland General Electric Program Will Transform Hundreds of Homes Into a Virtual Power Plant

PGE Residential Energy Storage Pilot aggregates 525 home batteries into a virtual power plant, enabling distributed energy resources, smart grid control, renewable energy optimization, demand response, and backup power across Portland General Electric's area.


Key Points

A PGE program aggregating 525 batteries into a utility-run virtual power plant for renewables support and backup power.

✅ Up to 4 MW aggregated capacity from 525 residential batteries

✅ Monthly credits: $40 ($20 with solar) for grid services

✅ Enhances smart grid, DERs, resilience, and outage backup


Portland General Electric Company is set to launch a pilot program that will incentivize installation and connection of 525 residential energy storage batteries that PGE will dispatch, contributing up to four megawatts of energy to PGE's grid. The distributed assets will create a virtual power plant made up of small units that can be operated individually or combined to serve the grid, adding flexibility that supports PGE's transition to a clean energy future. When the program launches this fall, incentives will be available to residential customers across PGE's service area. Rebates will be available to customers within three neighborhoods participating in PGE's Smart Grid Test Bed, and income-qualified customers participating in Energy Trust of Oregon's Solar Within Reach offer.

PGE will study the full benefits of energy storage that these distributed energy assets can provide the grid while also increasing resiliency for each participating customer. PGE will operate and test the benefits of using homes' batteries, each capable of storing 12 to 16 kWh of energy, to optimize the use of renewable energy and grid capabilities. In the event of a power outage, participating customers can rely on them as a backup power resource.

"Our vision for clean energy relies on a smart, integrated grid. One of the ways that we'll achieve that is through creative partnerships and diversified energy resources, including those behind-the-meter," said Larry Bekkedahl, vice president of Grid Architecture, Integration and Systems Operation. "This pilot project will allow PGE to integrate even more intermittent renewable energy and enhance grid capabilities while also giving participating customers peace of mind in the event of an outage."

Energy storage maximizes renewables and the grid, improves power quality

Energy storage, including long-duration energy storage solutions, is vital to help capture and store energy from renewable power sources, such as wind and solar, that are more variable. As a virtual power plant, the residential battery storage pilot will create a single resource that can help the grid balance energy production with energy demand, freeing up the generation resources that are typically held on standby, ready to kick in when the wind doesn't blow or the sun doesn't shine. As a clean energy option that takes the place of standby resources, the virtual power plant also gives customers access to reliable energy, even in the event of system outages.

The test program will also allow PGE to test new smart-grid control devices across its distribution system that will more effectively allow a two-way exchange between PGE and pilot participants. The new controls will more actively manage the way that electricity is distributed across PGE's system to incorporate energy that customers generate, such as through solar panels, while also meeting power demand that is less predictable, such as for charging electric vehicles, supporting EVs for grid stability strategies. The controls will allow PGE to more actively manage power distribution to improve power quality for all customers.

Select rebates and incentives will be available to participants, aligned with electric vehicle programs that encourage transportation electrification

When it launches in fall 2020, participation in the program will be available to residential customers, including:

* Those across PGE's service area who already have or are installing a qualifying battery. Participation will require an application, and in exchange for allowing PGE to operate their battery for grid services, similar to programs where EV owners selling power back for compensation, participating customers will receive a monthly bill credit of $40, or $20 if the battery is charged with solar power.

* Customers across PGE's service area who are participating in the Solar Within Reach offering from Energy Trust of Oregon. Participants will be eligible for a $5,000 instant rebate in addition to the monthly bill credits.

* Those living within the PGE Smart Grid Test Bed who purchase a battery will be eligible for an instant rebate, in addition to the monthly bill credit of $40 or $20, which will allow PGE to test the localized grid impact of having a large concentration of battery storage devices available on one substation and explore interfaces with vehicle-to-grid pilots in the region.

PGE is working with Energy Trust to cost-effectively procure the residential battery storage systems, as utilities invest in advanced storage solutions across the region, by leveraging the existing Solar incentive program infrastructure and trade ally contractor network. Customers who participate in the program will own their battery systems, and rebates will only be available for systems installed by an Energy Trust solar trade ally. The program may also accept customers with a qualifying battery that is was previously installed, following a process to ensure safe operation.

More information about Portland General Electric's energy storage program is available at PortlandGeneral.com/energystorage and will be updated with details about the residential battery storage pilot program.


Related News

View more

Four Facts about Covid and U.S. Electricity Consumption

COVID-19 Impact on U.S. Electricity Consumption shows commercial and industrial demand dropped as residential use rose, with flattened peak loads, weekday-weekend convergence, Texas hourly data, and energy demand as a real-time economic indicator.


Key Points

It reduced commercial and industrial demand while raising residential use, shifting peaks and weekday patterns.

✅ Commercial electricity down 12%; industrial down 14% in Q2 2020

✅ Residential use up 10% amid work-from-home and lockdowns

✅ Peaks flattened; weekday-weekend loads converged in Texas


This is an important turning point for the United States. We have a long road ahead. But one of the reasons I’m optimistic about Biden-Harris is that we will once again have an administration that believes in science.

To embrace this return to science, I want to write today about a fascinating new working paper by Tufts economist Steve Cicala.

Professor Cicala has been studying the effect of Covid on electricity consumption since back in March, when the Wall Street Journal picked up his work documenting an 18% decrease in electricity consumption in Italy.

The new work, focused on the United States, is particularly compelling because it uses data that allows him to distinguish between residential, commercial, and industrial sectors, against a backdrop of declining U.S. electricity sales over recent years.

Without further ado, here are four facts he uncovers about Covid and U.S. electricity demand during COVID-19 and consumption.


Fact #1: Firms Are Using Less
U.S. commercial electricity consumption fell 12% during the second quarter of 2020. U.S. industrial electricity consumption fell 14% over the same period.

This makes sense. The second quarter was by some measures, the worst quarter for the U.S. economy in over 145 years!

Economic activity shrank. Schools closed. Offices closed. Factories closed. Restaurants closed. Malls closed. Even health care offices closed as patients delayed going to the dentist and other routine care. All this means less heating and cooling, less lighting, less refrigeration, less power for computers and other office equipment, less everything.

The decrease in the industrial sector is a little more surprising. My impression had been that the industrial sector had not fallen as far as commercial, but amid broader disruptions in coal and nuclear power that strained parts of the energy economy, the patterns for both sectors are quite similar with the decline peaking in May and then partially rebounding by July. The paper also shows that areas with higher unemployment rates experienced larger declines in both sectors.


Fact #2: Households Are Using More
While firms are using less, households are using more. U.S. residential electricity consumption increased 10% during the second quarter of 2020. Consumption surged during March, April, and May, a reflection of the lockdown lifestyle many adopted, and then leveled off in June and July – with much less of the rebound observed on the commercial/industrial side.

This pattern makes sense, too. In Professor Cicala’s words, “people are spending an inordinate amount of time at home”. Many of us switched over to working from home almost immediately, and haven’t looked back. This means more air conditioning, more running the dishwasher, more CNN (especially last week), more Zoom, and so on.

The paper also examines the correlates of the decline. Areas in the U.S. where more people can work from home experienced larger increases. Unemployment rates, however, are almost completely uncorrelated with the increase.


Fact #3: Firms are Less Peaky
The paper next turns to a novel dataset from Texas, where Texas grid reliability is under active discussion, that makes it possible to measure hourly electricity consumption by sector.

As the figure above illustrates, the biggest declines in commercial/industrial electricity consumption have occurred Monday through Friday between 9AM and 5PM.

The dashed line shows the pattern during 2019. Notice the large spikes in electricity consumption during business hours. The solid line shows the pattern during 2020. Much smaller spikes during business hours.


Fact #4: Everyday is Like Sunday
Finally, we have what I would like to nominate as the “Energy Figure of the Year”.

Again, start with the pattern for 2019, reflected by the dashed line. Prior to Covid, Texas households used a lot more electricity on Saturdays and Sundays.

Then along comes Covid, and turned every day into the weekend. Residential electricity consumption in Texas during business hours Monday-Friday is up 16%(!).

In the pattern for 2020, it isn’t easy to distinguish weekends from weekdays. If you feel like weekdays and weekends are becoming a big blur – you are not alone.


Conclusion
Researchers are increasingly thinking about electricity consumption as a real-time indicator of economic activity, even as flat electricity demand complicates utility planning and investment. This is an intriguing idea, but Professor Cicala’s new paper shows that it is important to look sector-by-sector.

While commercial and industrial consumption indeed seem to measure the strength of an economy, residential consumption has been sharply countercylical – increasing exactly when people are not at work and not at school.

These large changes in behavior are specific to the pandemic. Still, with the increased blurring of home and non-home activities we may look back on 2020 as a key turning point in how we think about these three sectors of the economy.

More broadly, Professor Cicala’s paper highlights the value of social science research. We need facts, data, and yes, science, if we are to understand the economy and craft effective policies on energy insecurity and shut-offs as well.


Related News

View more

Sign Up for Electricity Forum’s Newsletter

Stay informed with our FREE Newsletter — get the latest news, breakthrough technologies, and expert insights, delivered straight to your inbox.

Electricity Today T&D Magazine Subscribe for FREE

Stay informed with the latest T&D policies and technologies.
  • Timely insights from industry experts
  • Practical solutions T&D engineers
  • Free access to every issue

Live Online & In-person Group Training

Advantages To Instructor-Led Training – Instructor-Led Course, Customized Training, Multiple Locations, Economical, CEU Credits, Course Discounts.

Request For Quotation

Whether you would prefer Live Online or In-Person instruction, our electrical training courses can be tailored to meet your company's specific requirements and delivered to your employees in one location or at various locations.