Substation Relay Protection Training
Our customized live online or in‑person group training can be delivered to your staff at your location.

- Live Online
- 12 hours Instructor-led
- Group Training Available
Regular Price:
$699
Coupon Price:
$599
LONDON
—
Great Britain electricity generation spans renewables and baseload: wind, solar, nuclear, gas, and biomass, supported by National Grid interconnectors, embedded energy estimates, and BMRS data for dynamic imports and exports across Europe.
The Situation Explained
A diverse, weather-driven mix of renewables, gas, nuclear, and imports coordinated by National Grid.
Baseload from nuclear and biomass; intermittent wind and solar
Interconnectors trade zero carbon imports via subsea cables
Data from BMRS and ESO covers embedded energy estimates
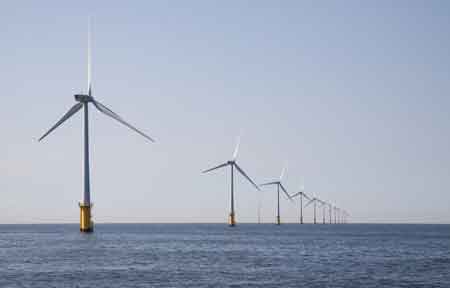
Great Britain has one of the most diverse ranges of electricity generation in Europe, with everything from windfarms off the coast of Scotland to a nuclear power station in Suffolk tasked with keeping the lights on. The increasing reliance on renewable energy sources, as part of the country’s green ambitions, also means there can be rapid shifts in the main source of electricity generation. On windy days, most electricity generation comes from record wind generation across onshore and offshore windfarms. When conditions are cold and still, gas-fired power stations known as peaking plants are called into action.
The electricity system in Great Britain relies on a combination of “baseload” power – from stable generators such as nuclear and biomass plants – and “intermittent” sources, such as wind and solar farms that need the right weather conditions to feed energy into the grid. National Grid also imports energy from overseas, through subsea cables known as interconnectors that link to France, Belgium, Norway and the Netherlands. They allow companies to trade excess power, such as renewable energy created by the sun, wind and water, between different countries. By 2030 it is hoped that 90% of the energy imported by interconnectors will be from zero carbon energy sources, though low-carbon electricity generation stalled in 2019 for the UK.
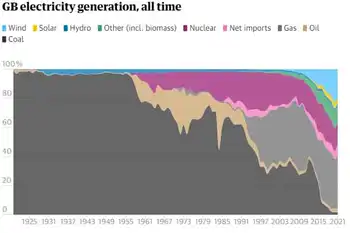
The technology behind Great Britain’s power generation has evolved significantly over the last century, and at times wind has been the main source of electricity. The first integrated national grid in the world was formed in 1935 linking seven regions of the UK. In the aftermath of industrialisation, coal provided the vast majority of power, before oil began to play an increasingly important part in the 1950s. In 1956, the world’s first commercial nuclear reactor, Calder Hall 1 at Windscale (later Sellafield), was opened by Queen Elizabeth II. Coal use fell significantly in the 1990s while the use of combined cycle gas turbines grew, and in 2016 wind generated more electricity than coal for the first time. Now a combination of gas, wind, nuclear and biomass provide the bulk of Great Britain’s energy, with smaller sources such as solar and hydroelectric power also used. From October 2024, coal will no longer be used to generate electricity, following coal-free power records set in recent years.
Energy generation data is fetched from the Balancing Mechanism Reporting Service public feed, provided by Elexon – which runs the wholesale energy market – and is updated every five minutes, covering periods when wind led the power mix as well.
Elexon’s data does not include embedded energy, which is unmetered and therefore invisible to Great Britain’s National Grid. Embedded energy comprises all solar energy and wind energy generated from non-metered turbines. To account for these figures we use embedded energy estimates from the National Grid electricity system operator, which are published every 30 minutes.
Import figures refer to the net flow of electricity from the interconnectors with Europe and with Northern Ireland. A positive value represents import into the GB transmission system, while a negative value represents an export.
Hydro figures combine renewable run-of-the-river hydropower and pumped storage.
Biomass figures include Elexon’s “other” category, which comprises coal-to-biomass conversions and biomass combined heat and power plants.
Related News
Related News

Sub-Saharan Africa has a huge electricity problem - but with challenge comes opportunity
Sub-Saharan Africa Energy Access faces critical deficits; SDG7, clean energy finance, off-grid solar, and microgrids…
View more

Hydro-Quebec won't ask for rate hike next year
Hydro-Quebec Rate Freeze maintains current electricity rates, aligned with Bill 34, inflation indexing, and energy…
View more
Alliant aims for carbon-neutral electricity, says plans will save billions for ratepayers
Alliant Energy Net-Zero Carbon Plan outlines carbon-neutral electricity by 2050, coal retirements by 2040, major…
View more

Ireland goes 25 days without using coal to generate electricity
Ireland Coal-Free Electricity Record: EirGrid reports 25 days without coal on the all-island grid, as…
View more
Understanding the Risks of EV Fires in Helene Flooding
EV Flood Fire Risks highlight climate change impacts, lithium-ion battery hazards, water damage, post-submersion inspection,…
View more
Nova Scotia Eyes Offshore Wind for U.S. Power Markets
Nova Scotia is advancing offshore wind plans to meet rising electricity demand at home while…
View more
Sign Up for Electricity Forum’s Newsletter
Stay informed with our FREE Newsletter — get the latest news, breakthrough technologies, and expert insights, delivered straight to your inbox.
Electricity Today T&D Magazine Subscribe for FREE

Stay informed with the latest T&D policies and technologies.
- Timely insights from industry experts
- Practical solutions T&D engineers
- Free access to every issue
