GDF Suez, VINCI and CDC submit bids for offshore wind energy in France

By Comtext


NFPA 70e Training

Our customized live online or in‑person group training can be delivered to your staff at your location.

  • Live Online
  • 6 hours Instructor-led
  • Group Training Available
Regular Price:
$199
Coupon Price:
$149
Reserve Your Seat Today
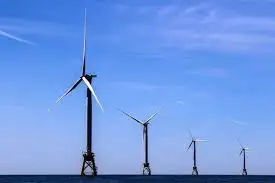
GDF Suez SA, VINCI and CDC Infrastructure have submitted their bids to the government to develop offshore wind energy, further to a call for tenders covering an expanse off the coast of France, encompassing 3,000 MW of wind energy, from 2015.

GDF SUEZ, VINCI and CDC Infrastructure are bidding on four of the five zones identified by the State as holding potential: Courseulles-sur-Mer Calvados, Dieppe-Le Treport Seine-Maritime, Somme, Fecamp Seine-Maritime and Saint-Brieuc Cotes d'Armor.

GDF SUEZ, VINCI and CDC Infrastructure will combine their complementary knowledge in renewable energies and the construction of major infrastructures, to put forth the best bid, whether with regard to economics, energy and environment. The consortium will furthermore draw upon a number of major and recognized industrial partners, in designing and producing offshore wind farms: AREVA and SIEMENS.

The consortium estimates that 80 of the business generated by the offshore wind farm market will be able to be developed in France, thus contributing to the economic development of the related regions and the creation of a full-fledged training sector. The resulting jobs, necessarily local, will be in wind farm construction and the subsequent operation.

Gerard Mestrallet, CEO of GDF SUEZ, stated: "GDF SUEZ is a central figure in renewable energies. The Group, leader in wind energy in France, wish to bring with its partners all of its expertise as an integrated energy generation expert in order to develop this ambitious offshore wind project and contribute to the emergence of a French industrial chain".

Related News

New England takes key step to 1.2 GW of Quebec hydro as Maine approves transmission line

NECEC Clean Energy Connect advances with Maine DEP permits, Hydro-Québec contracts, and rigorous transmission line mitigation, including tapered vegetation, culvert upgrades, and forest conservation, delivering low-carbon power, broadband fiber, and projected ratepayer savings.


Key Points

A Maine transmission project delivering Hydro-Québec power with strict DEP mitigation, lower bills, and added broadband.

✅ DEP permits mandate tapered vegetation, culvert upgrades, land conservation

✅ Hydro-Québec to supply 9.55 TWh/yr via MA contracts; bill savings 2-4%

✅ Added broadband fiber in Somerset and Franklin; local tax benefits


The Maine DEP reviewed the Clean Energy Connect project for more than two years, while regional interest in cross-border transmission continued to grow, before issuing permits that included additional environmental mitigation elements.

"Collectively, the requirements of the permit require an unprecedented level of environmental protection and compensatory land conservation for the construction of a transmission line in the state of Maine," DEP said in a May 11 statement.

Requirements include limits on transmission corridor width, forest preservation, culvert replacement and vegetation management projects, while broader grid programs like vehicle-to-grid integration enhance clean energy utilization across the region.

"In our original proposal we worked hard to develop a project that provided robust mitigation measures to protect the environment," NECEC Transmission CEO Thorn Dickinson said in a statement. "And through this permitting process, we now have made an exceedingly good project even better for Maine."

NECEC will be built on land owned or controlled by Central Maine Power. The 53 miles of new corridor on working forest land will use a new clearing technique for tapered vegetation, while the remainder of the project follows existing power lines.

Environmentalists said they agreed with the decision, and the mitigation measures state regulators took, noting similar momentum behind new wind investments in other parts of Canada.

"Building new ways to deliver low-carbon energy to our region is a critical piece of tackling the climate crisis," CLF Senior Attorney Phelps Turner said in a statement. "DEP was absolutely right to impose significant environmental conditions on this project and ensure that it does not harm critical wildlife areas."

Once complete, Turner said the transmission line will allow the region "to retire dirty fossil fuel plants in the coming years, which is a win for our health and our climate."

The Massachusetts Department of Public Utilities in June 2019 advanced the project by approving contracts for the state's utilities to purchase 9,554,940 MWh annually from Hydro-Quebec. Officials said the project is expected to provide approximately 2% to 4% savings on monthly energy bills.

Total net benefits to Massachusetts ratepayers over the 20-year contract, including both direct and indirect benefits, are expected to be approximately $4 billion, according to the state's estimates.

NECEC "will also deliver significant economic benefits to Maine and the region, including lower electricity prices, increased local real estate taxes and reduced energy costs with examples like battery-backed community microgrids demonstrating local resilience, expanded fiber optic cable for broadband service in Somerset and Franklin counties and funding of economic development for Western Maine," project developers said in a statement.​


Related News

View more

Tens of Thousands Left Without Power as 'Bomb Cyclone' Strikes B.C. Coast

British Columbia Bomb Cyclone disrupts coastal travel with severe wind gusts, heavy rainfall, widespread power outages, ferry cancellations, flooding, and landslides across Vancouver Island, straining emergency services and transport networks during the early holiday season.


Key Points

A rapidly intensifying storm hitting B.C.'s coast, causing damaging winds, heavy rain, power outages, and ferry delays.

✅ Wind gusts over 100 km/h and well above normal rainfall

✅ Power outages, flooded roads, and downed trees across the coast

✅ Ferry cancellations isolating communities and delaying supplies


A powerful storm, dubbed a "bomb cyclone," recently struck the British Columbia coast, wreaking havoc across the region. This intense weather system led to widespread disruptions, including power outages affecting tens of thousands of residents and the cancellation of ferry services, crucial for travel between coastal communities. The bomb cyclone is characterized by a rapid drop in pressure, resulting in extremely strong winds and heavy rainfall. These conditions caused significant damage, particularly along the coast and on Vancouver Island, where flooding and landslides led to fallen trees blocking roads, further complicating recovery efforts.

The storm's ferocity was especially felt in coastal areas, where wind gusts reached over 100 km/h, and rainfall totals were well above normal. The Vancouver region, already susceptible to storms during the winter months, faced dangerous conditions as power lines were downed, and transportation networks struggled to stay operational. Emergency services were stretched thin, responding to multiple weather-related incidents, including fallen trees, damaged infrastructure, and local flooding.

The ferry cancellations further isolated communities, especially those dependent on these services for essential supplies and travel. With many ferry routes out of service, residents had to rely on alternative transportation methods, which were often limited. The storm's timing, close to the start of the holiday season, also created additional challenges for those trying to make travel arrangements for family visits and other festive activities.

As cleanup efforts got underway, authorities warned that recovery would take time, particularly due to the volume of downed trees and debris. Crews worked to restore power and clear roads, while local governments urged people to stay indoors and avoid unnecessary travel, and BC Hydro's winter payment plan provided billing relief during outages. For those without power, the storm brought cold temperatures, and record electricity demand in 2021 showed how cold snaps strain the grid, making it crucial for families to find warmth and supplies.

In the aftermath of the bomb cyclone, experts highlighted the increasing frequency of such extreme weather events, driven in part by climate change and prolonged drought across the province. With the potential for more intense storms in the future, the region must be better prepared for these rapid weather shifts. Authorities are now focused on bolstering infrastructure to withstand such events, as all-time high demand has strained the grid recently, and improving early warning systems to give communities more time to prepare.

In the coming weeks, as British Columbia continues to recover, lessons learned from this storm will inform future responses to similar weather systems. For now, residents are advised to remain vigilant and prepared for any additional weather challenges, with recent blizzard and extreme cold in Alberta illustrating how conditions can deteriorate quickly.


Related News

View more

Duke Energy reaffirms capital investments in renewables and grid projects to deliver cleaner energy, economic growth

Duke Energy Clean Energy Strategy advances renewables, battery storage, grid modernization, and energy efficiency to cut carbon, retire coal, and target net-zero by 2050 across the Carolinas with robust IRPs and capital investments.


Key Points

Plan to expand renewables, storage, and grid upgrades to cut carbon and reach net-zero electricity by 2050.

✅ 56B investment in renewables, storage, and grid modernization

✅ Targets 50% carbon reduction by 2030 and net-zero by 2050

✅ Retires coal units; expands energy efficiency and IRPs


Duke Energy says that the company will continue advancing its ambitious clean energy goals without the Atlantic Coast Pipeline (ACP) by investing in renewables, battery storage, energy efficiency programs and grid projects that support U.S. electrification efforts.

Duke Energy, the nation's largest electric utility, unveils its new logo. (PRNewsFoto/Duke Energy) (PRNewsfoto/Duke Energy)

Duke Energy's $56 billion capital investment plan will deliver significant customer benefits and create jobs at a time when policymakers at all levels are looking for ways to rebuild the economy in 2020 and beyond. These investments will deliver cleaner energy for customers and communities while enhancing the energy grid to provide greater reliability and resiliency.

"Sustainability and the reduction of carbon emissions are closely tied to our region's success," said Lynn Good, Duke Energy Chair, President and CEO. "In our recent Climate Report, we shared a vision of a cleaner electricity future with an increasing focus on renewables and battery storage in addition to a diverse mix of zero-carbon nuclear, natural gas, hydro and energy efficiency programs.

"Achieving this clean energy vision will require all of us working together to develop a plan that is smart, equitable and ensures the reliability and affordability that will spur economic growth in the region. While we're disappointed that we're not able to move forward with ACP, we will continue exploring ways to help our customers and communities, particularly in eastern North Carolina where the need is great," said Good.

Already a clean-energy leader, Duke Energy has reduced its carbon emissions by 39% from 2005 and remains on track to cut its carbon emissions by at least 50% by 2030, as peers like Alliant's carbon-neutral plan demonstrate broader industry momentum toward decarbonization. The company also has an ambitious clean energy goal of reaching net-zero emissions from electricity generation by 2050. 

In September 2020, Duke Energy plans to file its Integrated Resource Plans (IRP) for the Carolinas after an extensive process of working with the state's leaders, policymakers, customers and other stakeholders. The IRPs will include multiple scenarios to support a path to a cleaner energy future in the Carolinas, reflecting key utility trends shaping resource planning.

Since 2010, Duke Energy has retired 51 coal units totaling more than 6,500 megawatts (MW) and plans to retire at least an additional 900 MW by the end of 2024. In 2019, the company proposed to shorten the book lives of another approximately 7,700 MW of coal capacity in North Carolina and Indiana.

Duke Energy will host an analyst call in early August 2020 to discuss second quarter 2020 financial results and other business and financial updates. The company will also host its inaugural Environmental, Social and Governance (ESG) investor day in October 2020.


Duke Energy

Duke Energy is transforming its customers' experience, modernizing the energy grid, generating cleaner energy and expanding natural gas infrastructure to create a smarter energy future for the people and communities it serves. The Electric Utilities and Infrastructure unit's regulated utilities serve 7.8 million retail electric customers in six states: North Carolina, South Carolina, Florida, Indiana, Ohio and Kentucky. The Gas Utilities and Infrastructure unit distributes natural gas to 1.6 million customers in five states: North Carolina, South Carolina, Tennessee, Ohio and Kentucky. The Duke Energy Renewables unit operates wind and solar generation facilities across the U.S., as well as energy storage and microgrid projects.

Duke Energy was named to Fortune's 2020 "World's Most Admired Companies" list and Forbes' "America's Best Employers" list. More information about the company is available at duke-energy.com. The Duke Energy News Center contains news releases, fact sheets, photos, videos and other materials. Duke Energy's illumination features stories about people, innovations, community topics and environmental issues. Follow Duke Energy on Twitter, LinkedIn, Instagram and Facebook.


Forward-Looking Information

This document includes forward-looking statements within the meaning of Section 27A of the Securities Act of 1933 and Section 21E of the Securities Exchange Act of 1934. Forward-looking statements are based on management's beliefs and assumptions and can often be identified by terms and phrases that include "anticipate," "believe," "intend," "estimate," "expect," "continue," "should," "could," "may," "plan," "project," "predict," "will," "potential," "forecast," "target," "guidance," "outlook" or other similar terminology. Various factors may cause actual results to be materially different than the suggested outcomes within forward-looking statements; accordingly, there is no assurance that such results will be realized. These factors include, but are not limited to:

  • The impact of the COVID-19 electricity demand shift on operations and revenues;
  • State, federal and foreign legislative and regulatory initiatives, including costs of compliance with existing and future environmental requirements, including those related to climate change, as well as rulings that affect cost and investment recovery or have an impact on rate structures or market prices;
  • The extent and timing of costs and liabilities to comply with federal and state laws, regulations and legal requirements related to coal ash remediation, including amounts for required closure of certain ash impoundments, are uncertain and difficult to estimate;
  • The ability to recover eligible costs, including amounts associated with coal ash impoundment retirement obligations and costs related to significant weather events, and to earn an adequate return on investment through rate case proceedings and the regulatory process;
  • The costs of decommissioning nuclear facilities could prove to be more extensive than amounts estimated and all costs may not be fully recoverable through the regulatory process;
  • Costs and effects of legal and administrative proceedings, settlements, investigations and claims;
  • Industrial, commercial and residential growth or decline in service territories or customer bases resulting from sustained downturns of the economy and the economic health of our service territories or variations in customer usage patterns, including energy efficiency and demand response efforts and use of alternative energy sources, such as self-generation and distributed generation technologies;
  • Federal and state regulations, laws and other efforts designed to promote and expand the use of energy efficiency measures and distributed generation technologies, such as private solar and battery storage, in Duke Energy service territories could result in customers leaving the electric distribution system, excess generation resources as well as stranded costs;
  • Advancements in technology;
  • Additional competition in electric and natural gas markets and continued industry consolidation;
  • The influence of weather and other natural phenomena on operations, including the economic, operational and other effects of severe storms, hurricanes, droughts, earthquakes and tornadoes, including extreme weather associated with climate change;
  • The ability to successfully operate electric generating facilities and deliver electricity to customers including direct or indirect effects to the company resulting from an incident that affects the U.S. electric grid or generating resources;
  • The ability to obtain the necessary permits and approvals and to complete necessary or desirable pipeline expansion or infrastructure projects in our natural gas business;
  • Operational interruptions to our natural gas distribution and transmission activities;
  • The availability of adequate interstate pipeline transportation capacity and natural gas supply;
  • The impact on facilities and business from a terrorist attack, cybersecurity threats, data security breaches, operational accidents, information technology failures or other catastrophic events, such as fires, explosions, pandemic health events or other similar occurrences;
  • The inherent risks associated with the operation of nuclear facilities, including environmental, health, safety, regulatory and financial risks, including the financial stability of third-party service providers;
  • The timing and extent of changes in commodity prices and interest rates and the ability to recover such costs through the regulatory process, where appropriate, and their impact on liquidity positions and the value of underlying assets;
  • The results of financing efforts, including the ability to obtain financing on favorable terms, which can be affected by various factors, including credit ratings, interest rate fluctuations, compliance with debt covenants and conditions and general market and economic conditions;
  • Credit ratings of the Duke Energy Registrants may be different from what is expected;
  • Declines in the market prices of equity and fixed-income securities and resultant cash funding requirements for defined benefit pension plans, other post-retirement benefit plans and nuclear decommissioning trust funds;
  • Construction and development risks associated with the completion of the Duke Energy Registrants' capital investment projects, including risks related to financing, obtaining and complying with terms of permits, meeting construction budgets and schedules and satisfying operating and environmental performance standards, as well as the ability to recover costs from customers in a timely manner, or at all;
  • Changes in rules for regional transmission organizations, including FERC debates on coal and nuclear subsidies and new and evolving capacity markets, and risks related to obligations created by the default of other participants;
  • The ability to control operation and maintenance costs;
  • The level of creditworthiness of counterparties to transactions;
  • The ability to obtain adequate insurance at acceptable costs;
  • Employee workforce factors, including the potential inability to attract and retain key personnel;
  • The ability of subsidiaries to pay dividends or distributions to Duke Energy Corporation holding company (the Parent);
  • The performance of projects undertaken by our nonregulated businesses and the success of efforts to invest in and develop new opportunities;
  • The effect of accounting pronouncements issued periodically by accounting standard-setting bodies;
  • The impact of U.S. tax legislation to our financial condition, results of operations or cash flows and our credit ratings;
  • The impacts from potential impairments of goodwill or equity method investment carrying values; and
  • The ability to implement our business strategy, including enhancing existing technology systems.
  • Additional risks and uncertainties are identified and discussed in the Duke Energy Registrants' reports filed with the SEC and available at the SEC's website at sec.gov. In light of these risks, uncertainties and assumptions, the events described in the forward-looking statements might not occur or might occur to a different extent or at a different time than described. Forward-looking statements speak only as of the date they are made and the Duke Energy Registrants expressly disclaim an obligation to publicly update or revise any forward-looking statements, whether as a result of new information, future events or otherwise.


Related News

View more

Opinion: Fossil-fuel workers ready to support energy transition

Canada Net-Zero Transition unites energy workers, R&D, and clean tech to decarbonize steel and cement with hydrogen, scale renewables, and build hybrid storage, delivering a just transition that strengthens communities and the economy.


Key Points

A national plan to reach net-zero by 2050 via renewables, hydrogen, decarbonization, and a just transition for workers.

✅ Hydrogen for steel and cement decarbonization

✅ Hybrid energy storage and clean tech R&D

✅ Just transition pathways for energy workers


Except for an isolated pocket of skeptics, there is now an almost universal acceptance that climate change is a global emergency that demands immediate and far-reaching action to defend our home and future generations. Yet in Canada we remain largely focused on how the crisis divides us rather than on the potential for it to unite us, despite nationwide progress in electricity decarbonization efforts.

It’s not a case of fossil-fuel industry workers versus the rest, or Alberta versus British Columbia where bridging the electricity gap could strengthen cooperation. We are all in this together. The challenge now is how to move forward in a way that leaves no one behind.

The fossil fuel industry has been — and continues to be — a key driver of Canada’s economy. Both of us had successful careers in the energy sector, but realized, along with an increasing number of energy workers, that the transition we need to cope with climate change could not be accomplished solely from within the industry.

Even as resource companies innovate to significantly reduce the carbon burden of each barrel, the total emission of greenhouse gases from all sources continues to rise. We must seize the opportunity to harness this innovative potential in alternative and complementary ways, mobilizing research and development, for example, to power carbon-intensive steelmaking and cement manufacture from hydrogen or to advance hybrid energy storage systems and decarbonizing Canada's electricity grid strategies — the potential for cross-over technology is immense.

The bottom line is inescapable: we must reach net-zero emissions by 2050 in order to prevent runaway global warming, which is why we launched Iron & Earth in 2016. Led by oilsands workers committed to increasingly incorporating renewable energy projects into our work scope, our non-partisan membership now includes a range of industrial trades and professions who share a vision for a sustainable energy future for Canada — one that would ensure the health and equity of workers, our families, communities, the economy, and the environment.

Except for an isolated pocket of skeptics, there is now an almost universal acceptance that climate change is a global emergency that demands immediate and far-reaching action, including cleaning up Canada's electricity to meet climate pledges, to defend our home and future generations. Yet in Canada we remain largely focused on how the crisis divides us rather than on the potential for it to unite us.

It’s not a case of fossil-fuel industry workers versus the rest, or Alberta versus British Columbia. We are all in this together. The challenge now is how to move forward in a way that leaves no one behind.

The fossil fuel industry has been — and continues to be — a key driver of Canada’s economy. Both of us had successful careers in the energy sector, but realized, along with an increasing number of energy workers, that the transition we need to cope with climate change could not be accomplished solely from within the industry.

Even as resource companies innovate to significantly reduce the carbon burden of each barrel, the total emission of greenhouse gases from all sources continues to rise, underscoring that Canada will need more electricity to hit net-zero, according to the IEA. We must seize the opportunity to harness this innovative potential in alternative and complementary ways, mobilizing research and development, for example, to power carbon-intensive steelmaking and cement manufacture from hydrogen or to advance hybrid energy storage systems — the potential for cross-over technology is immense.

The bottom line is inescapable: we must reach net-zero emissions by 2050 in order to prevent runaway global warming, which is why we launched Iron & Earth in 2016. Led by oilsands workers committed to increasingly incorporating renewable energy projects into our work scope, as calls for a fully renewable electricity grid by 2030 gain attention, our non-partisan membership now includes a range of industrial trades and professions who share a vision for a sustainable energy future for Canada — one that would ensure the health and equity of workers, our families, communities, the economy, and the environment.


Related News

View more

Which of the cleaner states imports dirty electricity?

Hourly Electricity Emissions Tracking maps grid balancing areas, embodied emissions, and imports/exports, revealing carbon intensity shifts across PJM, ERCOT, and California ISO, and clarifying renewable energy versus coal impacts on health and climate.


Key Points

An hourly method tracing generation, flows, and embodied emissions to quantify carbon intensity across US balancing areas.

✅ Hourly traces of imports/exports and generation mix

✅ Consumption-based carbon intensity by balancing area

✅ Policy insights for renewables, coal, health costs


In the United States, electricity generation accounts for nearly 30% of our carbon emissions. Some states have responded to that by setting aggressive renewable energy standards; others are hoping to see coal propped up even as its economics get worse. Complicating matters further is the fact that many regional grids are integrated, and as America goes electric the stakes grow, meaning power generated in one location may be exported and used in a different state entirely.

Tracking these electricity exports is critical for understanding how to lower our national carbon emissions. In addition, power from a dirty source like coal has health and environment impacts where it's produced, and the costs of these aren't always paid by the parties using the electricity. Unfortunately, getting reliable figures on how electricity is produced and where it's used is challenging, even for consumers trying to find where their electricity comes from in the first place, leaving some of the best estimates with a time resolution of only a month.

Now, three Stanford researchers—Jacques A. de Chalendar, John Taggart, and Sally M. Benson—have greatly improved on that standard, and they have managed to track power generation and use on an hourly basis. The researchers found that, of the 66 grid balancing areas within the United States, only three have carbon emissions equivalent to our national average, and they have found that imports and exports of electricity have both seasonal and daily changes. de Chalendar et al. discovered that the net results can be substantial, with imported electricity increasing California's emissions/power by 20%.

Hour by hour
To figure out the US energy trading landscape, the researchers obtained 2016 data for grid features called balancing areas. The continental US has 66 of these, providing much better spatial resolution on the data than the larger grid subdivisions. This doesn't cover everything—several balancing areas in Canada and Mexico are tied in to the US grid—and some of these balancing areas are much larger than others. The PJM grid, serving Pennsylvania, New Jersey, and Maryland, for example, is more than twice as large as Texas' ERCOT, in a state that produces and consumes the most electricity in the US.

Despite these limitations, it's possible to get hourly figures on how much electricity was generated, what was used to produce it, and whether it was used locally or exported to another balancing area. Information on the generating sources allowed the researchers to attach an emissions figure to each unit of electricity produced. Coal, for example, produces double the emissions of natural gas, which in turn produces more than an order of magnitude more carbon dioxide than the manufacturing of solar, wind, or hydro facilities. These figures were turned into what the authors call "embodied emissions" that can be traced to where they're eventually used.

Similar figures were also generated for sulfur dioxide and nitrogen oxides. Released by the burning of fossil fuels, these can both influence the global climate and produce local health problems.

Huge variation
The results were striking. "The consumption-based carbon intensity of electricity varies by almost an order of magnitude across the different regions in the US electricity system," the authors conclude. The low is the Bonneville Power grid region, which is largely supplied by hydropower; it has typical emissions below 100kg of carbon dioxide per megawatt-hour. The highest emissions come in the Ohio Valley Electric region, where emissions clear 900kg/MW-hr. Only three regional grids match the overall grid emissions intensity, although that includes the very large PJM (where capacity auction payouts recently fell), ERCOT, and Southern Co balancing areas.

Most of the low-emissions power that's exported comes from the Pacific Northwest's abundant hydropower, while the Rocky Mountains area exports electricity with the highest associated emissions. That leads to some striking asymmetries. Local generation in the hydro-rich Idaho Power Company has embodied emissions of only 71kg/MW-hr, while its imports, coming primarily from Rocky Mountain states, have a carbon content of 625kg/MW-hr.

The reliance on hydropower also makes the asymmetry seasonal. Local generation is highest in the spring as snow melts, but imports become a larger source outside this time of year. As solar and wind can also have pronounced seasonal shifts, similar changes will likely be seen as these become larger contributors to many of these regional grids. Similar things occur daily, as both demand and solar production (and, to a lesser extent, wind) have distinct daily profiles.

The Golden State
California's CISO provides another instructive case. Imports represent less than 30% of its total electric use in 2016, yet California electricity imports provided 40% of its embodied emissions. Some of these, however, come internally from California, provided by the Los Angeles Department of Water and Power. The state itself, however, has only had limited tracking of imported emissions, lumping many of its sources as "other," and has been exporting its energy policies to Western states in ways that shape regional markets.

Overall, the 2016 inventory provides a narrow picture of the US grid, as plenty of trends are rapidly changing our country's emissions profile, including the rise of renewables and the widespread adoption of efficiency measures and other utility trends in 2017 that continue to evolve. The method developed here can, however, allow for annual updates, providing us with a much better picture of trends. That could be quite valuable to track things like how the rapid rise in solar power is altering the daily production of clean power.

More significantly, it provides a basis for more informed policymaking. States that wish to promote low-emissions power can use the information here to either alter the source of their imports or to encourage the sites where they're produced to adopt more renewable power. And those states that are exporting electricity produced primarily through fossil fuels could ensure that the locations where the power is used pay a price that includes the health costs of its production.


Related News

View more

This Floating Hotel Will Generate Electricity By Rotating All Day

Floating Rotating Eco Hotel harnesses renewable energy via VAWTAU, recycles rainwater for greywater, and follows zero-waste principles. This mobile, off-grid, Qatar-based resort generates electricity by slow 360-degree rotation while offering luxury amenities.


Key Points

A mobile, off-grid hotel that rotates to generate power, uses VAWTAU, recycles greywater, and targets zero-waste.

✅ Rotates 360 deg in 24 hours to produce electricity

✅ VAWTAU system: vertical-axis turbine and sun umbrella

✅ Rain capture and greywater recycling minimize waste


A new eco-friendly, floating hotel plans to generate its own electricity by rotating while guests relax on board, echoing developments like the solar Marriott hotel in sustainable hospitality.

Led by Hayri Atak Architectural Design Studio (HAADS), the structure will be completely mobile, meaning it can float from place to place, never sitting in a permanent position. Building began in March 2020 and the architects aim for it to be up and running by 2025.

It will be based in Qatar, but has the potential to be located in different areas due to its mobility, and it sits within a region advancing projects such as solar hydrogen production that signal a broader clean-energy shift.

The design includes minimum energy loss and a zero waste principle at its core, aligning with progress in wave energy research that aims to power a clean future. As it will rotate around all day long, this will generate electrical energy to power the whole hotel.

But guests won’t feel too dizzy, as it takes 24 hours for the hotel to spin 360 degrees.

The floating hotel will stay within areas with continuous currents, to ensure that it is always rotating, drawing on ideas from ocean and river power systems that exploit natural flows. This type of green energy production is called ‘vawtau’ (vertical axis wind turbine and umbrella) which works like a wind turbine on the vertical axis, while alternative approaches like kite-based wind energy target stronger, high-altitude currents as well, and functions as a sun umbrella on the coastal band.

Beyond marine-current concepts such as underwater kites, the structure will also make use of rainwater to create power. A cover on the top of the hotel will collect rain to be used for greywater recycling. This is when wastewater is plumbed straight back into toilets, washing machines or outside taps to maximise efficiency.

The whole surface area is around 35,000 m², comparable in scale to emerging floating solar plants that demonstrate modular, water-based infrastructure, and there are a total of 152 rooms. It will have three different entrances so that there is access to the land at any time of the day, thanks to the 140-degree pier that surrounds it.

There will also be indoor and outdoor swimming pools, a sauna, spa, gym, mini golf course and other activity areas.


Related News

View more

Sign Up for Electricity Forum’s Newsletter

Stay informed with our FREE Newsletter — get the latest news, breakthrough technologies, and expert insights, delivered straight to your inbox.

Electricity Today T&D Magazine Subscribe for FREE

Stay informed with the latest T&D policies and technologies.
  • Timely insights from industry experts
  • Practical solutions T&D engineers
  • Free access to every issue

Download the 2025 Electrical Training Catalog

Explore 50+ live, expert-led electrical training courses –

  • Interactive
  • Flexible
  • CEU-cerified